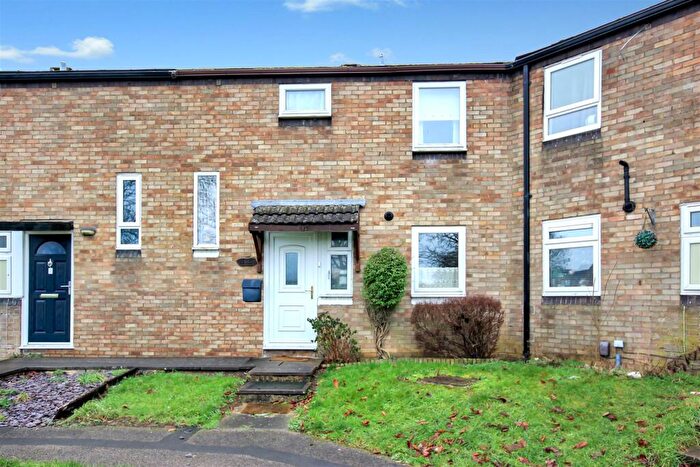
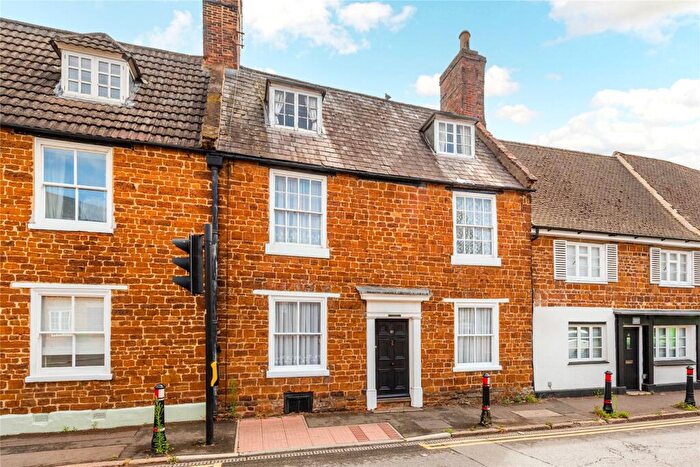
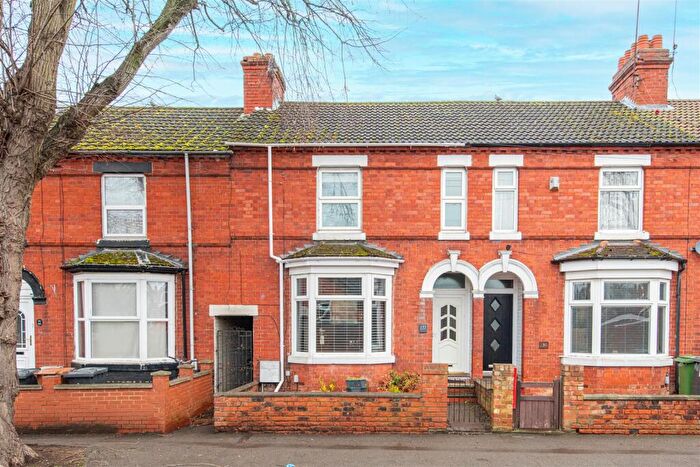
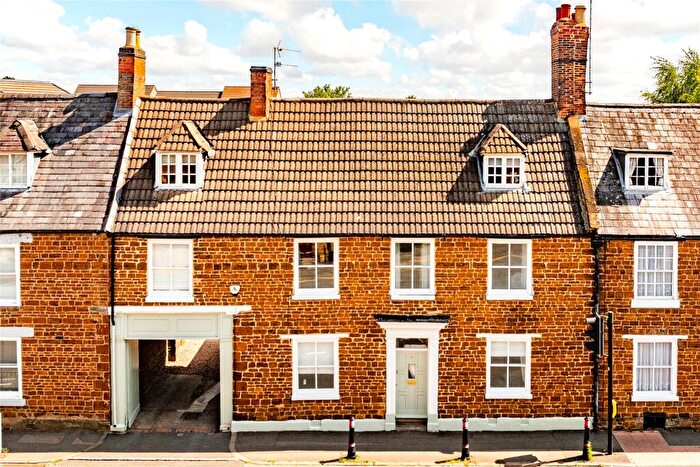
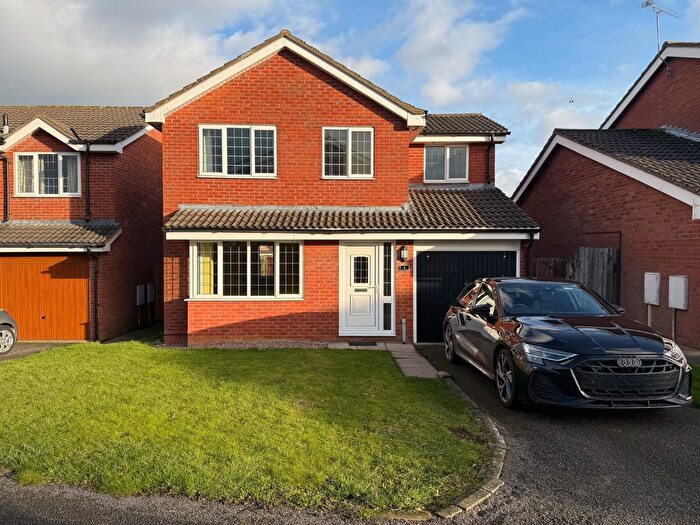
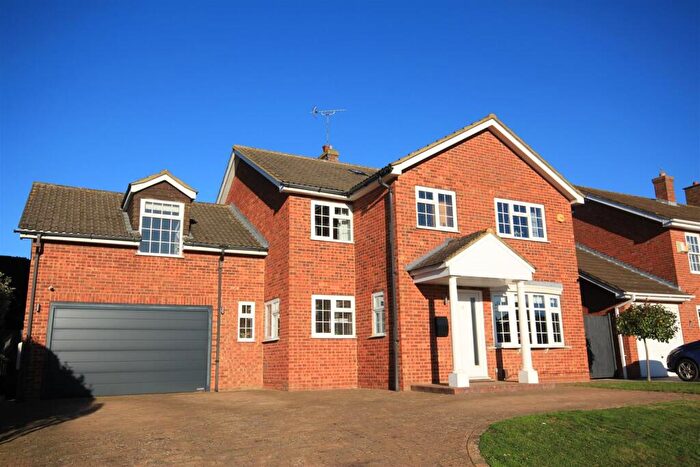
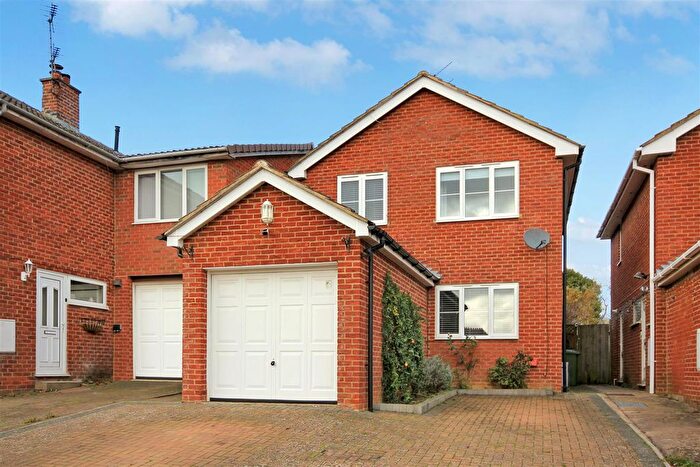
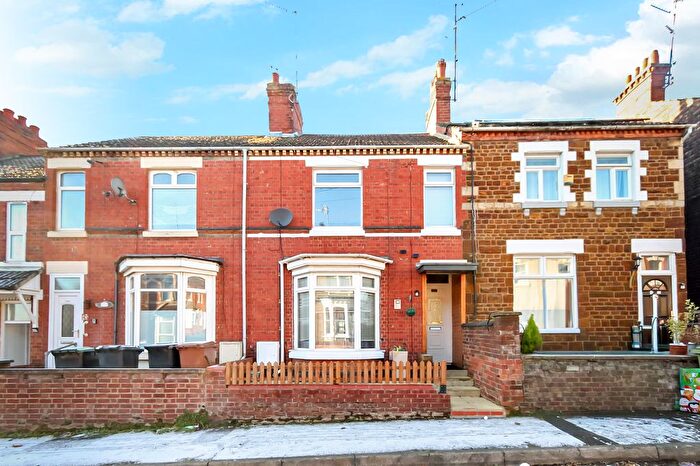
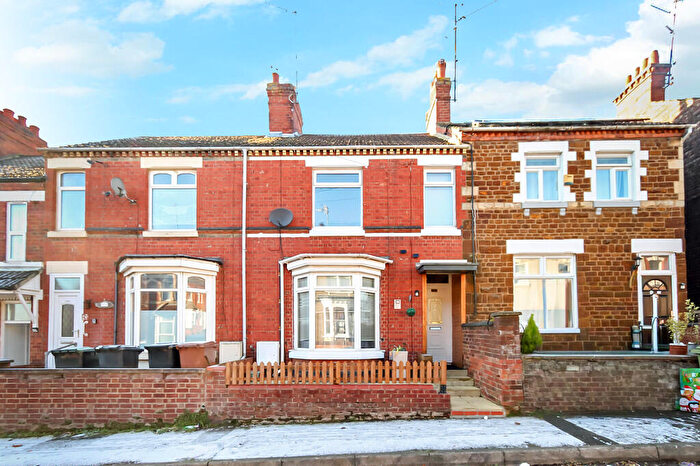
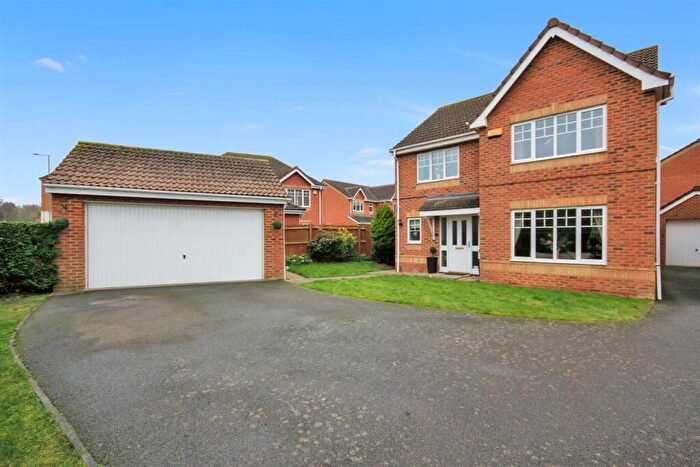
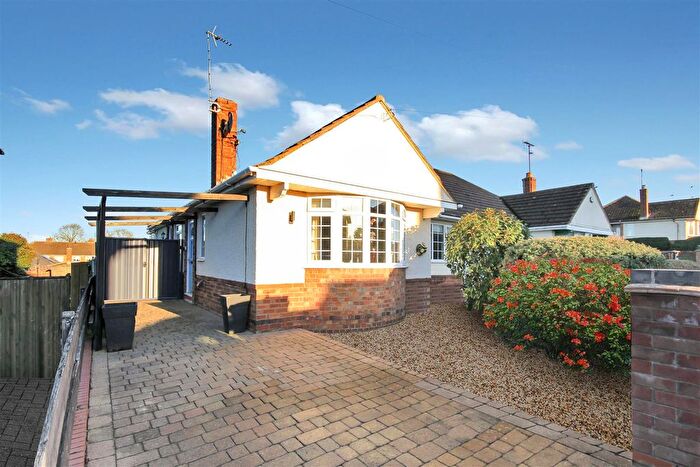
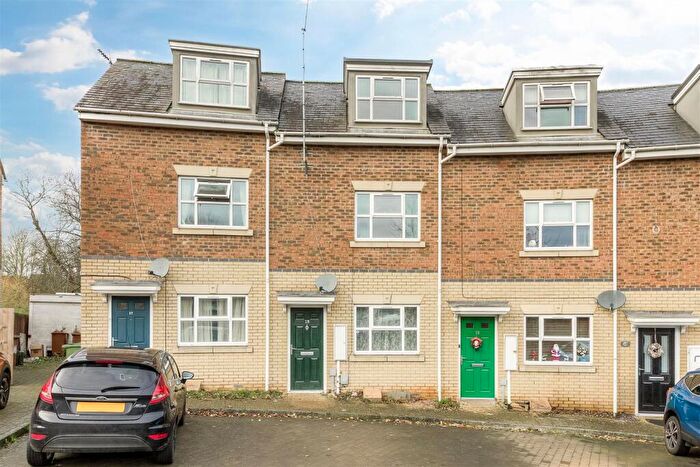
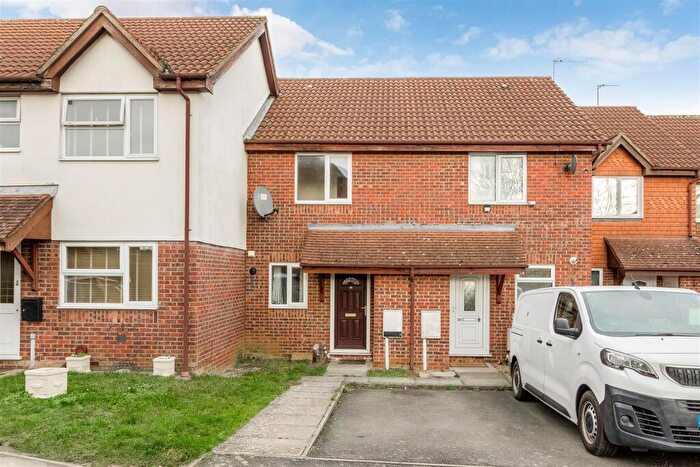
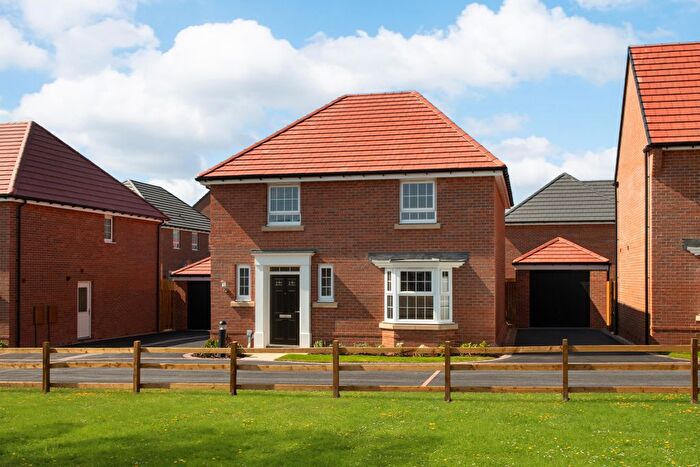
Houses for sale & to rent in Redwell East, Wellingborough
House Prices in Redwell East
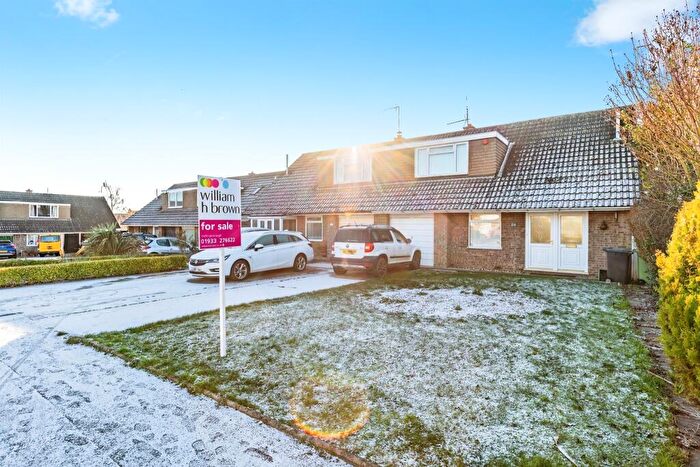
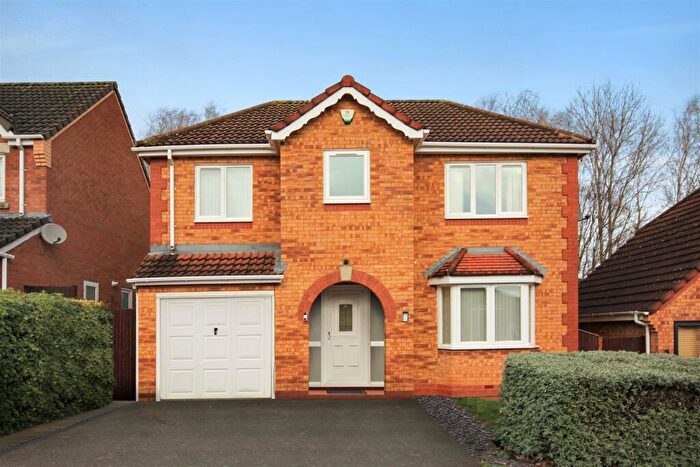
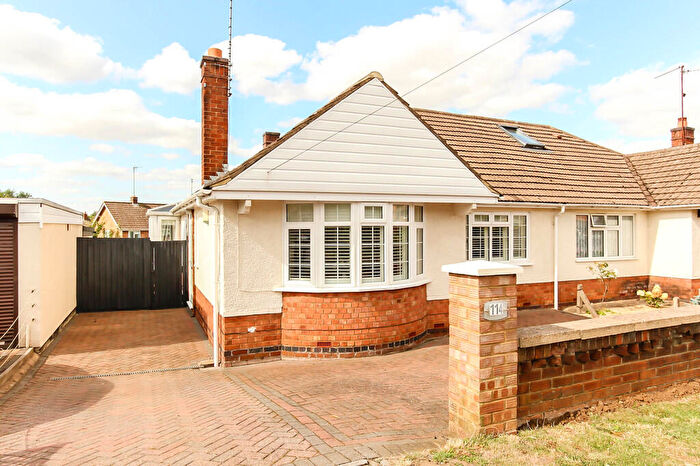
Properties in Redwell East have an average house price of £330,650.00 and had 202 Property Transactions within the last 3 years¹.
Redwell East is an area in Wellingborough, Northamptonshire with 1,702 households², where the most expensive property was sold for £2,400,000.00.
Properties for sale in Redwell East
Roads and Postcodes in Redwell East
Navigate through our locations to find the location of your next house in Redwell East, Wellingborough for sale or to rent.
| Streets | Postcodes |
|---|---|
| Ashby Close | NN8 5FH |
| Barnwell Gardens | NN8 5FJ |
| Blaydon Walk | NN8 5YU NN8 5YX |
| Blenheim Road | NN8 5YJ |
| Brampton Close | NN8 5XG |
| Broad Green | NN8 4LJ |
| Churchill Avenue | NN8 5YG |
| Crawley Avenue | NN8 5YH |
| Debdale Road | NN8 5AA NN8 5AJ |
| Denford Way | NN8 5UB |
| Devonshire Close | NN8 5QF |
| Dybdale Crescent | NN8 5EX |
| Elm Street | NN8 5AU |
| Grafton Close | NN8 5WA |
| Gretton Court | NN8 5UD |
| Hardwick Close | NN8 5AE |
| Hardwick Road | NN8 5AB NN8 5AD NN8 5AG |
| Harrowden Road | NN8 5BB NN8 5BD NN8 5BG NN8 5BJ NN8 5BL NN8 5BQ |
| Hatton Avenue | NN8 5AP |
| Hatton Park Road | NN8 5AH NN8 5AQ NN8 5AT NN8 5BA |
| Hatton Street | NN8 5AS NN8 5AW |
| Holcot Close | NN8 5FL |
| Hulme Way | NN8 5YW |
| Kilborn Close | NN8 5YA |
| Kilborn Road | NN8 5YT |
| Lowick Close | NN8 5UN |
| Marlborough Avenue | NN8 5YN |
| Naseby Close | NN8 5XB |
| Orton Place | NN8 5UF |
| Redwell Mews | NN8 5AX |
| Redwell Road | NN8 5AZ |
| Roche Way | NN8 5YD NN8 5YE |
| Somerford Road | NN8 5EY NN8 5EZ |
| Sparke Close | NN8 5YL |
| Sywell Avenue | NN8 5BZ |
| Sywell Way | NN8 5ER |
| Tewkesbury Close | NN8 5YP |
| The Promenade | NN8 5AL |
| Torrington Crescent | NN8 5BX NN8 5ET |
| Torrington Green | NN8 5BT |
| Torrington Road | NN8 5AF |
| Torrington Way | NN8 5BU |
| Tudor Way | NN8 5YB |
| Vicarage Close | NN8 5ES |
| Vicarage Farm Road | NN8 5BY NN8 5EU |
| Weir Close | NN8 5YF |
| Weldon Close | NN8 5UQ |
| Westminster Road | NN8 5YR NN8 5YS |
| White Delves | NN8 5XW |
| Woodstock Close | NN8 5YQ |
Transport near Redwell East
- FAQ
- Price Paid By Year
- Property Type Price
Frequently asked questions about Redwell East
What is the average price for a property for sale in Redwell East?
The average price for a property for sale in Redwell East is £330,650. This amount is 27% higher than the average price in Wellingborough. There are 1,806 property listings for sale in Redwell East.
What streets have the most expensive properties for sale in Redwell East?
The streets with the most expensive properties for sale in Redwell East are Redwell Mews at an average of £930,000, The Promenade at an average of £891,900 and Debdale Road at an average of £772,666.
What streets have the most affordable properties for sale in Redwell East?
The streets with the most affordable properties for sale in Redwell East are Harrowden Road at an average of £175,000, Blaydon Walk at an average of £220,750 and Sywell Avenue at an average of £226,000.
Which train stations are available in or near Redwell East?
Some of the train stations available in or near Redwell East are Wellingborough, Kettering and Northampton.
Property Price Paid in Redwell East by Year
The average sold property price by year was:
| Year | Average Sold Price | Price Change |
Sold Properties
|
|---|---|---|---|
| 2025 | £276,249 | -35% |
42 Properties |
| 2024 | £373,212 | 6% |
54 Properties |
| 2023 | £349,199 | 11% |
55 Properties |
| 2022 | £310,380 | 11% |
51 Properties |
| 2021 | £276,006 | -1% |
94 Properties |
| 2020 | £277,407 | -1% |
71 Properties |
| 2019 | £281,065 | 15% |
73 Properties |
| 2018 | £239,270 | -8% |
57 Properties |
| 2017 | £259,511 | 10% |
70 Properties |
| 2016 | £234,316 | 6% |
72 Properties |
| 2015 | £221,017 | 24% |
52 Properties |
| 2014 | £168,048 | 2% |
71 Properties |
| 2013 | £164,876 | 2% |
41 Properties |
| 2012 | £162,387 | -9% |
48 Properties |
| 2011 | £177,451 | 22% |
58 Properties |
| 2010 | £138,863 | -17% |
58 Properties |
| 2009 | £162,962 | -2% |
52 Properties |
| 2008 | £166,324 | 4% |
46 Properties |
| 2007 | £159,815 | 0,5% |
106 Properties |
| 2006 | £159,042 | 1% |
94 Properties |
| 2005 | £158,056 | 12% |
94 Properties |
| 2004 | £139,807 | -4% |
111 Properties |
| 2003 | £145,625 | 26% |
118 Properties |
| 2002 | £107,042 | 12% |
117 Properties |
| 2001 | £93,678 | 17% |
115 Properties |
| 2000 | £77,306 | 2% |
120 Properties |
| 1999 | £75,733 | 19% |
114 Properties |
| 1998 | £61,595 | -2% |
99 Properties |
| 1997 | £62,646 | 16% |
112 Properties |
| 1996 | £52,921 | -7% |
101 Properties |
| 1995 | £56,643 | - |
98 Properties |
Property Price per Property Type in Redwell East
Here you can find historic sold price data in order to help with your property search.
The average Property Paid Price for specific property types in the last three years are:
| Property Type | Average Sold Price | Sold Properties |
|---|---|---|
| Semi Detached House | £275,867.00 | 76 Semi Detached Houses |
| Detached House | £387,618.00 | 92 Detached Houses |
| Terraced House | £327,310.00 | 29 Terraced Houses |
| Flat | £134,500.00 | 5 Flats |

