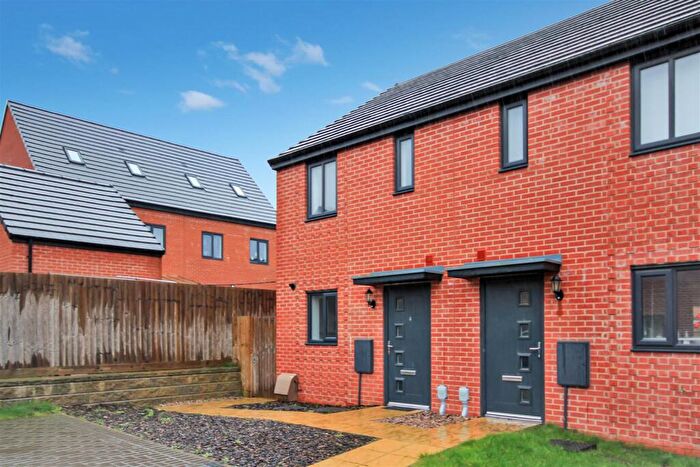
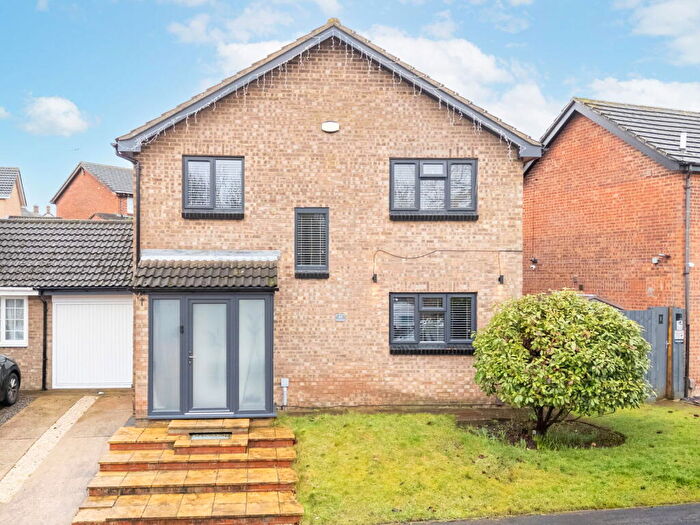
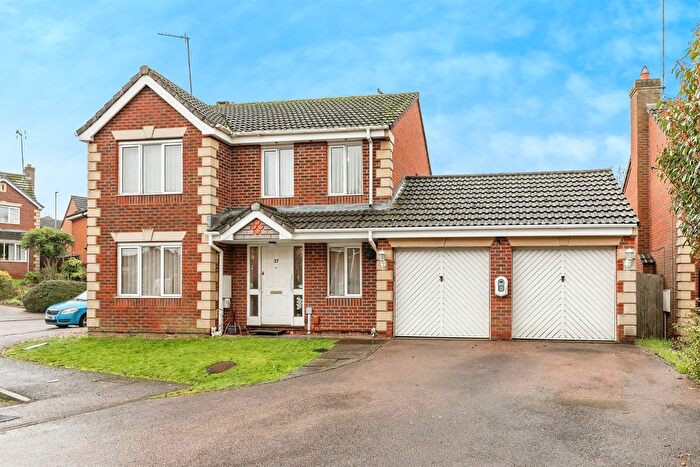
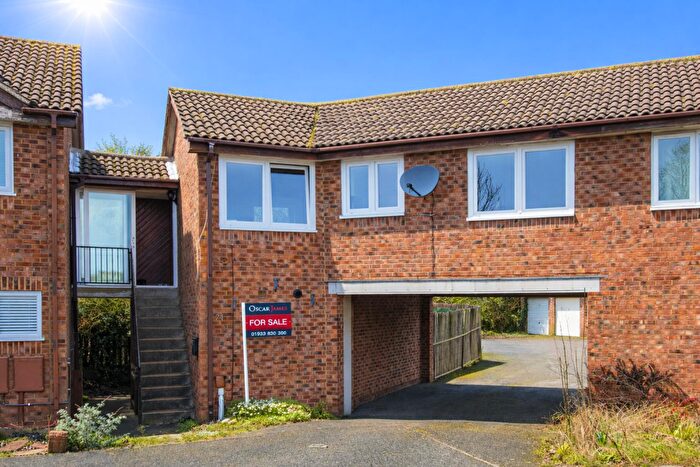
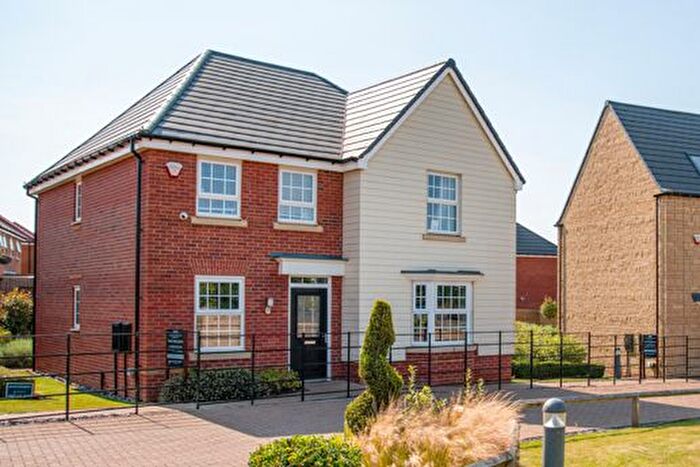
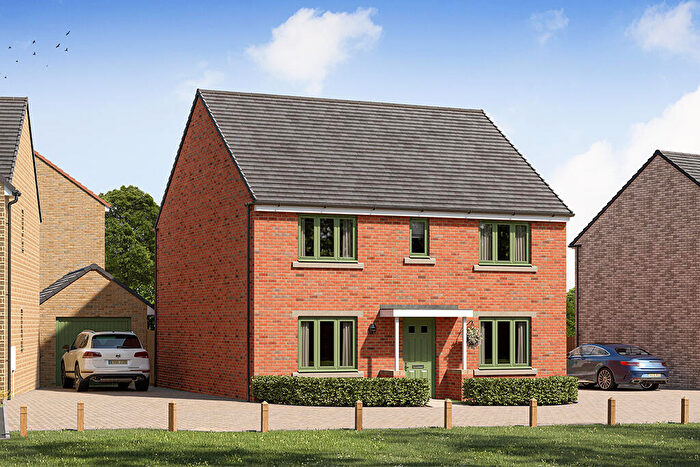
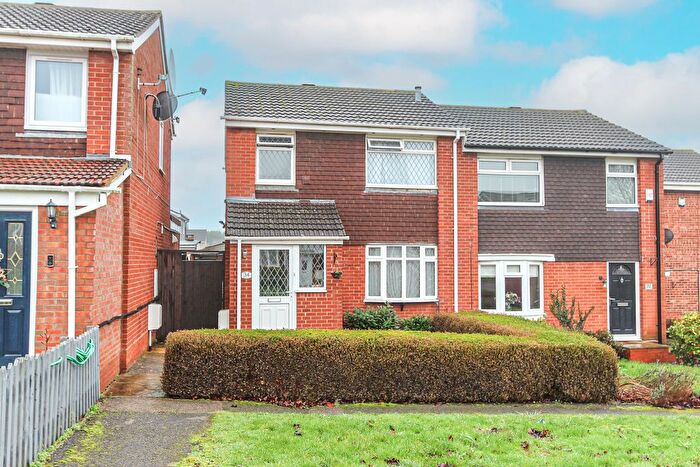
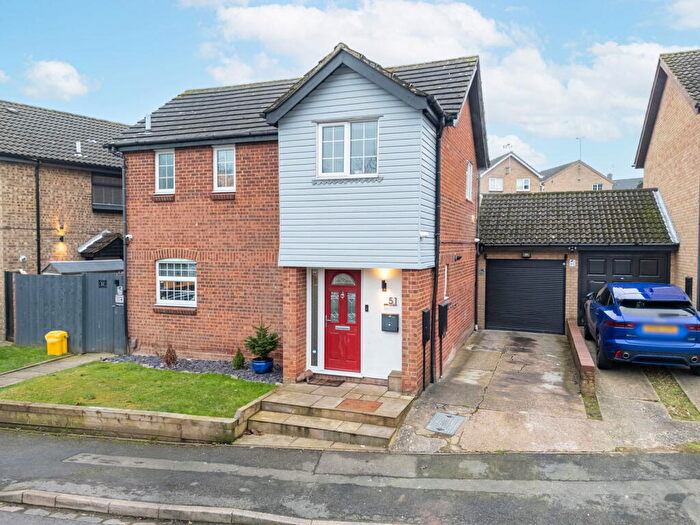
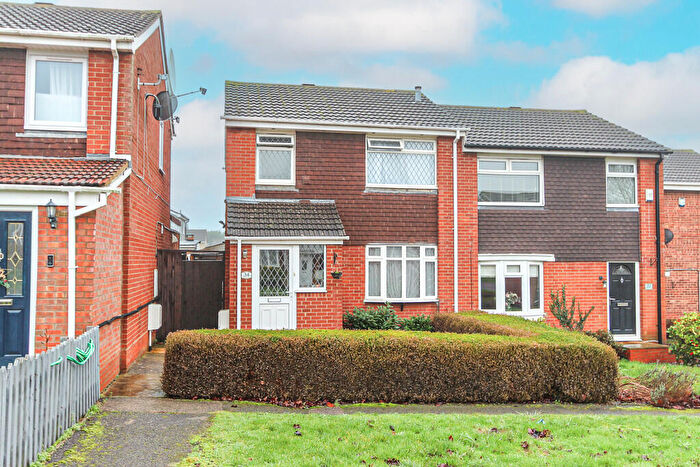
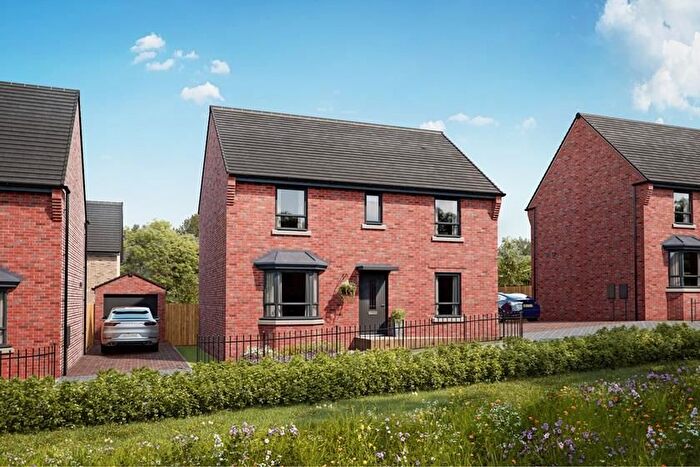
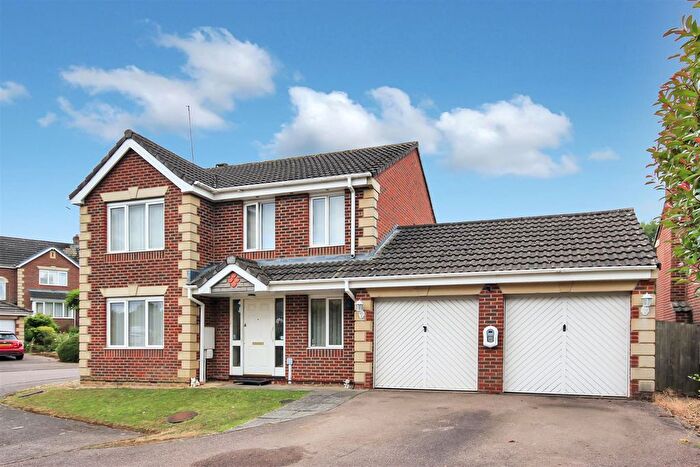
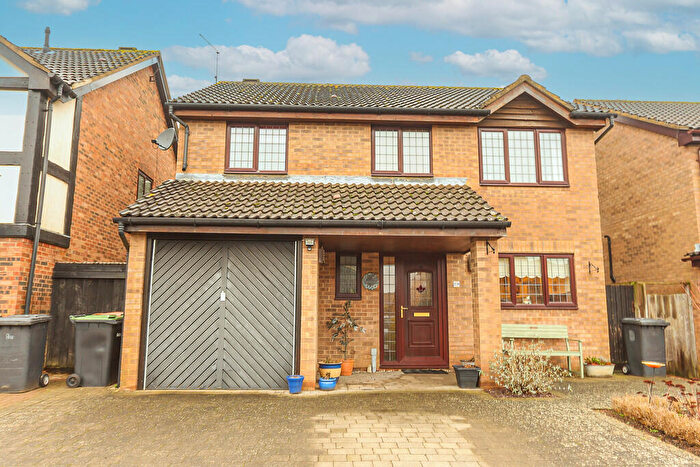
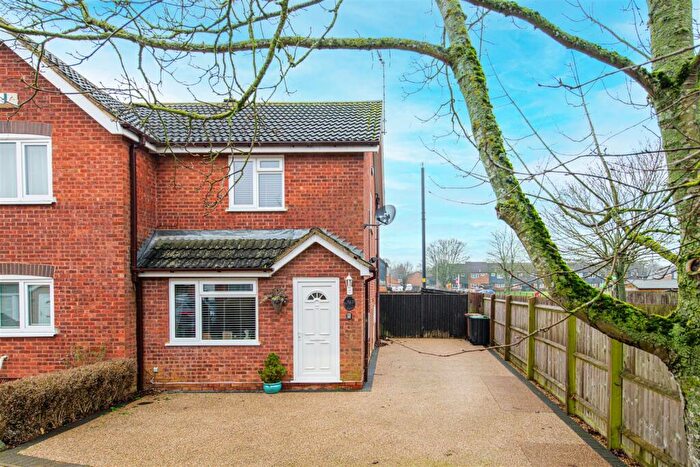
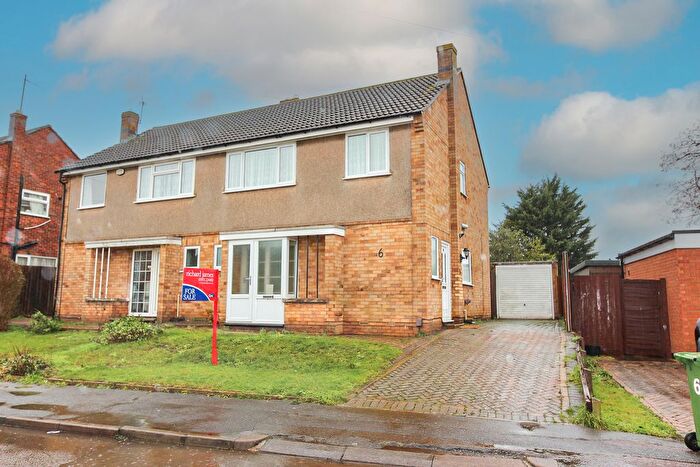
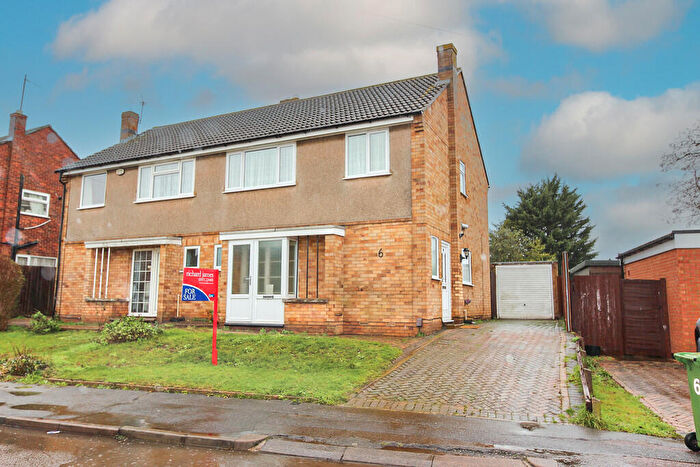
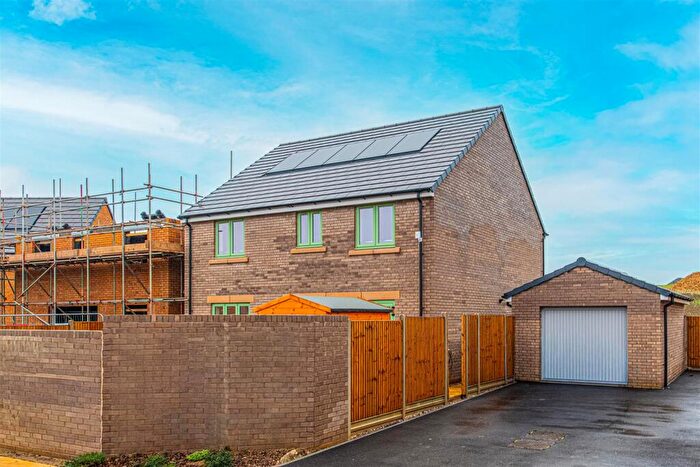
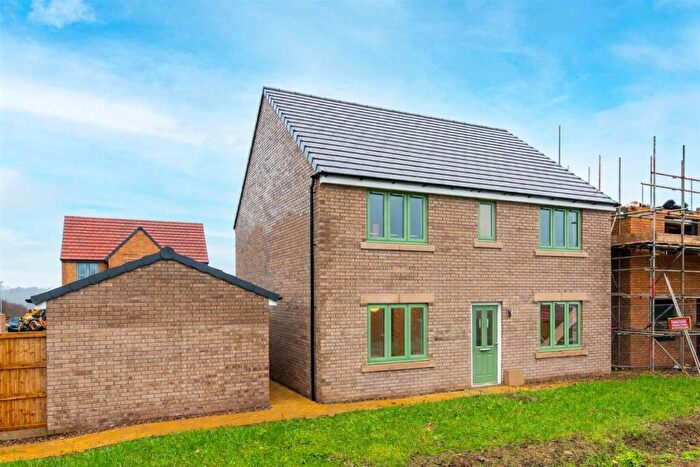
Houses for sale & to rent in Redwell West, Wellingborough
House Prices in Redwell West
Properties in Redwell West have an average house price of £295,044.00 and had 121 Property Transactions within the last 3 years¹.
Redwell West is an area in Wellingborough, Northamptonshire with 1,329 households², where the most expensive property was sold for £550,000.00.
Properties for sale in Redwell West
Roads and Postcodes in Redwell West
Navigate through our locations to find the location of your next house in Redwell West, Wellingborough for sale or to rent.
| Streets | Postcodes |
|---|---|
| Althorp Close | NN8 5FE |
| Ashton Grove | NN8 5ZA |
| Avon Close | NN8 5WH |
| Beck Court | NN8 5XZ |
| Bourne Close | NN8 5ZN |
| Braid Court | NN8 6PF |
| Chatsworth Drive | NN8 5FB NN8 5FD |
| Chepstow Drive | NN8 5UA |
| Conway Close | NN8 5XU |
| Cragside | NN8 5QY |
| Curtis Mews | NN8 5PG |
| Denby Dale | NN8 5QR |
| Dene Close | NN8 5QP |
| Fell Walk | NN8 5ZU |
| Fowey Close | NN8 5WW |
| Green Close | NN8 5PZ |
| Haddon Close | NN8 5ZB |
| Hatfield Close | NN8 3FF NN8 3FG |
| Heath Rise | NN8 5QN |
| Henley Close | NN8 5WR |
| Hoylake | NN8 5NZ |
| Humber Gardens | NN8 5WE |
| Jacklin Court | NN8 5XP |
| Kennet Close | NN8 5ZP |
| Littledale | NN8 5QW |
| Lyle Court | NN8 5WJ |
| Lytham Court | NN8 5PB |
| Malham Court | NN8 5QH |
| Medway Drive | NN8 5WZ NN8 5XT |
| Moorlands | NN8 5QS |
| Muirfield Road | NN8 5NY |
| Nene Close | NN8 5WB |
| Orwell Close | NN8 5WX |
| Ouse Close | NN8 5ZF |
| Palmer Close | NN8 5NX |
| Ribble Close | NN8 5XJ |
| Ryder View | NN8 5XL |
| Severn Close | NN8 5WF |
| Spey Close | NN8 5ZE |
| Swale Drive | NN8 5ZL |
| Taylor Close | NN8 5QU |
| Tees Close | NN8 5WY |
| Thames Road | NN8 5WU |
| The Cottons | NN8 5PD |
| The Crescent | NN8 5NW |
| Trent Close | NN8 5XN |
| Trinity Centre | NN8 6ZB |
| Troon Crescent | NN8 5WG |
| Turnberry Court | NN8 5UE |
| Tyne Close | NN8 5WT |
| Vardon Close | NN8 5PH |
| Walker Square | NN8 5PQ |
| Watson Close | NN8 5UH |
| Wentworth Avenue | NN8 5PE NN8 5WD |
| Whernside | NN8 5QQ |
| Wye Close | NN8 5WS |
Transport near Redwell West
- FAQ
- Price Paid By Year
- Property Type Price
Frequently asked questions about Redwell West
What is the average price for a property for sale in Redwell West?
The average price for a property for sale in Redwell West is £295,044. This amount is 13% higher than the average price in Wellingborough. There are 1,407 property listings for sale in Redwell West.
What streets have the most expensive properties for sale in Redwell West?
The streets with the most expensive properties for sale in Redwell West are Wye Close at an average of £446,666, Ashton Grove at an average of £443,666 and Ryder View at an average of £428,000.
What streets have the most affordable properties for sale in Redwell West?
The streets with the most affordable properties for sale in Redwell West are Kennet Close at an average of £171,250, The Crescent at an average of £190,500 and Ouse Close at an average of £200,000.
Which train stations are available in or near Redwell West?
Some of the train stations available in or near Redwell West are Wellingborough, Kettering and Northampton.
Property Price Paid in Redwell West by Year
The average sold property price by year was:
| Year | Average Sold Price | Price Change |
Sold Properties
|
|---|---|---|---|
| 2025 | £311,586 | 8% |
43 Properties |
| 2024 | £285,362 | -0,4% |
40 Properties |
| 2023 | £286,517 | -5% |
38 Properties |
| 2022 | £302,119 | 9% |
42 Properties |
| 2021 | £273,752 | 8% |
77 Properties |
| 2020 | £252,661 | -6% |
31 Properties |
| 2019 | £267,351 | 13% |
54 Properties |
| 2018 | £232,530 | -0,1% |
49 Properties |
| 2017 | £232,665 | 10% |
55 Properties |
| 2016 | £209,527 | 17% |
64 Properties |
| 2015 | £174,221 | 2% |
59 Properties |
| 2014 | £170,929 | 5% |
57 Properties |
| 2013 | £162,454 | 1% |
56 Properties |
| 2012 | £160,901 | 1% |
31 Properties |
| 2011 | £159,484 | -4% |
35 Properties |
| 2010 | £165,485 | 10% |
52 Properties |
| 2009 | £149,161 | -10% |
37 Properties |
| 2008 | £163,550 | -6% |
44 Properties |
| 2007 | £173,590 | 8% |
91 Properties |
| 2006 | £160,068 | -0,4% |
119 Properties |
| 2005 | £160,778 | 9% |
59 Properties |
| 2004 | £146,927 | 4% |
117 Properties |
| 2003 | £140,845 | 24% |
69 Properties |
| 2002 | £107,501 | 17% |
113 Properties |
| 2001 | £89,198 | 6% |
121 Properties |
| 2000 | £83,521 | 15% |
113 Properties |
| 1999 | £70,623 | 10% |
125 Properties |
| 1998 | £63,868 | 4% |
108 Properties |
| 1997 | £61,481 | 0,2% |
115 Properties |
| 1996 | £61,369 | 6% |
116 Properties |
| 1995 | £57,773 | - |
99 Properties |
Property Price per Property Type in Redwell West
Here you can find historic sold price data in order to help with your property search.
The average Property Paid Price for specific property types in the last three years are:
| Property Type | Average Sold Price | Sold Properties |
|---|---|---|
| Semi Detached House | £248,725.00 | 33 Semi Detached Houses |
| Detached House | £325,593.00 | 79 Detached Houses |
| Terraced House | £196,722.00 | 9 Terraced Houses |

