
Houses for sale & to rent in Wollaston, Wellingborough
House Prices in Wollaston
Properties in Wollaston have an average house price of £330k and had 139 Property Transactions within the last 3 years¹.
Wollaston is an area in Wellingborough, Northamptonshire with 1,487 households², where the most expensive property was sold for £935k.
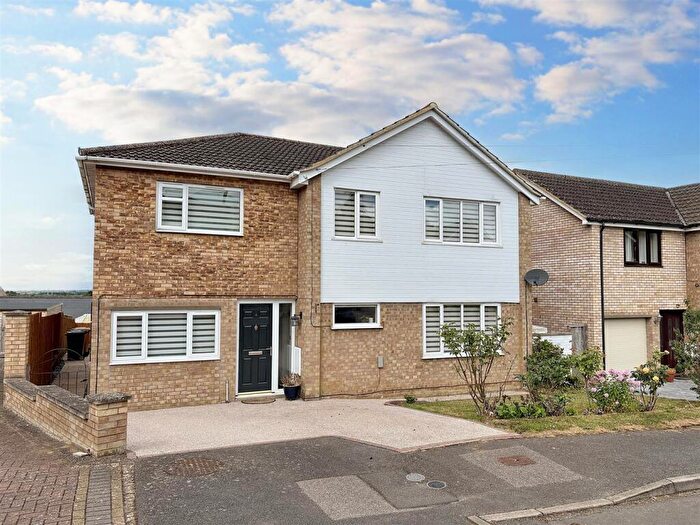
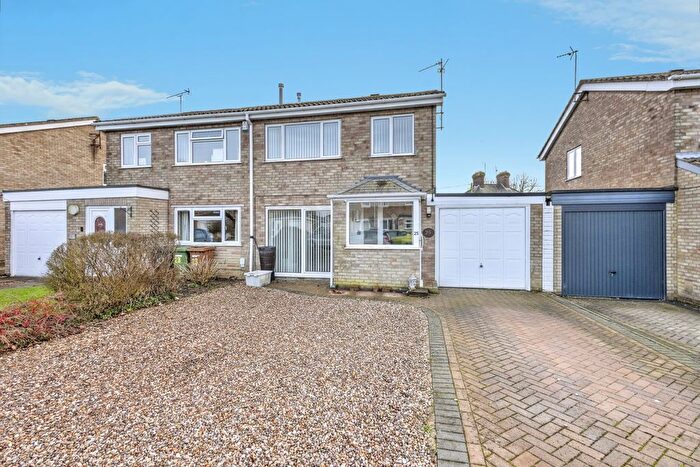
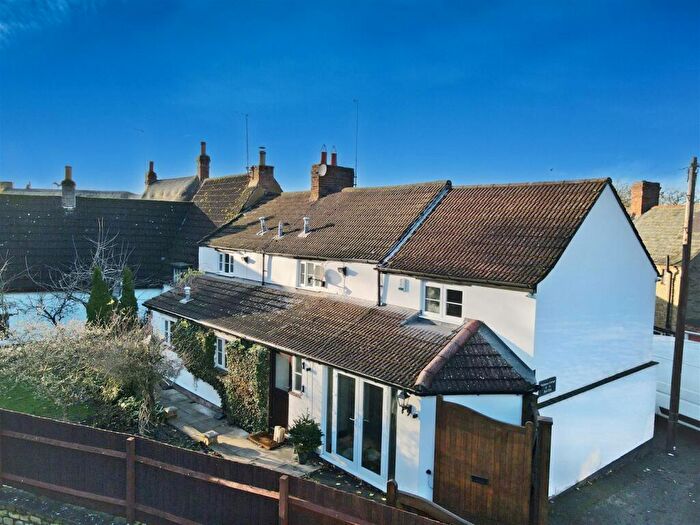
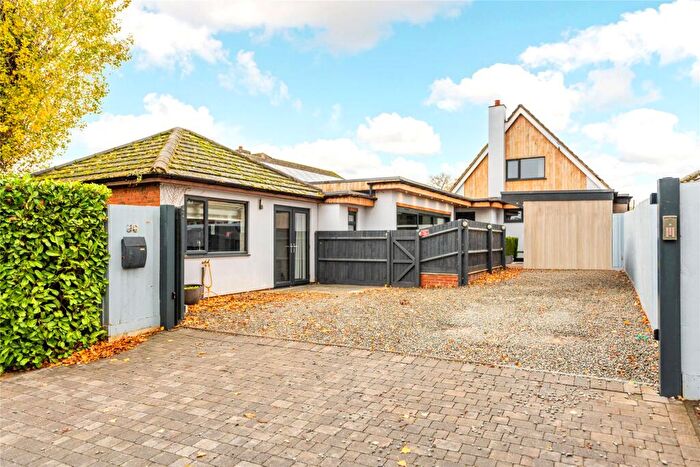
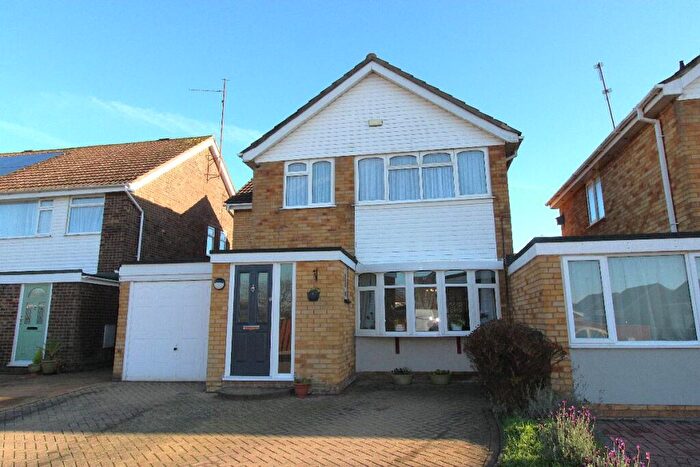
Properties for sale in Wollaston

![]()
If you are looking to sell your house, let it out, or receive a property valuation, an expert can help you.
Click the button below to get started.
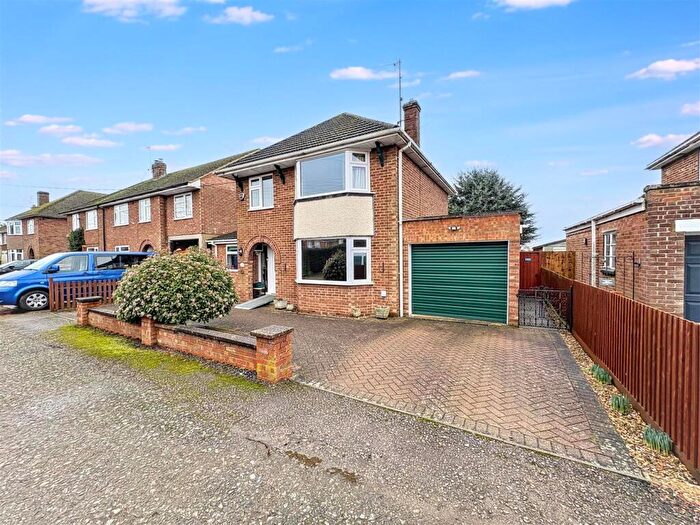
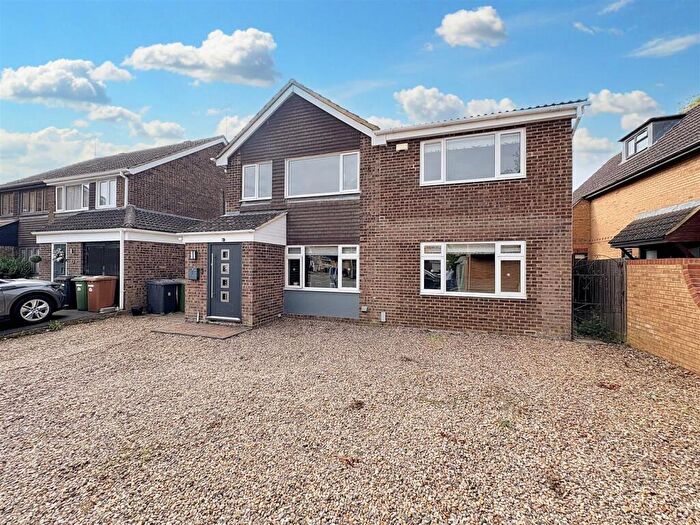
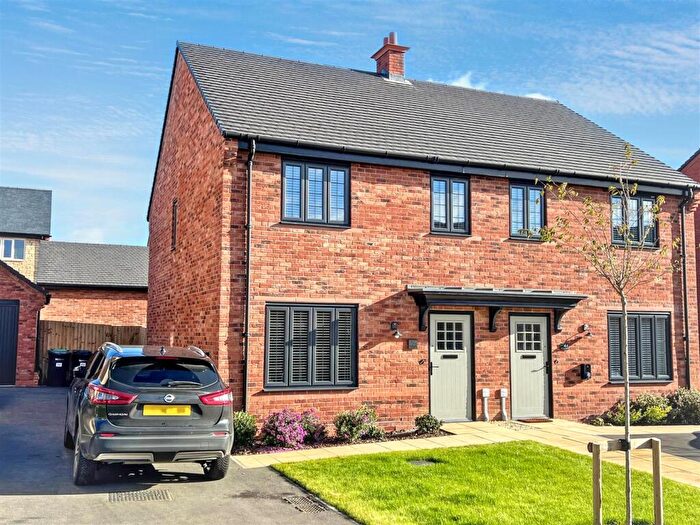
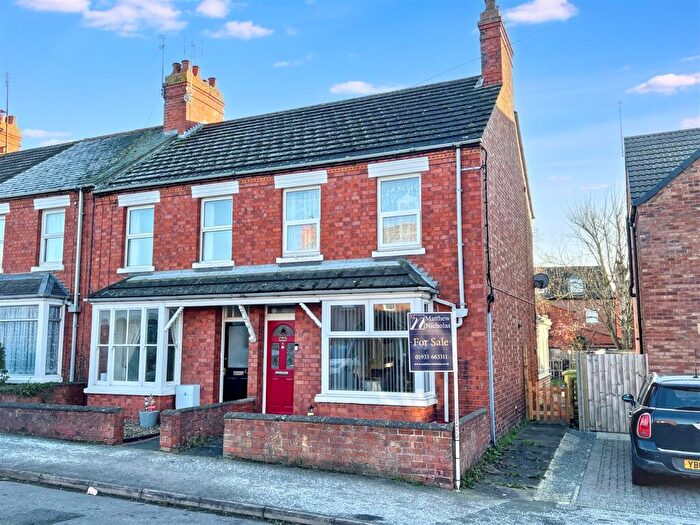
Previously listed properties in Wollaston
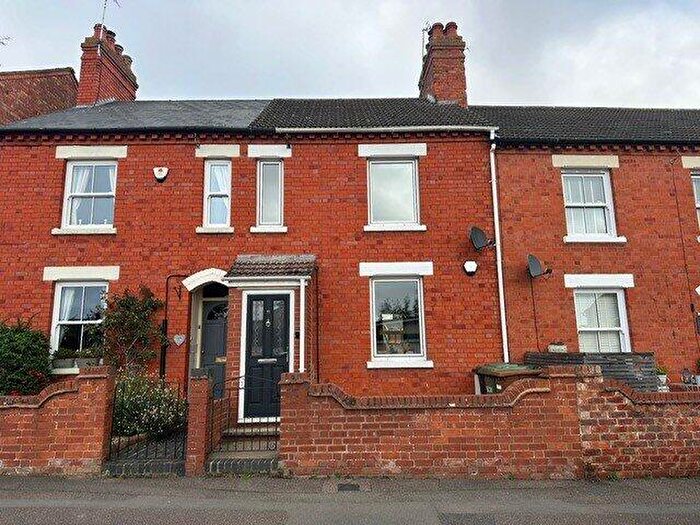

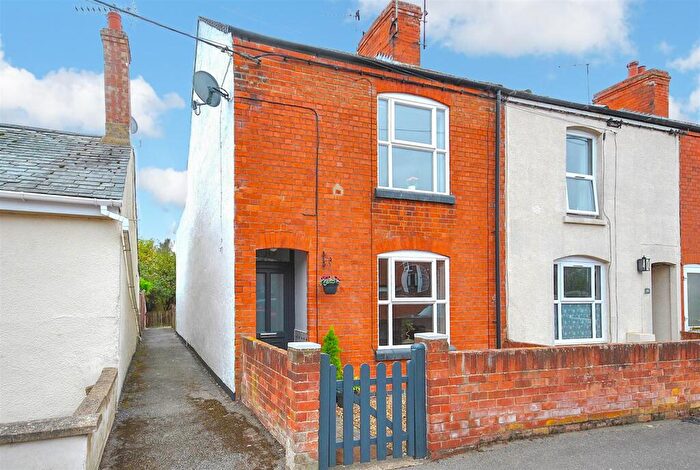
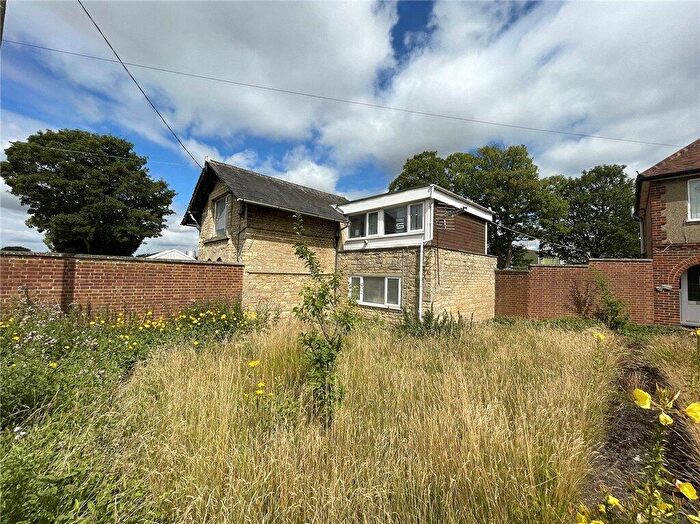

![]()
If you are looking to sell your house, let it out, or receive a property valuation, an expert can help you.
Click the button below to get started.


Roads and Postcodes in Wollaston
Navigate through our locations to find the location of your next house in Wollaston, Wellingborough for sale or to rent.
| Streets | Postcodes |
|---|---|
| Abbey Rise | NN29 7QA |
| Backway | NN29 7RT |
| Bell End | NN29 7RN |
| Briarwood Way | NN29 7QR |
| Church Lane | NN29 7SJ |
| Church View | NN29 7SY |
| Cobbs Lane | NN29 7PL NN29 7SW |
| College Street | NN29 7SF |
| Council Street | NN29 7RE |
| Dando Close | NN29 7QB |
| Doddington Road | NN29 7PR |
| Duck End | NN29 7SH |
| Eastfield Road | NN29 7RS NN29 7RU |
| Feast Field Close | NN29 7QG |
| Fellows Close | NN29 7SS |
| Francis Dickins Close | NN29 7RH |
| Green Street | NN29 7RA |
| Grendon Road | NN29 7PT NN29 7PU |
| Hazelden Close | NN29 7LH |
| Hickmire | NN29 7SL |
| High Street | NN29 7QE NN29 7QQ NN29 7RJ NN29 7FH |
| Hinwick Road | NN29 7QT NN29 7QU NN29 7QX NN29 7QY NN29 7UX |
| Holyoake Road | NN29 7RZ |
| Hookhams Path | NN29 7PQ |
| Howard Court | NN29 7AE |
| Howard Road | NN29 7QZ |
| Irchester Road | NN29 7RP NN29 7RW NN29 7PH NN29 7PJ |
| Lancaster Close | NN29 7PD |
| Little Lane | NN29 7SQ |
| London Road | NN29 7FB NN29 7QP NN29 7QS NN29 7QW |
| Manchester Road | NN29 7SR |
| Monks Road | NN29 7PP |
| Neale Close | NN29 7UT |
| Newton Road | NN29 7QN |
| Orchard Close | NN29 7PN |
| Park Street | NN29 7RR |
| Pearson Mews | NN29 7UH |
| Poplar Place | NN29 7SD |
| Priory Road | NN29 7PW NN29 7SN |
| Prospect Close | NN29 7SP |
| Queens Road | NN29 7SA NN29 7SB |
| Raymond Close | NN29 7RG |
| Red Hill Crescent | NN29 7SX |
| Roses Close | NN29 7ST |
| Rotten Row | NN29 7QL |
| Shelton Court | NN29 7UA |
| Shepherds Hill | NN29 7PG |
| South Street | NN29 7RX NN29 7RY |
| St Albans Place | NN29 7SZ |
| St Marys Road | NN29 7RB |
| St Michaels Lane | NN29 7QH |
| Stone Close | NN29 7RD |
| The Gap | NN29 7GA |
| The Grove | NN29 7RF |
| The Heathers | NN29 7UB |
| The Maltings | NN29 7PZ |
| The Pyghtles | NN29 7QD |
| Thrift Street | NN29 7AD NN29 7QJ |
| Unity Close | NN29 7SU |
| Wellingborough Road | NN29 7PX NN29 7PY |
| Williams Way | NN29 7RQ |
| Windmill Close | NN29 7SE |
| York Road | NN29 7SG |
| NN29 7PA NN29 7FG NN29 7PB NN29 7TS |
Transport near Wollaston
-
 Wellingborough Station
 -
Kettering Station
-
Northampton Station
-
Bedford Midland Station
-
Bedford St.Johns Station
-
Kempston Hardwick Station
-
Wolverton Station
-
Stewartby Station
- FAQ
- Price Paid By Year
- Property Type Price
Frequently asked questions about Wollaston
What is the average price for a property for sale in Wollaston?
The average price for a property for sale in Wollaston is £330,199. This amount is 26% higher than the average price in Wellingborough. There are 262 property listings for sale in Wollaston.
What streets have the most expensive properties for sale in Wollaston?
The streets with the most expensive properties for sale in Wollaston are Doddington Road at an average of £715,000, Little Lane at an average of £669,750 and York Road at an average of £660,998.
What streets have the most affordable properties for sale in Wollaston?
The streets with the most affordable properties for sale in Wollaston are Thrift Street at an average of £140,200, St Michaels Lane at an average of £185,250 and Howard Court at an average of £196,000.
Which train stations are available in or near Wollaston?
Some of the train stations available in or near Wollaston are Wellingborough, Kettering and Northampton.
Property Price Paid in Wollaston by Year
The average sold property price by year was:
| Year | Average Sold Price | Price Change |
Sold Properties
|
|---|---|---|---|
| 2025 | £334,912 | 5% |
43 Properties |
| 2024 | £319,686 | -6% |
51 Properties |
| 2023 | £337,610 | -14% |
45 Properties |
| 2022 | £384,045 | 21% |
55 Properties |
| 2021 | £303,870 | 12% |
70 Properties |
| 2020 | £267,636 | 1% |
51 Properties |
| 2019 | £264,441 | -7% |
43 Properties |
| 2018 | £281,728 | 9% |
58 Properties |
| 2017 | £256,799 | 14% |
60 Properties |
| 2016 | £222,078 | 1% |
61 Properties |
| 2015 | £219,672 | 18% |
70 Properties |
| 2014 | £180,761 | -18% |
65 Properties |
| 2013 | £212,484 | -15% |
60 Properties |
| 2012 | £243,360 | 15% |
43 Properties |
| 2011 | £205,827 | 4% |
35 Properties |
| 2010 | £197,692 | 7% |
53 Properties |
| 2009 | £184,715 | 9% |
45 Properties |
| 2008 | £168,035 | -19% |
53 Properties |
| 2007 | £200,723 | 2% |
103 Properties |
| 2006 | £196,342 | 8% |
101 Properties |
| 2005 | £180,153 | 7% |
114 Properties |
| 2004 | £168,310 | 11% |
95 Properties |
| 2003 | £149,304 | 12% |
131 Properties |
| 2002 | £130,983 | 24% |
128 Properties |
| 2001 | £99,442 | 10% |
91 Properties |
| 2000 | £89,330 | 8% |
68 Properties |
| 1999 | £82,054 | 22% |
74 Properties |
| 1998 | £63,969 | 11% |
77 Properties |
| 1997 | £56,639 | -16% |
104 Properties |
| 1996 | £65,942 | 11% |
68 Properties |
| 1995 | £58,611 | - |
46 Properties |
Property Price per Property Type in Wollaston
Here you can find historic sold price data in order to help with your property search.
The average Property Paid Price for specific property types in the last three years are:
| Property Type | Average Sold Price | Sold Properties |
|---|---|---|
| Semi Detached House | £299,731.00 | 40 Semi Detached Houses |
| Detached House | £424,094.00 | 58 Detached Houses |
| Terraced House | £237,432.00 | 37 Terraced Houses |
| Flat | £131,500.00 | 4 Flats |