
Houses for sale & to rent in South, Wellingborough
House Prices in South
Properties in South have an average house price of £308k and had 119 Property Transactions within the last 3 years¹.
South is an area in Wellingborough, Northamptonshire with 886 households², where the most expensive property was sold for £675k.
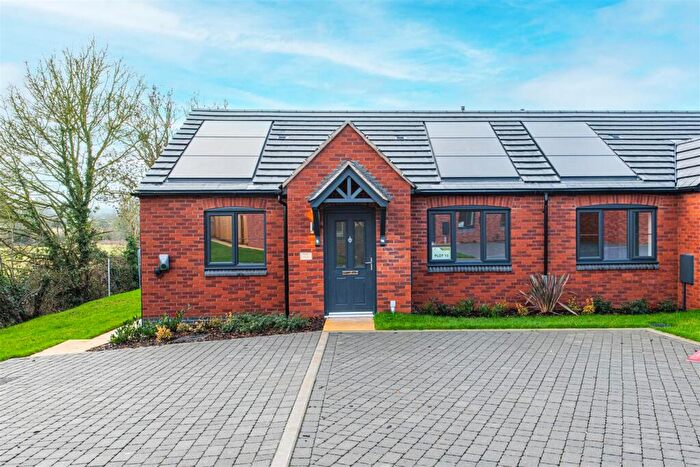
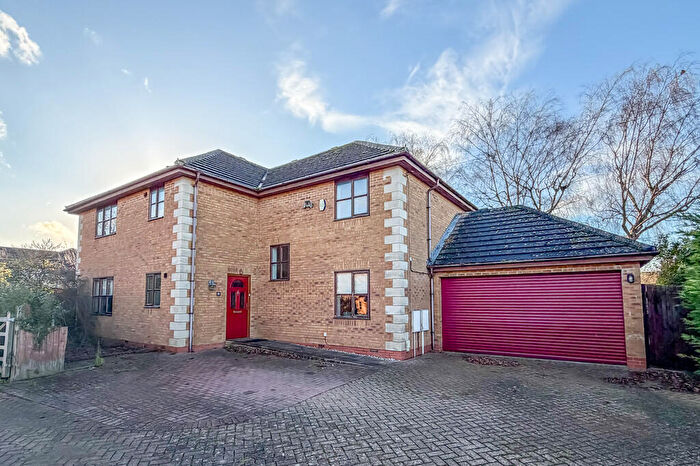
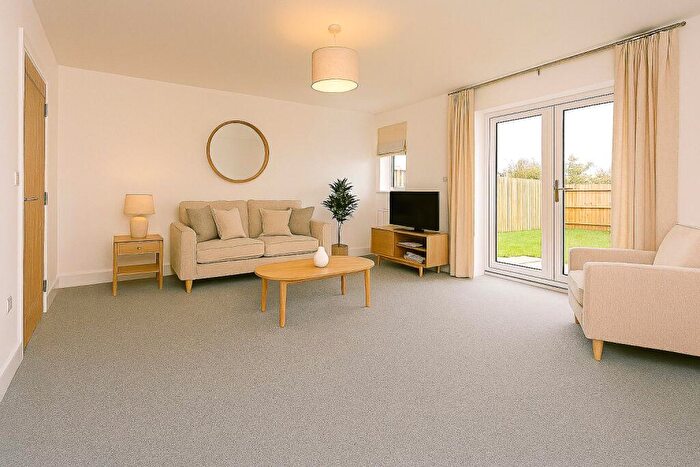
Properties for sale in South
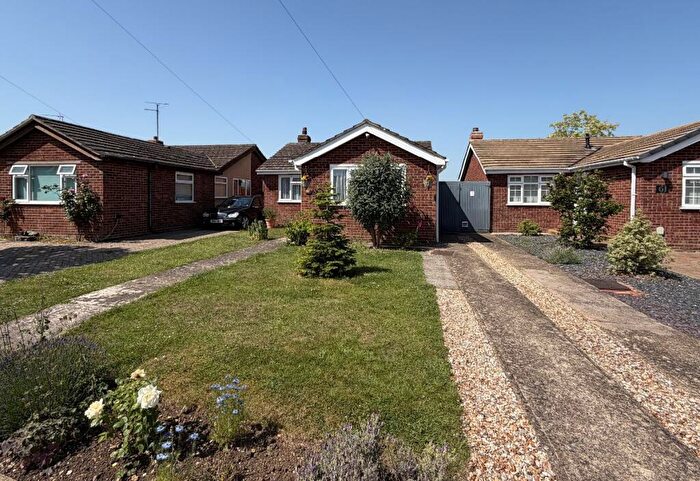
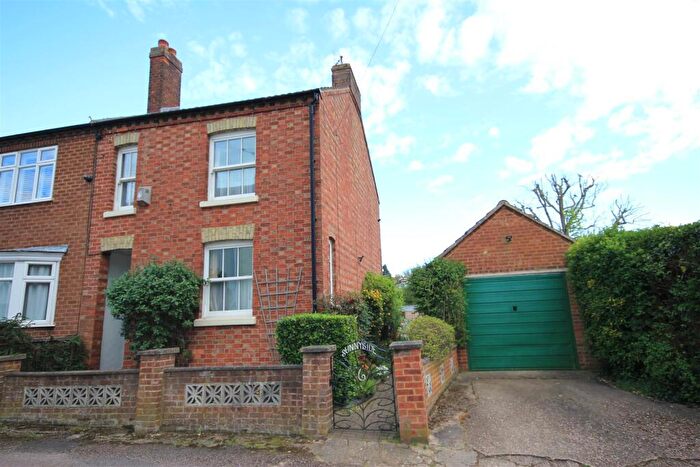
![]()
If you are looking to sell your house, let it out, or receive a property valuation, an expert can help you.
Click the button below to get started.
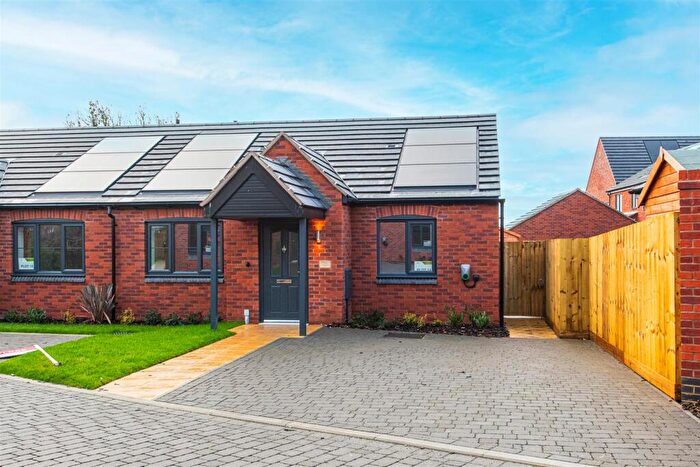

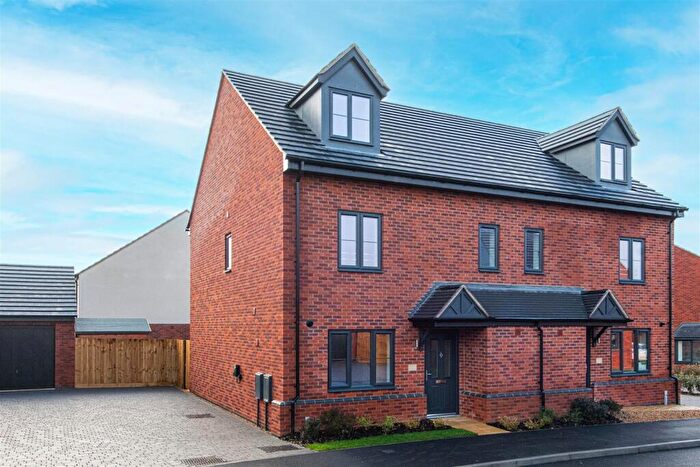
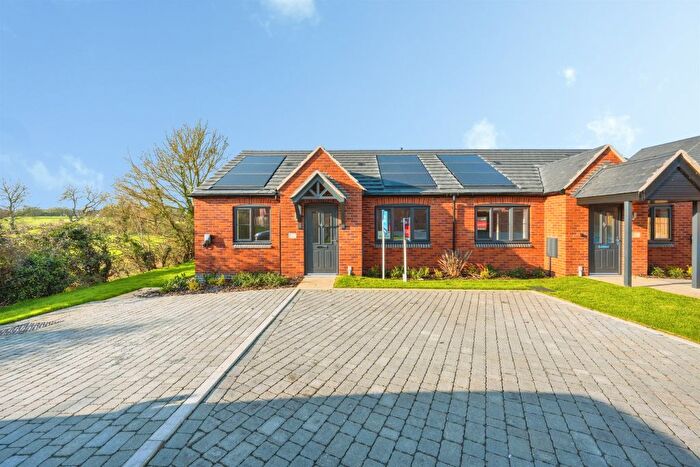
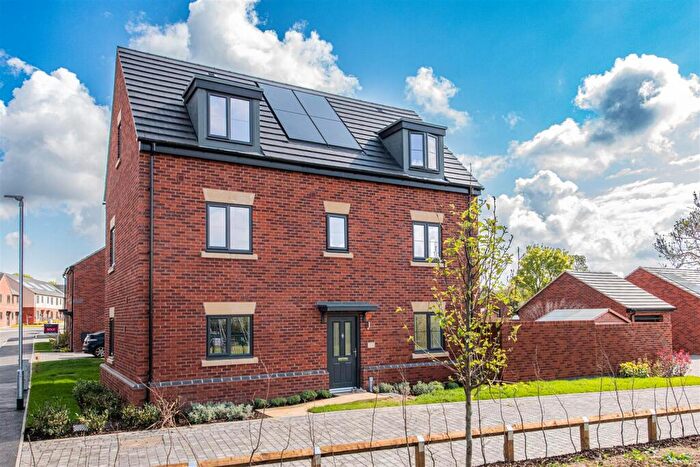
Previously listed properties in South

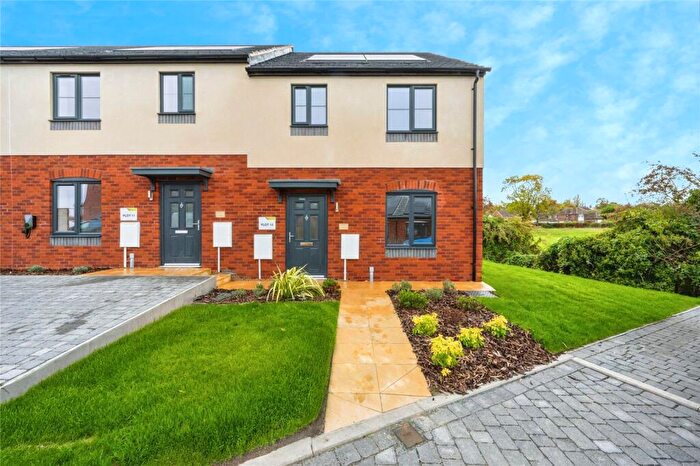
![]()
If you are looking to sell your house, let it out, or receive a property valuation, an expert can help you.
Click the button below to get started.

Roads and Postcodes in South
Navigate through our locations to find the location of your next house in South, Wellingborough for sale or to rent.
| Streets | Postcodes |
|---|---|
| Abbey Close | NN29 7NU |
| Allens Hill | NN29 7LW |
| Bosgate Close | NN29 7JS |
| Brookside | NN29 7NJ |
| Bull Close | NN29 7LR |
| Burleigh Terrace | NN29 7NG |
| Burton Terrace | NN29 7LL |
| Camden Square | NN29 7JH |
| Church Farm Close | NN29 7NX |
| Church Lane | NN29 7LJ |
| Church Walk | NN29 7ND |
| Clayland Close | NN29 7NT |
| Cobblers Place | NN29 7HH |
| Council Street | NN29 7LS |
| Dag Lane | NN29 7JJ |
| Dychurch Lane | NN29 7JP |
| Easton Lane | NN29 7NN |
| Fir Tree Grove | NN29 7NQ |
| Fullwell Road | NN29 7LX NN29 7LY |
| Harrold Road | NN29 7LP |
| Hensmans Lane | NN29 7NY |
| Hewletts Close | NN29 7JX |
| High Street | NN29 7LE NN29 7NF |
| Hillside Close | NN29 7LG |
| Hope Street | NN29 7FE NN29 7LU |
| Knights Close | NN29 7LQ |
| Little Close | NN29 7HW |
| London Road | NN29 7JR NN29 7LZ NN29 7NP LU1 3GH |
| Mallows Yard | NN29 7NE |
| Manor Close | NN29 7JG |
| Mile Street | NN29 7NB |
| Mill Road | NN29 7JA NN29 7JY |
| Peartree Close | NN29 7NA |
| Puddingbag Lane | NN29 7LN |
| Queen Street | NN29 7LA |
| Roberts Street | NN29 7JZ |
| Selby Gardens | NN29 7XB |
| Spencer Gardens | NN29 7JL |
| St Marys Road | NN29 7JU |
| Stoney Piece Close | NN29 7NS |
| The Orchard | NN29 7NW |
| Warners Hill | NN29 7NZ |
| Wheelwrights Yard | NN29 7JW |
| Wollaston Road | NN29 7LT |
| Wyman Close | NN29 7LF |
| NN29 7NR |
Transport near South
-
 Wellingborough Station
 -
Northampton Station
-
Bedford Midland Station
-
Bedford St.Johns Station
-
Kempston Hardwick Station
-
Wolverton Station
-
Kettering Station
-
Stewartby Station
-
Millbrook (Bedfordshire) Station
-
Lidlington Station
- FAQ
- Price Paid By Year
- Property Type Price
Frequently asked questions about South
What is the average price for a property for sale in South?
The average price for a property for sale in South is £307,565. This amount is 18% higher than the average price in Wellingborough. There are 169 property listings for sale in South.
What streets have the most expensive properties for sale in South?
The streets with the most expensive properties for sale in South are Manor Close at an average of £433,500, Mile Street at an average of £422,500 and Easton Lane at an average of £341,000.
What streets have the most affordable properties for sale in South?
The streets with the most affordable properties for sale in South are Camden Square at an average of £203,250, Dychurch Lane at an average of £235,000 and Fir Tree Grove at an average of £255,000.
Which train stations are available in or near South?
Some of the train stations available in or near South are Wellingborough, Northampton and Bedford Midland.
Property Price Paid in South by Year
The average sold property price by year was:
| Year | Average Sold Price | Price Change |
Sold Properties
|
|---|---|---|---|
| 2026 | £430,000 | 35% |
6 Properties |
| 2025 | £280,236 | -7% |
38 Properties |
| 2024 | £299,220 | -7% |
33 Properties |
| 2023 | £321,357 | 4% |
42 Properties |
| 2022 | £307,571 | -0,1% |
28 Properties |
| 2021 | £307,887 | -9% |
40 Properties |
| 2020 | £335,308 | 21% |
27 Properties |
| 2019 | £266,539 | -1% |
45 Properties |
| 2018 | £269,857 | 10% |
41 Properties |
| 2017 | £244,019 | -5% |
49 Properties |
| 2016 | £256,059 | -5% |
45 Properties |
| 2015 | £268,497 | 15% |
46 Properties |
| 2014 | £227,078 | 4% |
50 Properties |
| 2013 | £218,238 | 16% |
26 Properties |
| 2012 | £182,902 | 4% |
58 Properties |
| 2011 | £174,726 | -19% |
34 Properties |
| 2010 | £208,645 | 11% |
31 Properties |
| 2009 | £185,741 | -14% |
28 Properties |
| 2008 | £211,982 | -3% |
29 Properties |
| 2007 | £217,756 | 11% |
56 Properties |
| 2006 | £194,756 | 3% |
63 Properties |
| 2005 | £187,958 | 10% |
49 Properties |
| 2004 | £169,142 | 5% |
50 Properties |
| 2003 | £161,020 | 9% |
45 Properties |
| 2002 | £146,938 | 3% |
52 Properties |
| 2001 | £142,082 | 24% |
58 Properties |
| 2000 | £108,396 | 8% |
41 Properties |
| 1999 | £99,376 | 23% |
84 Properties |
| 1998 | £76,330 | 15% |
34 Properties |
| 1997 | £64,983 | 2% |
44 Properties |
| 1996 | £63,986 | 1% |
38 Properties |
| 1995 | £63,254 | - |
24 Properties |
Property Price per Property Type in South
Here you can find historic sold price data in order to help with your property search.
The average Property Paid Price for specific property types in the last three years are:
| Property Type | Average Sold Price | Sold Properties |
|---|---|---|
| Semi Detached House | £287,880.00 | 46 Semi Detached Houses |
| Detached House | £387,799.00 | 41 Detached Houses |
| Terraced House | £251,820.00 | 25 Terraced Houses |
| Flat | £166,069.00 | 7 Flats |