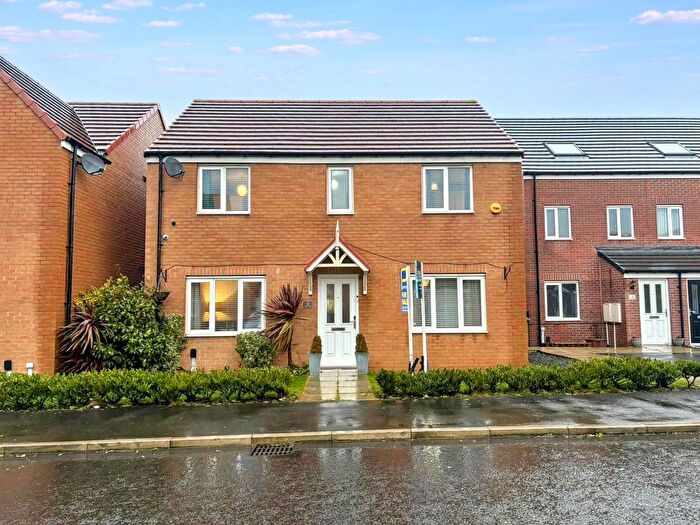
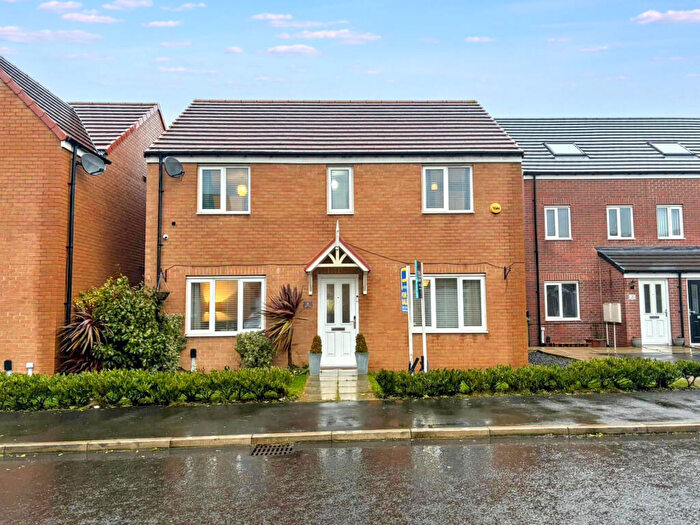
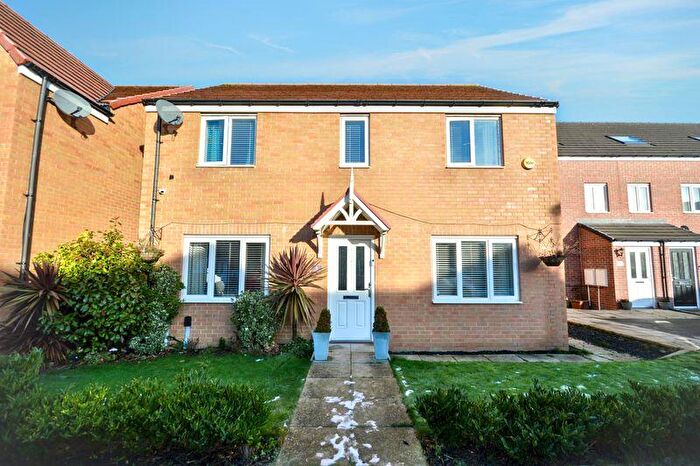
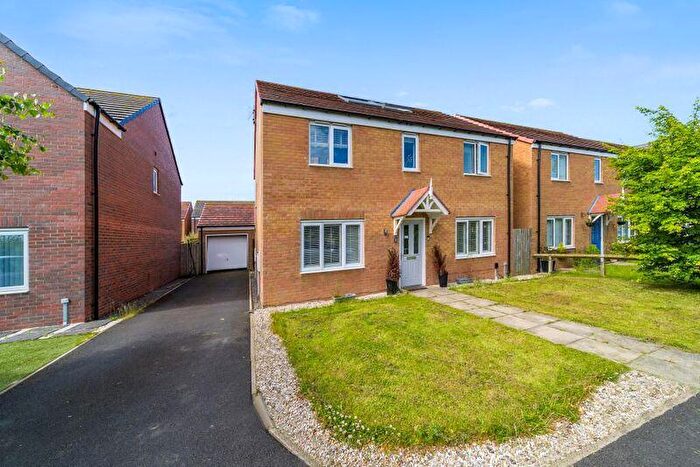
Houses for sale & to rent in Amble, Morpeth
House Prices in Amble
Properties in Amble have an average house price of £199,635.00 and had 238 Property Transactions within the last 3 years¹.
Amble is an area in Morpeth, Northumberland with 2,237 households², where the most expensive property was sold for £1,200,000.00.
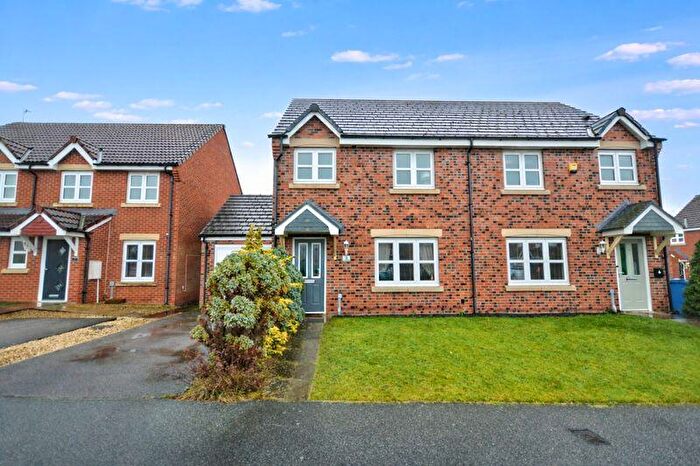
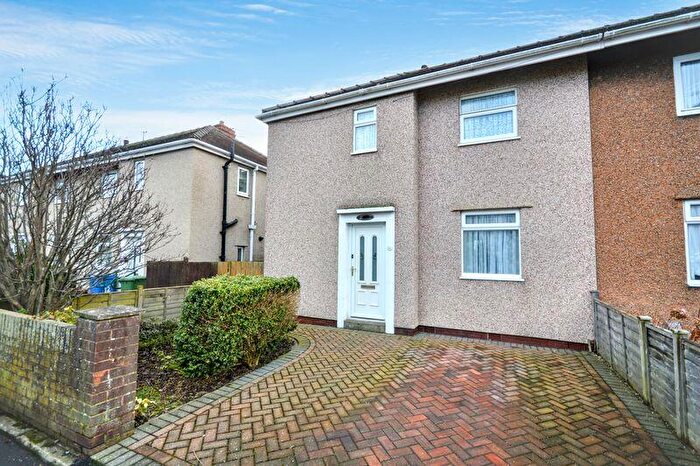
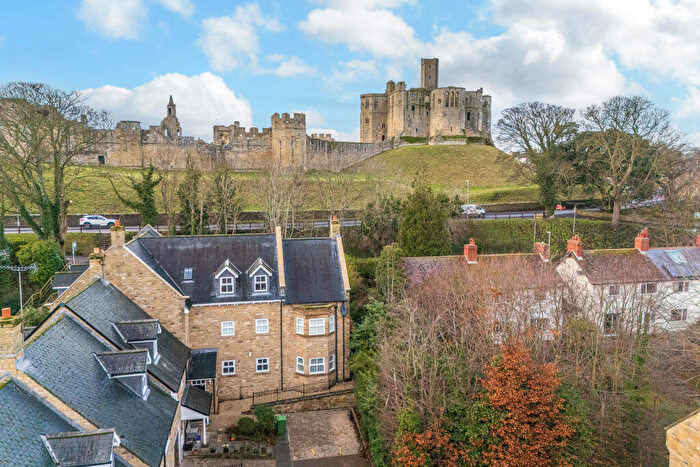
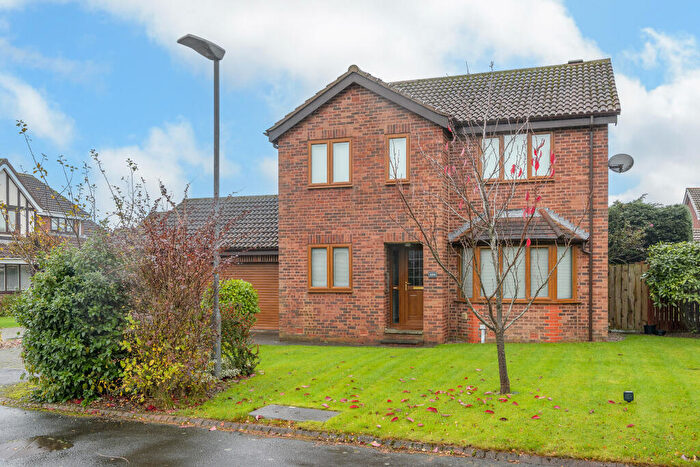
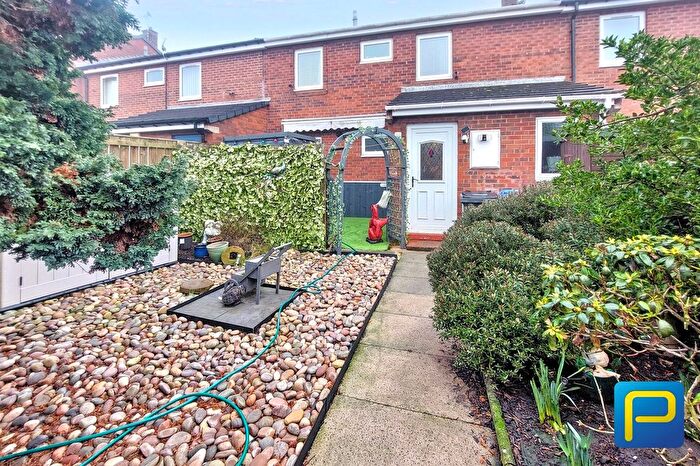
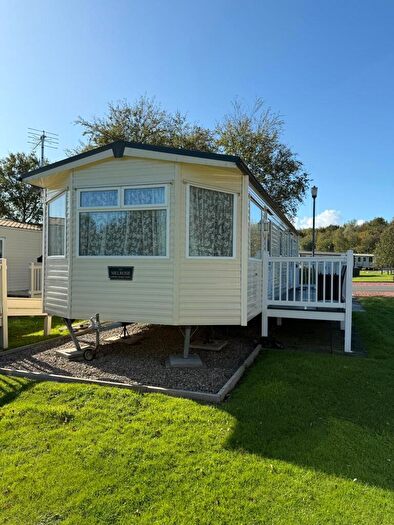
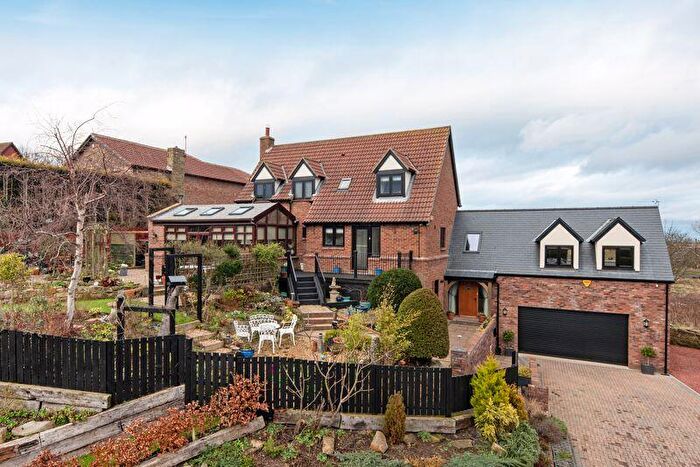
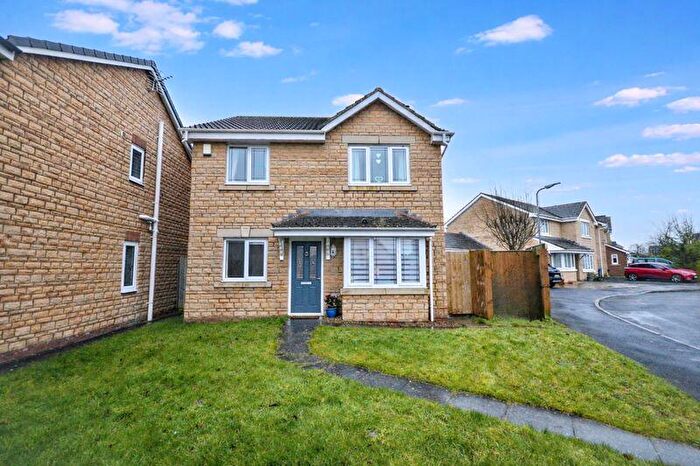
Properties for sale in Amble
Roads and Postcodes in Amble
Navigate through our locations to find the location of your next house in Amble, Morpeth for sale or to rent.
| Streets | Postcodes |
|---|---|
| Aidan Road | NE65 0EQ |
| Alndale | NE65 0RQ |
| Alnwick Way | NE65 0GQ |
| Anderson Crescent | NE65 0QL |
| Andrew Drive | NE65 0QY NE65 0RP NE65 0RW |
| Anne Crescent | NE65 0QX NE65 0QZ NE65 0RR NE65 0RT NE65 0RU |
| Bamburgh Close | NE65 0GR |
| Barties Town | NE65 9RP |
| Bay View | NE65 0AZ |
| Blackwood Street | NE65 0BG |
| Bridge Street | NE65 0DR |
| Brinkburn Place | NE65 0BJ |
| Broomhill Street | NE65 0AN |
| Burnside | NE65 0HB |
| Burton Road | NE65 0QP NE65 0QW |
| Burtons Yard | NE65 9UA |
| Byron Street | NE65 0ER |
| Cartington Court | NE65 0BW |
| Chapel Row | NE65 9TU |
| Charles Road | NE65 0RD NE65 0SQ NE65 0RA |
| Chevington Green | NE65 9AX |
| Cheviotdale | NE65 0SH |
| Chillingham Court | NE65 0GP |
| Church Street | NE65 0DY NE65 0DZ |
| Churchill Avenue | NE65 0QJ |
| Coquet Enterprise Park | NE65 0PE |
| Coquet Street | NE65 0DJ |
| Coquetdale | NE65 0RL NE65 0RN NE65 0RS |
| Cormorant Place | NE65 0FW |
| Cross Street | NE65 0EY |
| Dandsfield Square | NE65 0SJ |
| Davis Drive | NE65 0QN |
| Dilston Terrace | NE65 0DT NE65 0DB |
| Dolphin Court | NE65 0BS |
| Dovecote Street | NE65 0DX |
| Dunstanburgh Walk | NE65 0GT |
| East View | NE65 9TS |
| Eider Close | NE65 0ZG |
| Elm Court | NE65 9YL |
| Etal Drive | NE65 0GS |
| First Avenue | NE65 0EX |
| Fontburn | NE65 0BL |
| Ford Crescent | NE65 0FY |
| Fulmar Drive | NE65 0FU |
| Gannet Drive | NE65 0FR |
| George Street | NE65 0DW |
| Glendale | NE65 0RE NE65 0RG NE65 0RH NE65 0RJ |
| Glendale Court | NE65 0RB |
| Gloster Hill Court | NE65 0FH |
| Gordon Street | NE65 0AT |
| Gordon Terrace | NE65 9TT |
| Gordon Villas | NE65 0AU |
| Guillemot Road | NE65 0ZF |
| Guyzance Avenue | NE65 9XA |
| Harbour Road | NE65 0AR NE65 0AP |
| Hauxley Links | NE65 0JR |
| Hauxley Road | NE65 0JL |
| Hauxley Way | NE65 0QA |
| Henderson Street | NE65 0AE |
| Holywell Crescent | NE65 0QE |
| Island View | NE65 0SE NE65 0SF |
| Ivy Street | NE65 0PR |
| John Street | NE65 0AH |
| Kennedy Road | NE65 0QH |
| King Edward Street | NE65 0ES |
| Kirkwell Cottages | NE65 0JN |
| Kittiwake Place | NE65 0FS |
| Ladbroke Street | NE65 0AS |
| Lawson Street | NE65 0DN |
| Leazes Street | NE65 0AA NE65 0AL NE65 0FD |
| Leslie Drive | NE65 0PT NE65 0PX NE65 0QG NE65 0QS NE65 0PU NE65 0QF NE65 0QT |
| Lime Street | NE65 0AD |
| Lindisfarne Road | NE65 0EH |
| Links Avenue | NE65 0RX NE65 0RY NE65 0RZ NE65 0SA |
| Links Road | NE65 0SB NE65 0SG NE65 0SD |
| Main Street | NE65 0JB NE65 0JF |
| Marine Road | NE65 0BA NE65 0BB |
| Meadowburn | NE65 0PH |
| Melrose Gardens | NE65 0QB |
| Middleton Street | NE65 0ET |
| Newburgh Street | NE65 0AQ |
| Newmoor Close | NE65 0QD |
| Norham Drive | NE65 0GU |
| North Broomhill | NE65 9UD NE65 9TX |
| North End Close | NE65 9YH |
| North Street | NE65 0BU |
| North View | NE65 0BT |
| Northumbria Terrace | NE65 0EJ |
| Ocean Road | NE65 0AJ |
| Old Coastguard Cottages | NE65 0AY |
| Panhaven Road | NE65 0BD |
| Park Close | NE65 9YN |
| Pelican Road | NE65 0FX |
| Percy Drive | NE65 0HD |
| Percy Street | NE65 0AG NE65 0PL |
| Philip Drive | NE65 0QU |
| Priory Park | NE65 0HG NE65 0HY |
| Puffin View | NE65 0ZE |
| Queen Street | NE65 0BX NE65 0BZ NE65 0DA NE65 0DD NE65 0DQ NE65 9TZ |
| Radar Close | NE65 9UJ |
| Reading Cottages | NE65 9UN |
| Red Row | NE61 5BX |
| Redesdale | NE65 0RF |
| Runciman Way | NE65 0AW |
| Sandyway | NE65 0PQ |
| School Row | NE65 9TY |
| Sea View | NE65 0BE |
| Second Avenue | NE65 0EU |
| Smith Street | NE65 0AF |
| Southmead | NE65 0WH |
| St Cuthberts Avenue | NE65 0PY NE65 0PZ |
| St Lawrence Avenue | NE65 0QQ |
| St Oswalds Court | NE65 0BH |
| Station Cottages | NE65 0DS NE65 9UF |
| Station Road | NE65 9UH NE65 9UU |
| Stephenson Road | NE65 0QR |
| Stone Row | NE65 9UE |
| Straffen Court | NE65 0HA |
| Tern Row | NE65 0FT |
| Togston Court | NE65 9YW |
| Togston Crescent | NE65 9TP |
| Togston Road | NE65 9TW NE65 9UZ |
| Togston Terrace | NE65 9UB |
| Turner Street | NE65 0BN NE65 0DH |
| Tynedale | NE65 0GW |
| Warkworth Terrace | NE65 9UP |
| Warkworth Way | NE65 0FZ |
| Wellwood Street | NE65 0EL NE65 0EN NE65 0EP NE65 0EB NE65 0FG |
| Windsor Terrace | NE65 0PP |
| NE65 0AX NE65 0HR NE65 0HS NE65 0JD NE65 0JP NE65 0JS NE65 0JW NE65 0FB NE65 0FQ NE65 0HT NE65 0HU NE65 0JJ NE65 0JT NE65 0PW NE65 0ZD NE65 9TA NE65 0DF |
Transport near Amble
- FAQ
- Price Paid By Year
- Property Type Price
Frequently asked questions about Amble
What is the average price for a property for sale in Amble?
The average price for a property for sale in Amble is £199,635. This amount is 28% lower than the average price in Morpeth. There are 1,999 property listings for sale in Amble.
What streets have the most expensive properties for sale in Amble?
The streets with the most expensive properties for sale in Amble are Gloster Hill Court at an average of £760,000, Hauxley Road at an average of £550,000 and Hauxley Links at an average of £343,375.
What streets have the most affordable properties for sale in Amble?
The streets with the most affordable properties for sale in Amble are Togston Terrace at an average of £47,000, Togston Crescent at an average of £91,100 and School Row at an average of £100,000.
Which train stations are available in or near Amble?
Some of the train stations available in or near Amble are Acklington, Alnmouth and Widdrington.
Property Price Paid in Amble by Year
The average sold property price by year was:
| Year | Average Sold Price | Price Change |
Sold Properties
|
|---|---|---|---|
| 2025 | £204,586 | 3% |
59 Properties |
| 2024 | £197,910 | -0,1% |
101 Properties |
| 2023 | £198,125 | -17% |
78 Properties |
| 2022 | £231,119 | 26% |
82 Properties |
| 2021 | £171,115 | -5% |
103 Properties |
| 2020 | £179,945 | 19% |
86 Properties |
| 2019 | £145,115 | -14% |
122 Properties |
| 2018 | £164,816 | 13% |
134 Properties |
| 2017 | £143,177 | -11% |
149 Properties |
| 2016 | £158,495 | 12% |
154 Properties |
| 2015 | £138,836 | 16% |
113 Properties |
| 2014 | £116,951 | -1% |
83 Properties |
| 2013 | £118,272 | 10% |
60 Properties |
| 2012 | £106,886 | 8% |
56 Properties |
| 2011 | £98,625 | -33% |
51 Properties |
| 2010 | £130,731 | 7% |
49 Properties |
| 2009 | £121,997 | -4% |
53 Properties |
| 2008 | £126,787 | -2% |
74 Properties |
| 2007 | £129,423 | 8% |
103 Properties |
| 2006 | £119,168 | 0,2% |
113 Properties |
| 2005 | £118,926 | 15% |
130 Properties |
| 2004 | £101,001 | 26% |
90 Properties |
| 2003 | £74,380 | 27% |
133 Properties |
| 2002 | £54,293 | 4% |
122 Properties |
| 2001 | £51,892 | 16% |
118 Properties |
| 2000 | £43,768 | 3% |
107 Properties |
| 1999 | £42,341 | 13% |
68 Properties |
| 1998 | £36,748 | 3% |
76 Properties |
| 1997 | £35,653 | -5% |
112 Properties |
| 1996 | £37,359 | 9% |
74 Properties |
| 1995 | £33,976 | - |
72 Properties |
Property Price per Property Type in Amble
Here you can find historic sold price data in order to help with your property search.
The average Property Paid Price for specific property types in the last three years are:
| Property Type | Average Sold Price | Sold Properties |
|---|---|---|
| Flat | £176,468.00 | 16 Flats |
| Semi Detached House | £204,593.00 | 43 Semi Detached Houses |
| Detached House | £318,631.00 | 38 Detached Houses |
| Terraced House | £168,683.00 | 141 Terraced Houses |

