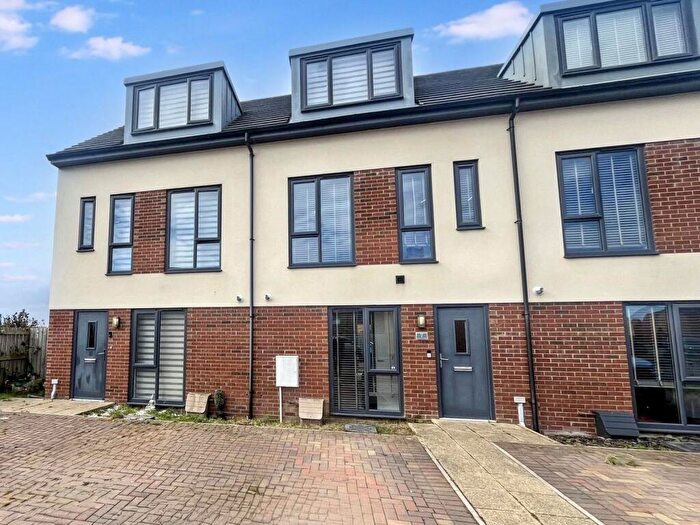
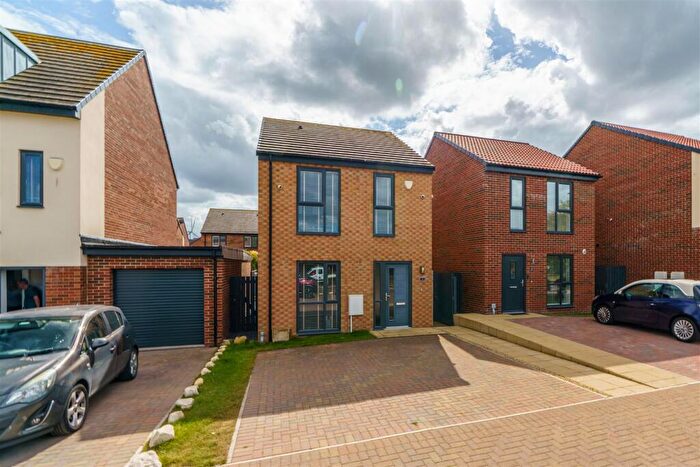
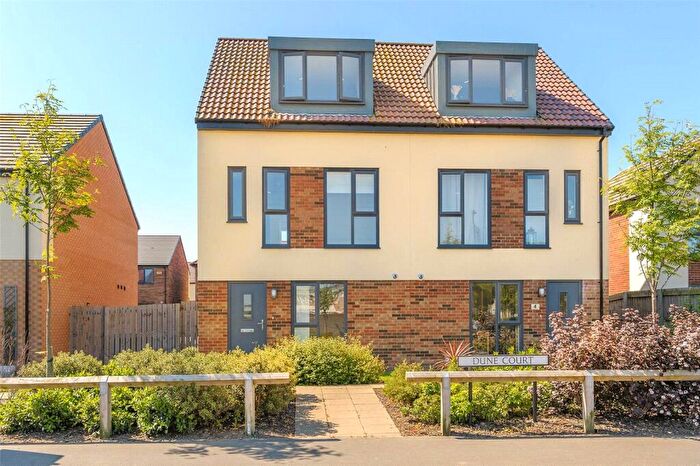
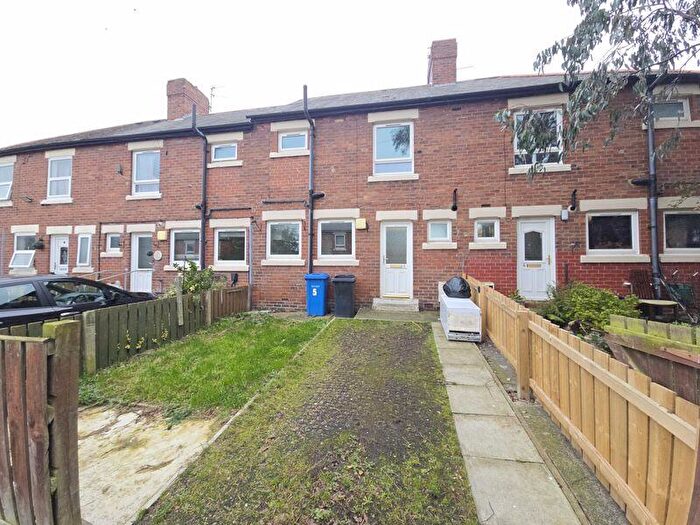
Houses for sale & to rent in Lynemouth, Morpeth
House Prices in Lynemouth
Properties in Lynemouth have an average house price of £154,066.00 and had 213 Property Transactions within the last 3 years¹.
Lynemouth is an area in Morpeth, Northumberland with 1,985 households², where the most expensive property was sold for £650,000.00.
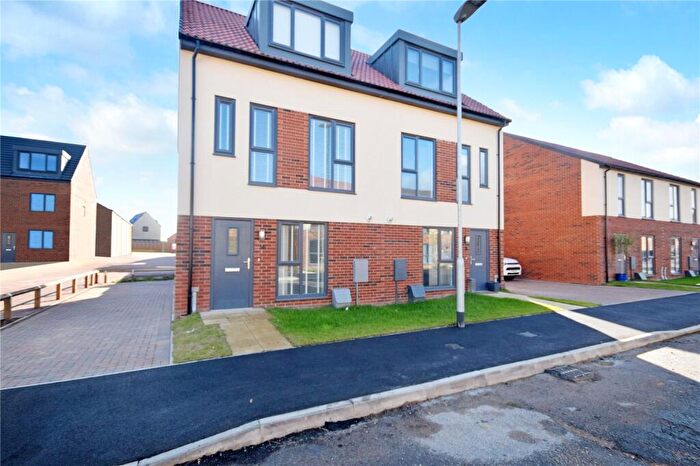
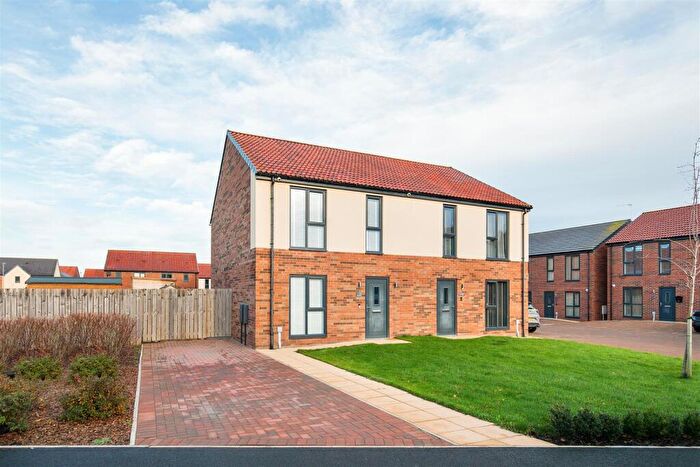
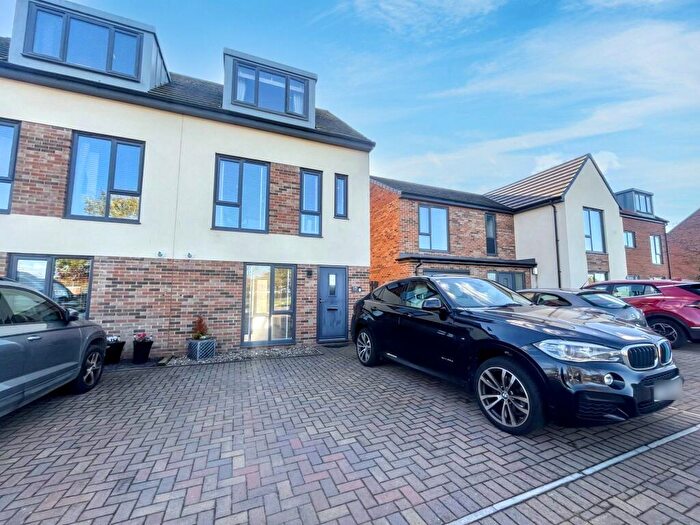
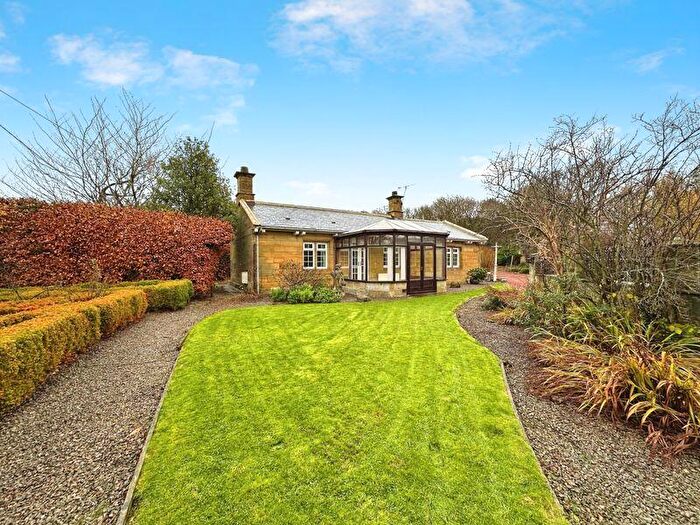
Properties for sale in Lynemouth
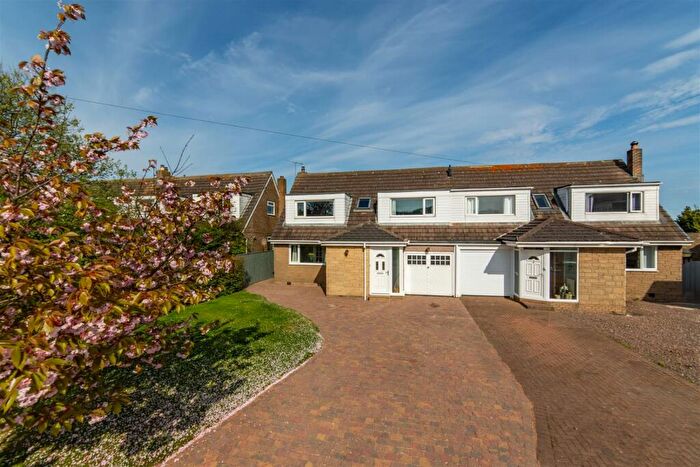
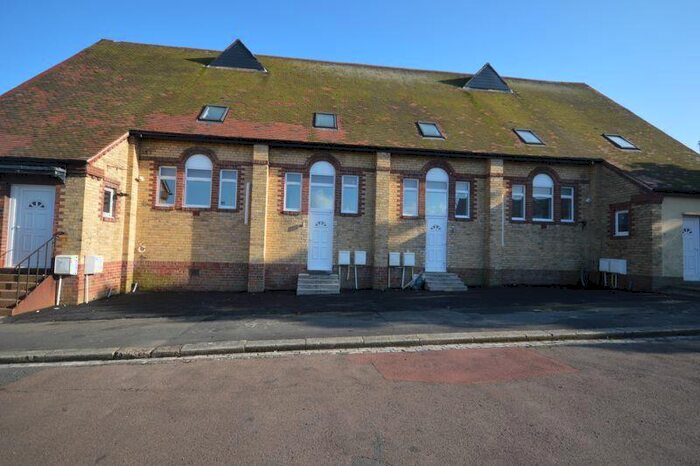
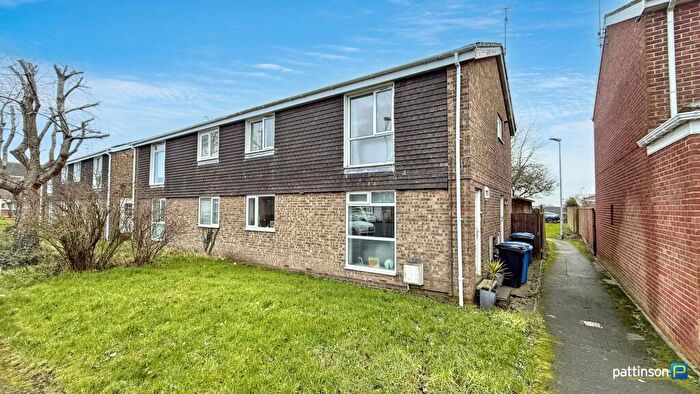
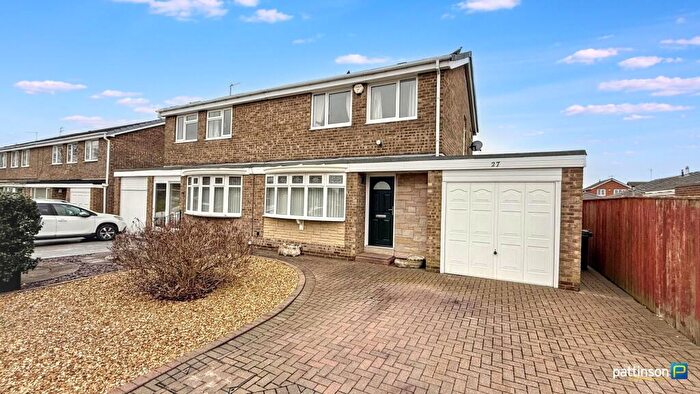
Previously listed properties in Lynemouth
Roads and Postcodes in Lynemouth
Navigate through our locations to find the location of your next house in Lynemouth, Morpeth for sale or to rent.
| Streets | Postcodes |
|---|---|
| Aiden Grove | NE61 5HJ |
| Albion Terrace | NE61 5SX NE61 5SY NE61 5SZ NE61 5TA NE61 5TB |
| Aln Court | NE61 5LR |
| Back Queen Street | NE61 5XG |
| Beech Drive | NE61 5EU |
| Boland Road | NE61 5UB NE61 5UD |
| Bowmont | NE61 5LT |
| Breamish | NE61 5LJ |
| Bridge Road | NE61 5YJ NE61 5YL |
| Chester Square | NE61 5UF |
| Cheviot Close | NE61 5HZ |
| Church Square | NE61 5TP NE61 5TR |
| Coquet Drive | NE61 5LN |
| Coronation Cottages | NE61 5TZ |
| Cragview Court | NE61 5RW |
| Cresswell Road | NE61 5HR NE61 5HS |
| Dalton Avenue | NE61 5TD NE61 5TE NE61 5TF NE61 5TG NE61 5TH NE61 5TJ NE61 5TQ |
| Dene View | NE61 5HQ |
| East View | NE61 5JH |
| Eden Terrace | NE61 5TT NE61 5TU NE61 5TX |
| Elder Drive | NE61 5EW |
| Ellington View | NE61 5BN |
| Fairview Road | NE61 5FA |
| Fenham Road | NE61 5XB NE61 5XD |
| Fifth Row | NE61 5SL |
| Fir Grove | NE61 5EX |
| First Row | NE61 5HD NE61 5SH |
| Fontburn | NE61 5EP |
| Fourth Row | NE61 5SJ |
| Foxcover | NE61 5SR |
| Front Street | NE61 5JA NE61 5JF |
| Glenside | NE61 5LS |
| Guildford Square | NE61 5XN NE61 5XP NE61 5XW |
| Harthope | NE61 5ET |
| Haven Court | NE61 5FD |
| Hazel Grove | NE61 5EZ |
| Henley Square | NE61 5XT NE61 5XU NE61 5XX |
| High Farm Cottages | NE61 5JE |
| Holly Way | NE61 5DG |
| Ingleby Terrace | NE61 5XR NE61 5XS |
| Irthing | NE61 5LP |
| Ivy Close | NE61 5DH |
| Jersey Square | NE61 5XY NE61 5XZ NE61 5YA |
| Jubilee Cottages | NE61 5UE |
| Kingsley Road | NE61 5YB NE61 5YD |
| Lilac Court | NE61 5PQ |
| Linden Way | NE61 5EY |
| Low Farm | NE61 5PA |
| Low Farm Cottages | NE61 5JQ |
| Lyne Terrace | NE61 5UG |
| Lyneburn Grange | NE61 5BZ |
| Lynemouth Road | NE61 5HN NE61 5BP |
| Market Square | NE61 5TL |
| Matlock Square | NE61 5YE NE61 5YF |
| Meadow Way | NE61 5FB |
| Mill Court | NE61 5PH |
| Mill Farm | NE61 5BW |
| Neville Square | NE61 5YH NE61 5YQ |
| Oak Drive | NE61 5DF |
| Oakland Terrace | NE61 5YG |
| Orchard View | NE61 5SP |
| Park Road | NE61 5XH NE61 5XJ NE61 5XA NE61 5XL |
| Plough Gardens | NE61 5JZ |
| Potland View | NE61 5SA |
| Queen Street | NE61 5XE NE61 5XF |
| Ravensworth Gardens | NE61 5HP |
| Rede Court | NE61 5LW |
| River View | NE61 5TY |
| Sea View | NE61 5TW NE61 5TN |
| Second Row | NE61 5HE NE61 5SQ |
| Springwell Drive | NE61 5HH |
| The Elms | NE61 5LH |
| The Knoll | NE61 5LQ |
| Third Row | NE61 5HF NE61 5SB |
| Till Grove | NE61 5ER |
| Tulip Close | NE61 5FF |
| Tweed Avenue | NE61 5ES |
| Wansbeck Close | NE61 5LL |
| Warkworth Drive | NE61 5HL |
| Wayside Way | NE61 5FE |
| West Market Street | NE61 5TS NE61 5UR |
| Willow Way | NE61 5BQ |
| Windmill Heights | NE61 5HW |
| Windmill Hill | NE61 5HU NE61 5RU |
| Windmill Hill Close | NE61 5BS |
| Woodside Way | NE61 5DE |
| Wych Elm Close | NE61 5PJ |
| NE61 5HG NE61 5HY NE61 5JB NE61 5JG NE61 5JJ NE61 5JW NE61 5SE NE61 5SF NE61 5SN NE61 5XQ NE61 5BR NE61 5HB NE61 5JD NE61 5JL NE61 5JN NE61 5JP NE61 5JR NE61 5SD NE61 5SG NE61 5UQ |
Transport near Lynemouth
- FAQ
- Price Paid By Year
- Property Type Price
Frequently asked questions about Lynemouth
What is the average price for a property for sale in Lynemouth?
The average price for a property for sale in Lynemouth is £154,066. This amount is 44% lower than the average price in Morpeth. There are 499 property listings for sale in Lynemouth.
What streets have the most expensive properties for sale in Lynemouth?
The streets with the most expensive properties for sale in Lynemouth are Lilac Court at an average of £650,000, Windmill Hill at an average of £436,250 and Mill Farm at an average of £411,990.
What streets have the most affordable properties for sale in Lynemouth?
The streets with the most affordable properties for sale in Lynemouth are Irthing at an average of £39,950, Chester Square at an average of £48,389 and Fourth Row at an average of £54,500.
Which train stations are available in or near Lynemouth?
Some of the train stations available in or near Lynemouth are Widdrington, Pegswood and Morpeth.
Property Price Paid in Lynemouth by Year
The average sold property price by year was:
| Year | Average Sold Price | Price Change |
Sold Properties
|
|---|---|---|---|
| 2025 | £163,988 | 10% |
57 Properties |
| 2024 | £147,382 | -4% |
83 Properties |
| 2023 | £153,917 | 5% |
73 Properties |
| 2022 | £146,910 | -0,3% |
105 Properties |
| 2021 | £147,415 | 9% |
104 Properties |
| 2020 | £134,229 | 6% |
70 Properties |
| 2019 | £126,804 | 3% |
85 Properties |
| 2018 | £123,578 | -2% |
105 Properties |
| 2017 | £126,225 | 12% |
74 Properties |
| 2016 | £111,099 | 7% |
56 Properties |
| 2015 | £103,129 | -18% |
75 Properties |
| 2014 | £121,557 | 21% |
85 Properties |
| 2013 | £95,665 | -22% |
66 Properties |
| 2012 | £116,550 | 12% |
67 Properties |
| 2011 | £102,705 | -1% |
54 Properties |
| 2010 | £103,559 | -3% |
50 Properties |
| 2009 | £106,956 | -26% |
54 Properties |
| 2008 | £134,445 | 13% |
69 Properties |
| 2007 | £117,158 | 1% |
102 Properties |
| 2006 | £116,056 | 14% |
121 Properties |
| 2005 | £99,429 | 5% |
111 Properties |
| 2004 | £94,719 | 26% |
100 Properties |
| 2003 | £69,738 | 16% |
121 Properties |
| 2002 | £58,923 | 9% |
97 Properties |
| 2001 | £53,789 | -26% |
123 Properties |
| 2000 | £67,752 | 24% |
81 Properties |
| 1999 | £51,177 | 9% |
81 Properties |
| 1998 | £46,825 | 17% |
94 Properties |
| 1997 | £38,943 | 12% |
85 Properties |
| 1996 | £34,135 | -1% |
66 Properties |
| 1995 | £34,562 | - |
62 Properties |
Property Price per Property Type in Lynemouth
Here you can find historic sold price data in order to help with your property search.
The average Property Paid Price for specific property types in the last three years are:
| Property Type | Average Sold Price | Sold Properties |
|---|---|---|
| Semi Detached House | £168,794.00 | 52 Semi Detached Houses |
| Detached House | £298,153.00 | 48 Detached Houses |
| Terraced House | £87,634.00 | 108 Terraced Houses |
| Flat | £52,580.00 | 5 Flats |

