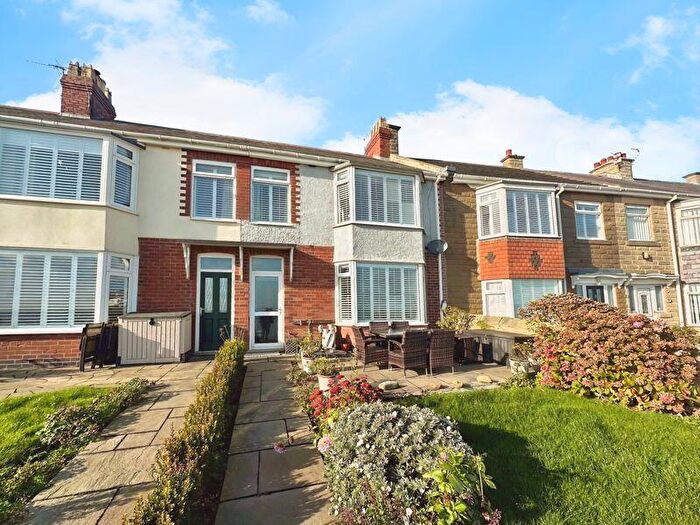
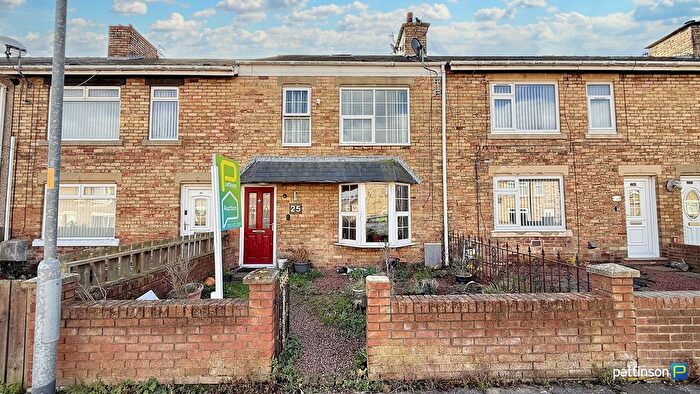
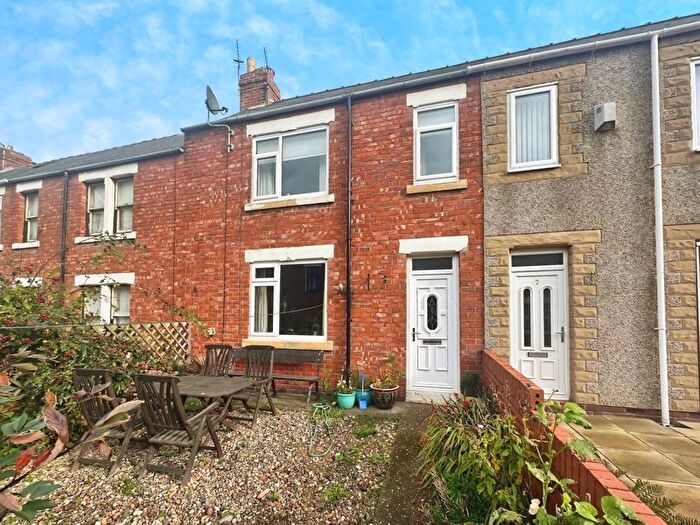
Houses for sale & to rent in Newbiggin Central And East, Newbiggin-by-the-sea
House Prices in Newbiggin Central And East
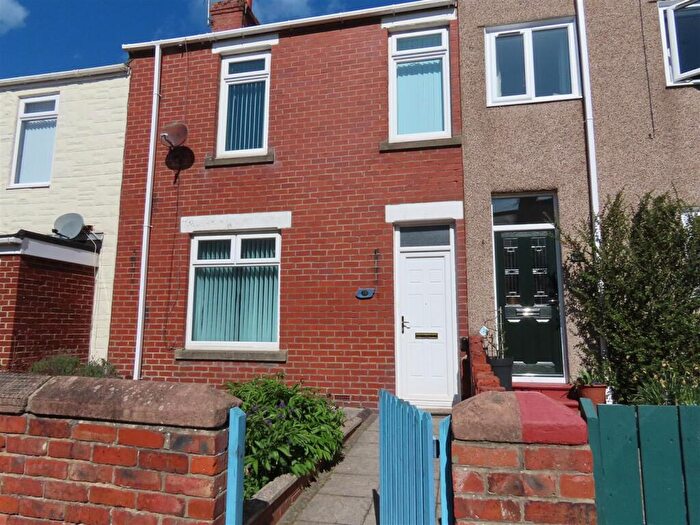
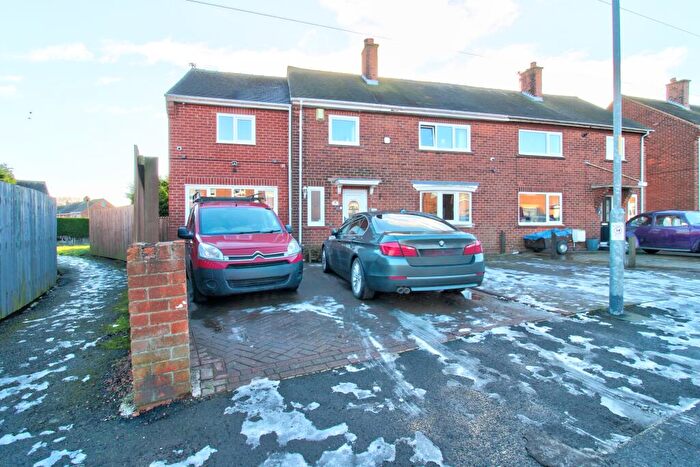
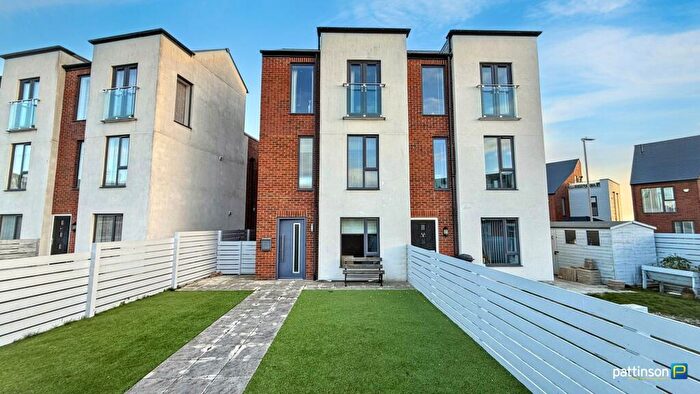
Properties in Newbiggin Central And East have an average house price of £125,839.00 and had 316 Property Transactions within the last 3 years¹.
Newbiggin Central And East is an area in Newbiggin-by-the-sea, Northumberland with 2,271 households², where the most expensive property was sold for £470,000.00.
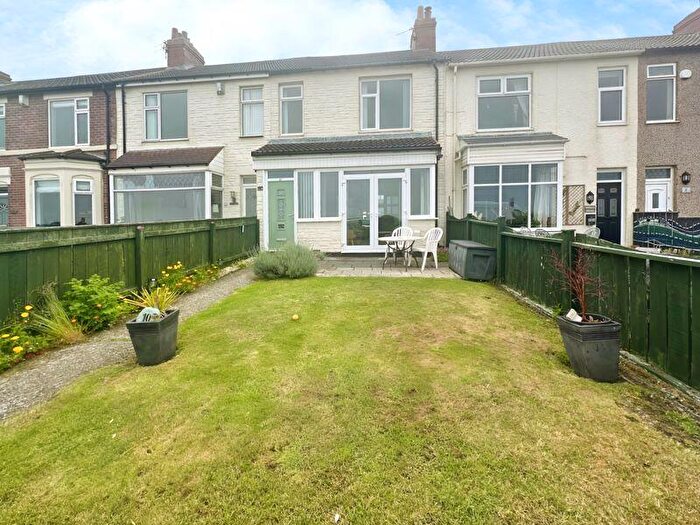
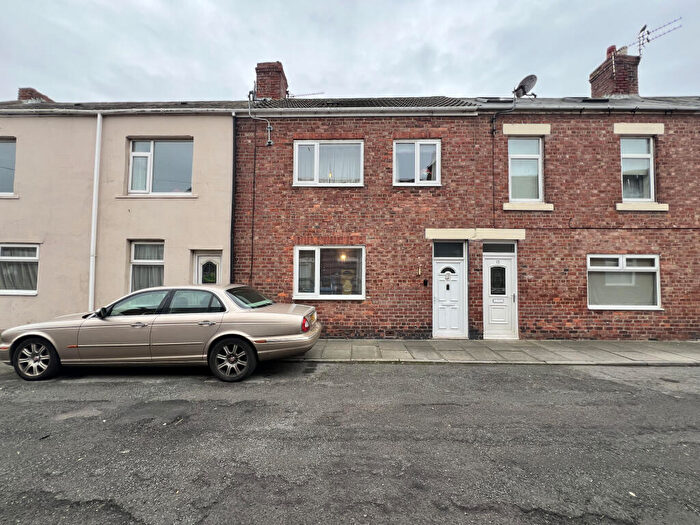
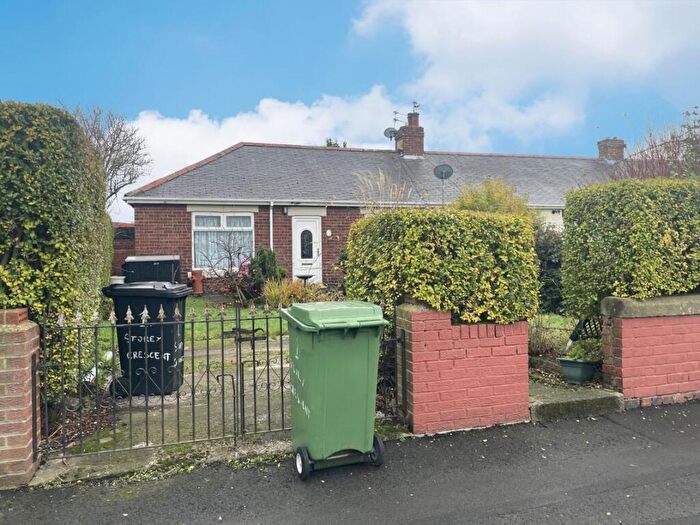
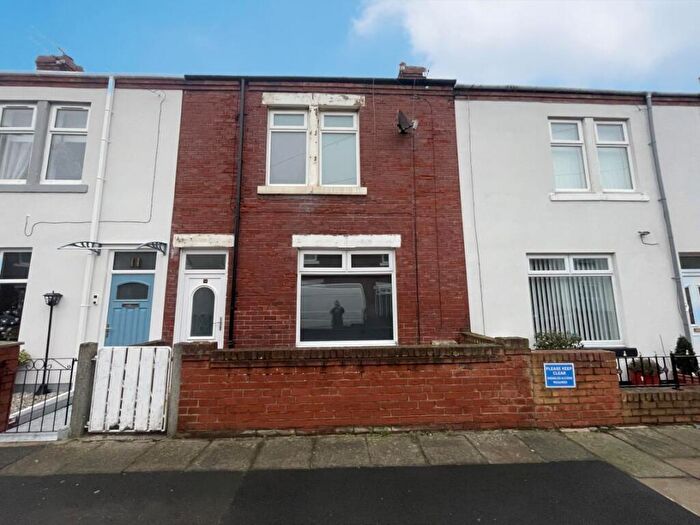
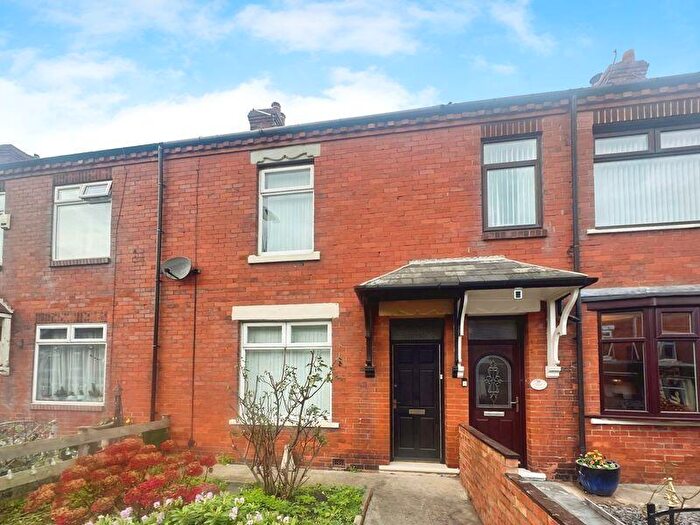
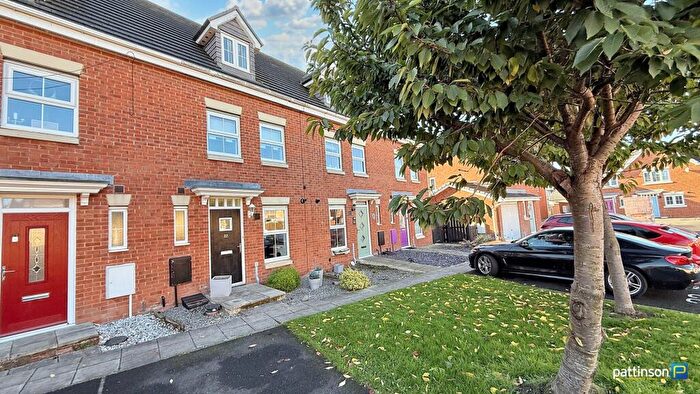
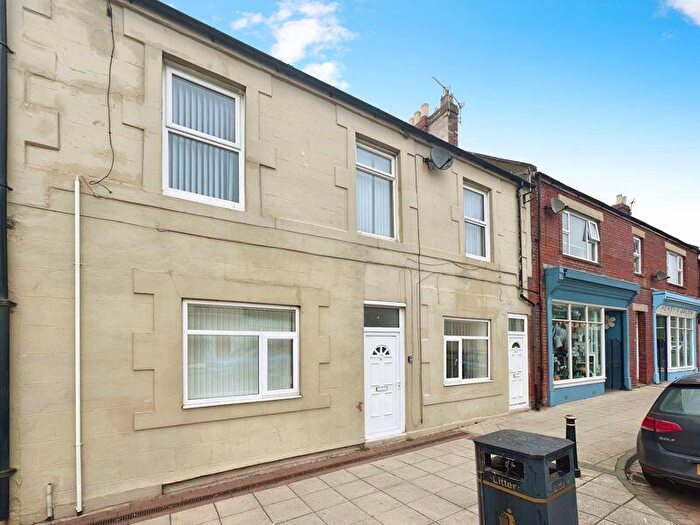
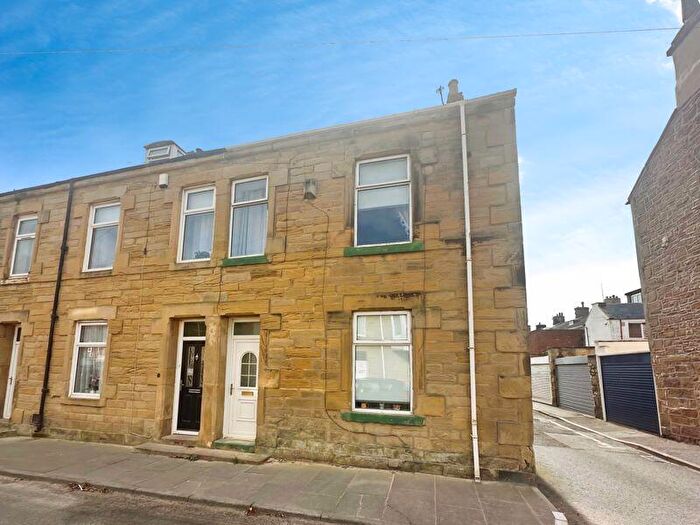
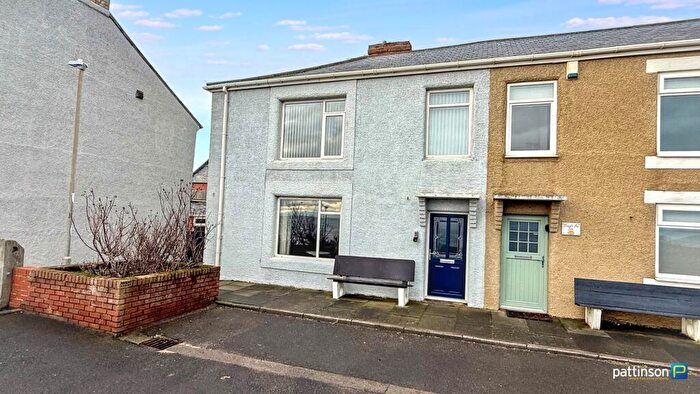
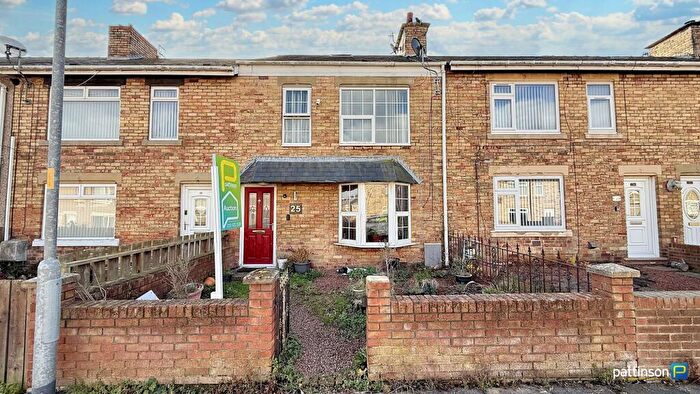
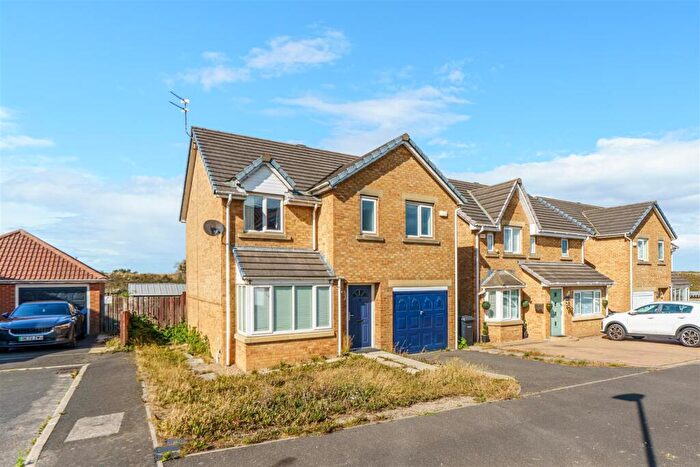
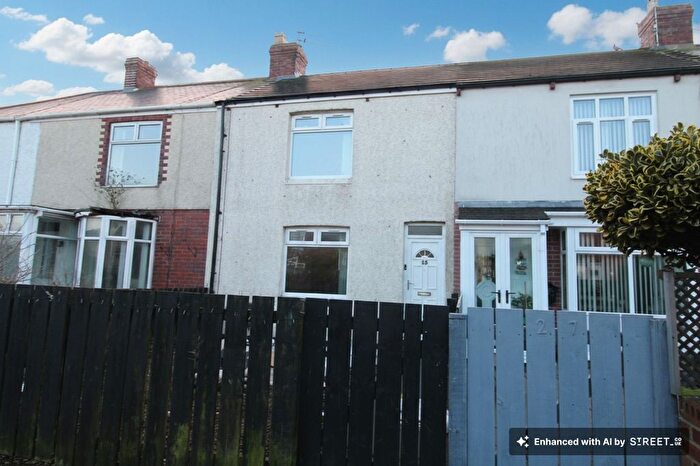
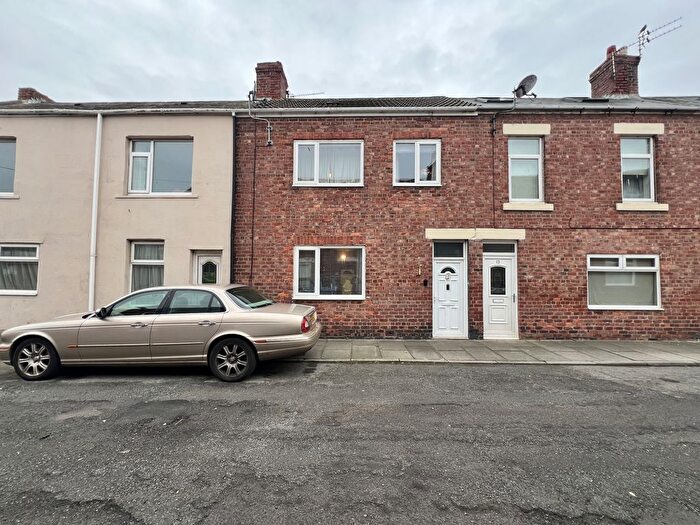
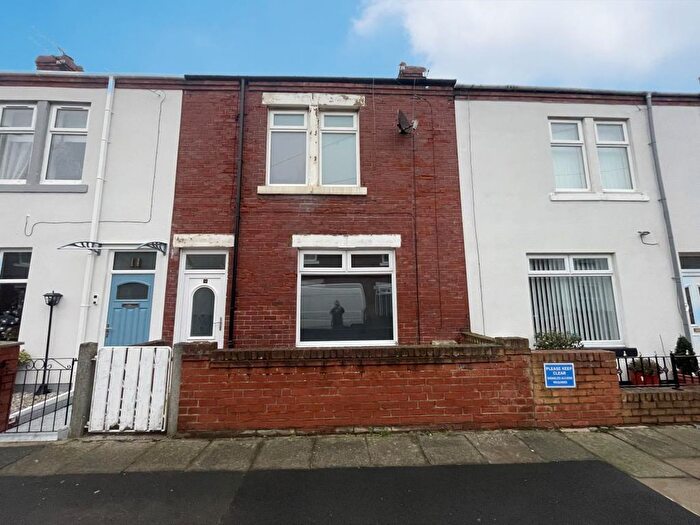
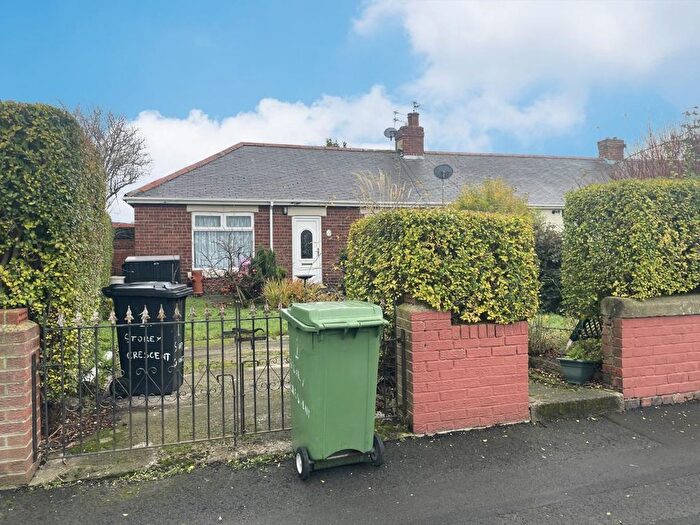
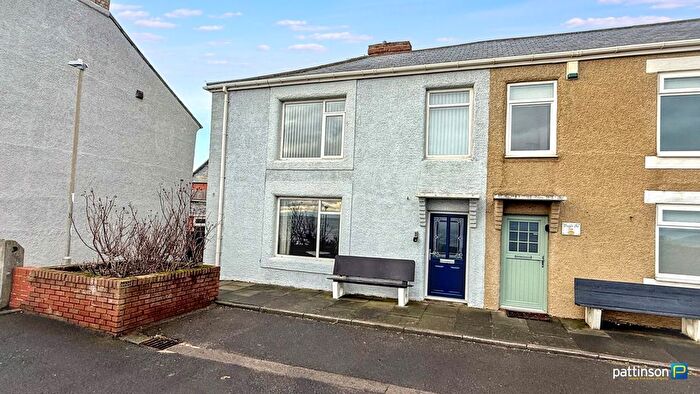
Properties for sale in Newbiggin Central And East
Previously listed properties in Newbiggin Central And East
Roads and Postcodes in Newbiggin Central And East
Navigate through our locations to find the location of your next house in Newbiggin Central And East, Newbiggin-by-the-sea for sale or to rent.
| Streets | Postcodes |
|---|---|
| Alexandra Way | NE64 6JG |
| Allan Road | NE64 6HY |
| Aqua Terrace | NE64 6PB |
| Argyle Terrace | NE64 6PR |
| Attlee Cottages | NE64 6DT |
| Attlee Terrace | NE64 6DU |
| Back Storey Crescent | NE64 6LG |
| Bay View East | NE64 6DZ |
| Bay View West | NE64 6NY |
| Beach Terrace | NE64 6XE |
| Brentwood Avenue | NE64 6JH |
| Brewery Yard | NE64 6NQ |
| Bridge Street | NE64 6EG |
| Buteland Terrace | NE64 6PG NE64 6NS |
| Church Point | NE64 6DB |
| Cleveland Avenue | NE64 6RG NE64 6RQ |
| Cleveland Terrace | NE64 6RF |
| Collingwood Road | NE64 6HT |
| Coronation Street | NE64 6PZ |
| Covent Gardens | NE64 6EE |
| Downies Buildings | NE64 6BE |
| East Lea | NE64 6BH NE64 6BJ NE64 6BQ |
| East Sea View | NE64 6DJ |
| Emerson Road | NE64 6HU |
| Front Street | NE64 6AA NE64 6AD NE64 6AR NE64 6NJ NE64 6NU NE64 6NW NE64 6PJ NE64 6PS NE64 6QD NE64 6AF NE64 6PL |
| Gibson Street | NE64 6PE NE64 6PF NE64 6UW NE64 6UY NE64 6UT NE64 6UU |
| Grasmere Terrace | NE64 6PA |
| Haven View | NE64 6NR |
| Hazelwood Avenue | NE64 6JN |
| Hendersons Buildings | NE64 6EB |
| High Street | NE64 6AT NE64 6DR NE64 6DS |
| Holmwood Avenue | NE64 6JW |
| Jubilee Terrace | NE64 6NX |
| King Georges Road | NE64 6HR NE64 6HS |
| King Street | NE64 6BB |
| Latimer Way | NE64 6JR |
| Links Quarry | NE64 6XQ |
| Locarno Court | NE64 6EL |
| Locarno Place | NE64 6PX |
| Long Park | NE64 6PN NE64 6PW |
| Lynwood Avenue | NE64 6JF |
| Maitland Terrace | NE64 6UR |
| Maitland Villas | NE64 6UQ |
| Manor Court | NE64 6HF |
| Manor Drive | NE64 6HA |
| Manor View | NE64 6HB |
| Marine Cottages | NE64 6UL |
| Marine Street | NE64 6BG |
| Matfen Terrace | NE64 6XU |
| Mauds Terrace | NE64 6AS |
| Meldon Terrace | NE64 6XH NE64 6XJ |
| Melrose Terrace | NE64 6XN |
| Memorial Square | NE64 6JE |
| Moor Croft | NE64 6AW |
| Moor Croft View | NE64 6AP |
| Moor End Villas | NE64 6DL |
| Moor View | NE64 6DH |
| New King Street | NE64 6BD |
| New Queen Street | NE64 6AZ NE64 6DF |
| New Sandridge | NE64 6DY |
| North Seaton Road | NE64 6XR NE64 6XS NE64 6XT |
| North View | NE64 6XX |
| Northumberland Avenue | NE64 6RJ NE64 6RL |
| Oakwood Avenue | NE64 6HD NE64 6AN |
| Ocean View | NE64 6PD |
| Oswald Road | NE64 6HX |
| Pelaw Avenue | NE64 6LD |
| Pembroke Court | NE64 6EQ |
| Promenade | NE64 6DA |
| Promenade View | NE64 6US |
| Prospect Place | NE64 6DN |
| Queen Street | NE64 6BA NE64 6DE |
| Queens Place | NE64 6AY |
| Richard Ashley Close | NE64 6BP |
| Robinson Square | NE64 6EA |
| Rothsay Terrace | NE64 6XW |
| Rustic Terrace | NE64 6AU |
| Sandridge | NE64 6DX |
| Sea Bank | NE64 6NT |
| Sea Crest Road | NE64 6BL NE64 6BN NE64 6BW |
| Sea View Lane | NE64 6AQ |
| Sea View Terrace | NE64 6AE |
| Seaton Avenue | NE64 6UX |
| Sidney Crescent | NE64 6XB |
| Simonside Terrace | NE64 6PU |
| Smallholdings | NE64 6JU |
| Store Farm Road | NE64 6LB |
| Storey Crescent | NE64 6LF NE64 6LE |
| Sutherland Avenue | NE64 6RH |
| The Haven | NE64 6NP |
| The Villas | NE64 6HW |
| Thirlmere Terrace | NE64 6NZ |
| Vernon Place | NE64 6ED |
| Victoria Terrace | NE64 6NL |
| Watts Lane | NE64 6AL |
| Waverley Place | NE64 6AX |
| West View | NE64 6QA |
| Westfield Crescent | NE64 6XA |
| Windsor Gardens | NE64 6UN |
| Windsor Road | NE64 6UH |
| Windsor Terrace | NE64 6UJ |
| Woodhorn Crescent | NE64 6JB NE64 6JD |
| Woodhorn Farm | NE64 6AH |
| Woodhorn Lane | NE64 6PY |
| Woodhorn Road | NE64 6HZ NE64 6JA NE64 6JT NE64 6HG NE64 6HL NE64 6HN |
| Woodlea | NE64 6HH NE64 6HJ NE64 6HQ |
| Woodlea Court | NE64 6HE |
| NE64 6AJ NE64 6DG NE64 6DP NE64 6DQ NE64 6DW NE64 6LH NE64 6NN NE64 6PP NE64 6XD NE64 6XL |
Transport near Newbiggin Central And East
- FAQ
- Price Paid By Year
- Property Type Price
Frequently asked questions about Newbiggin Central And East
What is the average price for a property for sale in Newbiggin Central And East?
The average price for a property for sale in Newbiggin Central And East is £125,839. This amount is 0.14% higher than the average price in Newbiggin-by-the-sea. There are 406 property listings for sale in Newbiggin Central And East.
What streets have the most expensive properties for sale in Newbiggin Central And East?
The streets with the most expensive properties for sale in Newbiggin Central And East are Promenade View at an average of £470,000, Links Quarry at an average of £328,000 and Haven View at an average of £270,000.
What streets have the most affordable properties for sale in Newbiggin Central And East?
The streets with the most affordable properties for sale in Newbiggin Central And East are King Georges Road at an average of £50,666, Emerson Road at an average of £53,638 and Woodhorn Road at an average of £63,414.
Which train stations are available in or near Newbiggin Central And East?
Some of the train stations available in or near Newbiggin Central And East are Pegswood, Widdrington and Morpeth.
Property Price Paid in Newbiggin Central And East by Year
The average sold property price by year was:
| Year | Average Sold Price | Price Change |
Sold Properties
|
|---|---|---|---|
| 2025 | £135,171 | 4% |
60 Properties |
| 2024 | £130,006 | 1% |
82 Properties |
| 2023 | £128,311 | 11% |
77 Properties |
| 2022 | £114,583 | -3% |
97 Properties |
| 2021 | £117,880 | 22% |
112 Properties |
| 2020 | £91,733 | 3% |
86 Properties |
| 2019 | £89,192 | -6% |
71 Properties |
| 2018 | £94,230 | -4% |
87 Properties |
| 2017 | £98,183 | 10% |
113 Properties |
| 2016 | £88,353 | 4% |
97 Properties |
| 2015 | £84,931 | 8% |
71 Properties |
| 2014 | £78,017 | -4% |
78 Properties |
| 2013 | £80,816 | -5% |
58 Properties |
| 2012 | £84,709 | 8% |
41 Properties |
| 2011 | £77,785 | -5% |
52 Properties |
| 2010 | £81,844 | 1% |
38 Properties |
| 2009 | £80,855 | -13% |
51 Properties |
| 2008 | £91,270 | -12% |
71 Properties |
| 2007 | £102,572 | 15% |
133 Properties |
| 2006 | £87,101 | -7% |
144 Properties |
| 2005 | £93,573 | 13% |
120 Properties |
| 2004 | £80,989 | 33% |
123 Properties |
| 2003 | £54,014 | 35% |
106 Properties |
| 2002 | £34,871 | -6% |
117 Properties |
| 2001 | £36,878 | 21% |
88 Properties |
| 2000 | £29,098 | -5% |
68 Properties |
| 1999 | £30,437 | 8% |
60 Properties |
| 1998 | £28,045 | -4% |
70 Properties |
| 1997 | £29,295 | 24% |
40 Properties |
| 1996 | £22,239 | -31% |
59 Properties |
| 1995 | £29,082 | - |
47 Properties |
Property Price per Property Type in Newbiggin Central And East
Here you can find historic sold price data in order to help with your property search.
The average Property Paid Price for specific property types in the last three years are:
| Property Type | Average Sold Price | Sold Properties |
|---|---|---|
| Semi Detached House | £137,443.00 | 42 Semi Detached Houses |
| Detached House | £218,326.00 | 24 Detached Houses |
| Terraced House | £115,975.00 | 245 Terraced Houses |
| Flat | £67,800.00 | 5 Flats |

