
Houses for sale & to rent in Ponteland West, Newcastle Upon Tyne
House Prices in Ponteland West
Properties in Ponteland West have an average house price of £622,934.00 and had 222 Property Transactions within the last 3 years¹.
Ponteland West is an area in Newcastle Upon Tyne, Northumberland with 1,654 households², where the most expensive property was sold for £2,250,000.00.
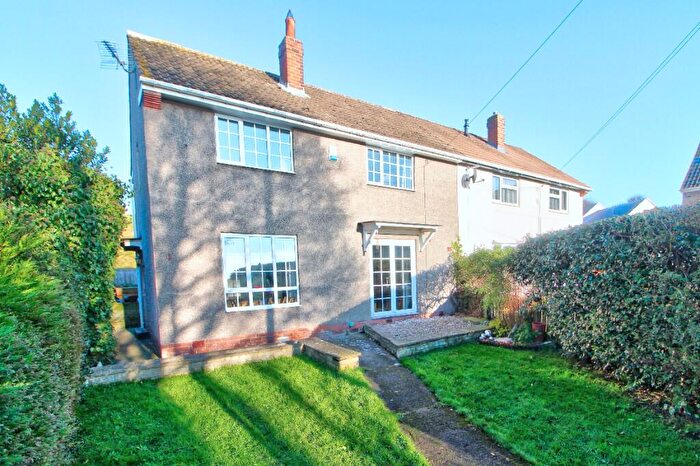
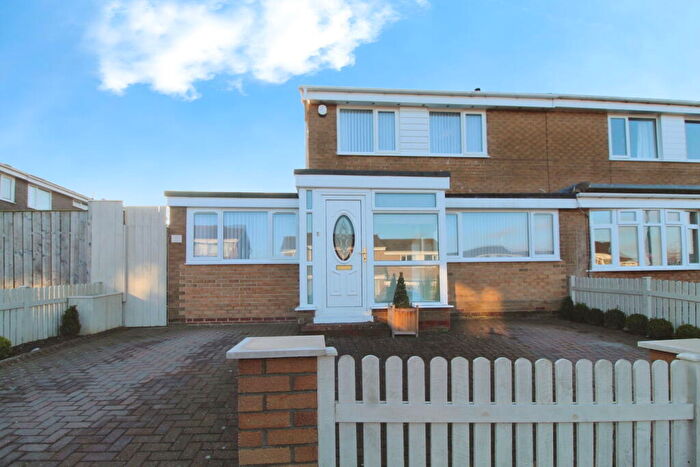
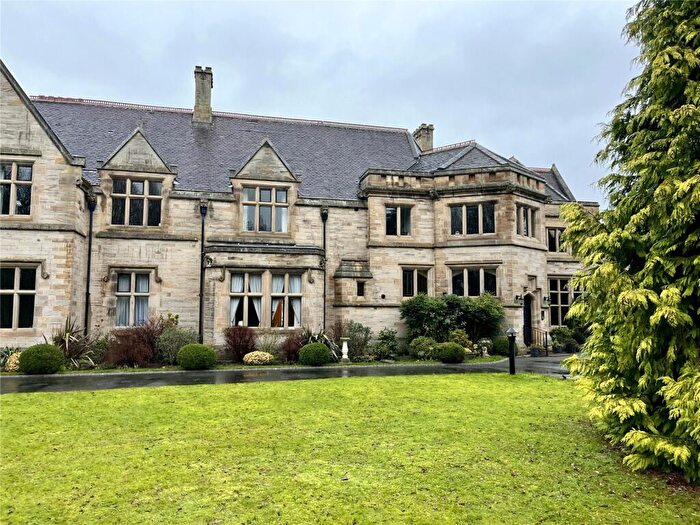
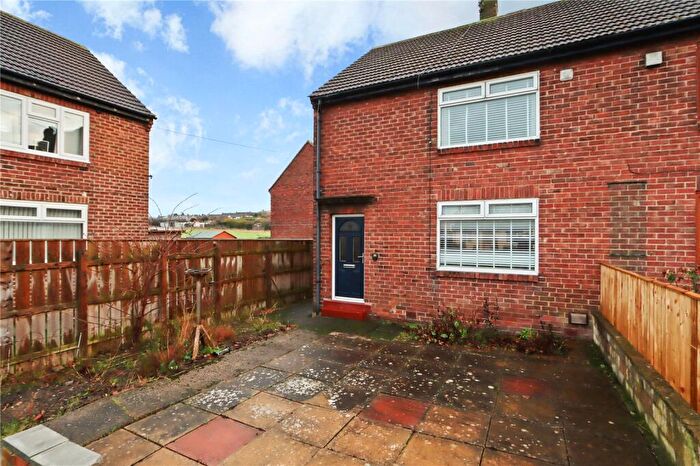
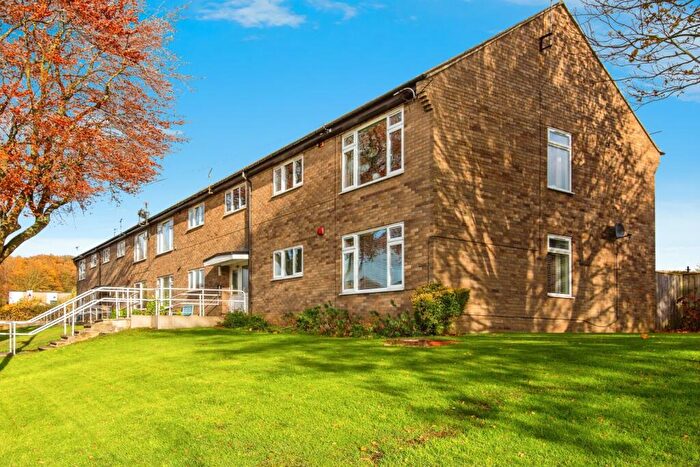
Properties for sale in Ponteland West
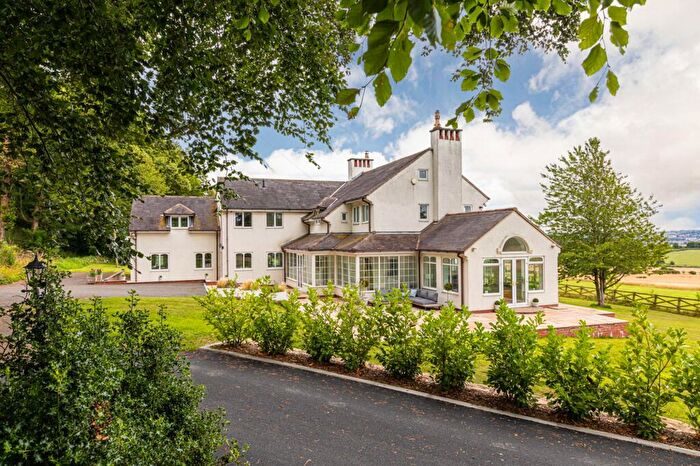

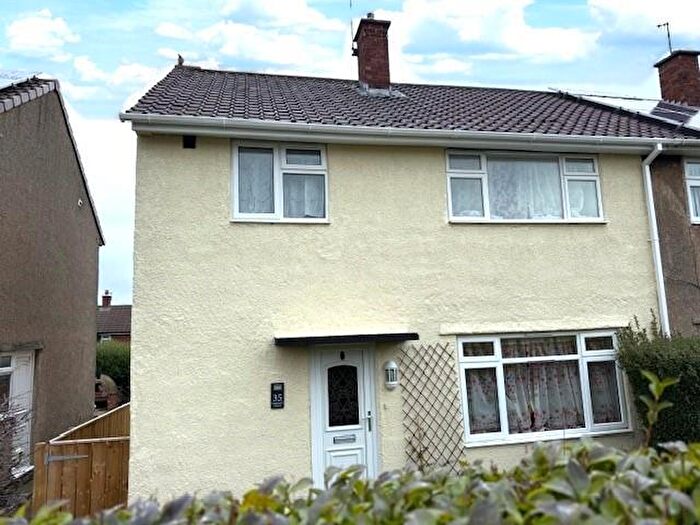

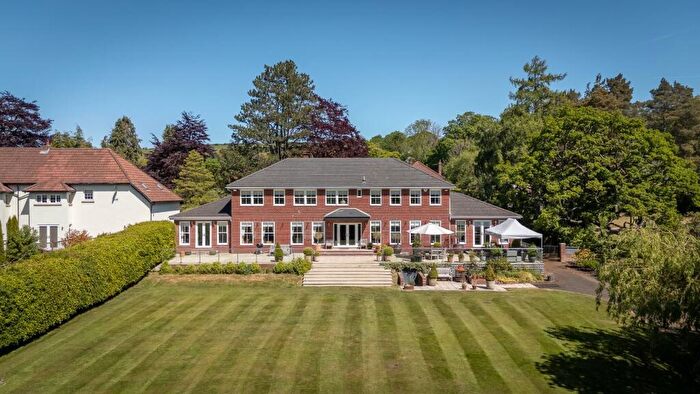
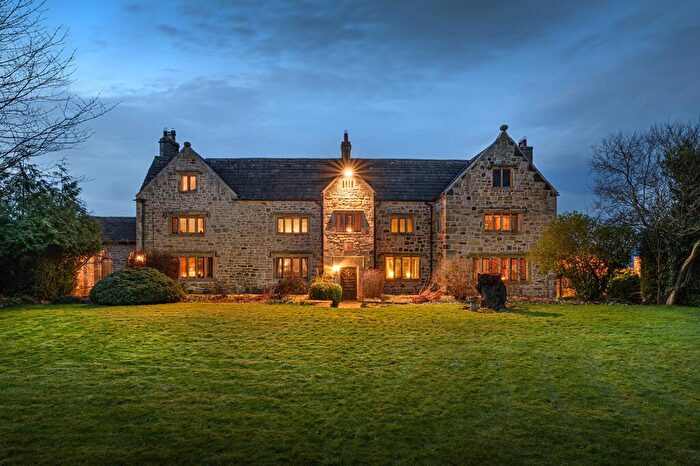
![]()
If you are looking to sell your house, let it out, or receive a property valuation, an expert can help you.
Click the button below to get started.


Roads and Postcodes in Ponteland West
Navigate through our locations to find the location of your next house in Ponteland West, Newcastle Upon Tyne for sale or to rent.
Transport near Ponteland West
-
 Prudhoe Station
 -
Wylam Station
-
Stocksfield Station
-
Riding Mill Station
-
Corbridge Station
-
Blaydon Station
-
Hexham Station
- FAQ
- Price Paid By Year
- Property Type Price
Frequently asked questions about Ponteland West
What is the average price for a property for sale in Ponteland West?
The average price for a property for sale in Ponteland West is £622,934. This amount is 23% higher than the average price in Newcastle Upon Tyne. There are 3,239 property listings for sale in Ponteland West.
What streets have the most expensive properties for sale in Ponteland West?
The streets with the most expensive properties for sale in Ponteland West are North Carol Wood at an average of £1,250,000, Darras Road at an average of £1,193,333 and Western Way at an average of £943,238.
What streets have the most affordable properties for sale in Ponteland West?
The streets with the most affordable properties for sale in Ponteland West are Darras Mews at an average of £143,333, The Oval at an average of £182,000 and Widdrington Drive at an average of £223,166.
Which train stations are available in or near Ponteland West?
Some of the train stations available in or near Ponteland West are Prudhoe, Wylam and Stocksfield.
Property Price Paid in Ponteland West by Year
The average sold property price by year was:
| Year | Average Sold Price | Price Change |
Sold Properties
|
|---|---|---|---|
| 2025 | £610,923 | -3% |
39 Properties |
| 2024 | £626,582 | 11% |
82 Properties |
| 2023 | £557,995 | -22% |
45 Properties |
| 2022 | £678,139 | 17% |
56 Properties |
| 2021 | £563,841 | 9% |
92 Properties |
| 2020 | £511,829 | 10% |
87 Properties |
| 2019 | £461,100 | -6% |
74 Properties |
| 2018 | £490,053 | 4% |
65 Properties |
| 2017 | £470,606 | -3% |
61 Properties |
| 2016 | £484,735 | 10% |
66 Properties |
| 2015 | £434,720 | 9% |
79 Properties |
| 2014 | £394,085 | 5% |
58 Properties |
| 2013 | £374,215 | -8% |
55 Properties |
| 2012 | £404,585 | 0,2% |
32 Properties |
| 2011 | £403,612 | -6% |
46 Properties |
| 2010 | £426,408 | 6% |
41 Properties |
| 2009 | £402,586 | -20% |
23 Properties |
| 2008 | £481,397 | -2% |
42 Properties |
| 2007 | £490,084 | 8% |
70 Properties |
| 2006 | £452,035 | 16% |
64 Properties |
| 2005 | £377,458 | -1% |
56 Properties |
| 2004 | £382,210 | 14% |
58 Properties |
| 2003 | £329,298 | 21% |
74 Properties |
| 2002 | £258,891 | 14% |
85 Properties |
| 2001 | £221,389 | 17% |
76 Properties |
| 2000 | £183,188 | 3% |
80 Properties |
| 1999 | £178,387 | 0,2% |
87 Properties |
| 1998 | £178,053 | 21% |
51 Properties |
| 1997 | £140,716 | -2% |
75 Properties |
| 1996 | £143,599 | 12% |
76 Properties |
| 1995 | £127,023 | - |
61 Properties |
Property Price per Property Type in Ponteland West
Here you can find historic sold price data in order to help with your property search.
The average Property Paid Price for specific property types in the last three years are:
| Property Type | Average Sold Price | Sold Properties |
|---|---|---|
| Flat | £145,714.00 | 7 Flats |
| Semi Detached House | £423,583.00 | 18 Semi Detached Houses |
| Detached House | £689,527.00 | 178 Detached Houses |
| Terraced House | £363,736.00 | 19 Terraced Houses |