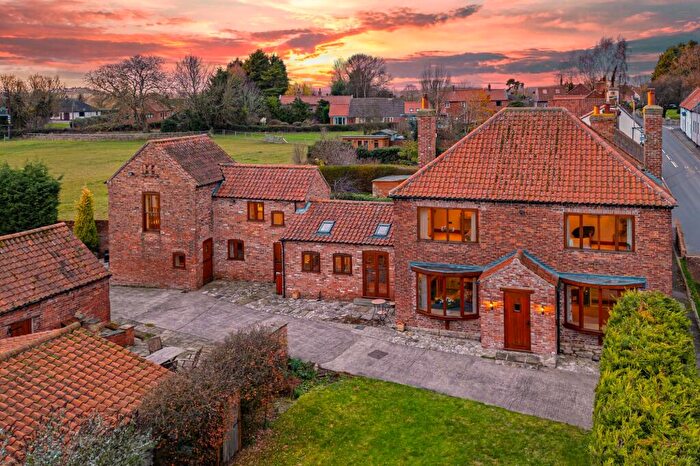
Houses for sale & to rent in Everton, Doncaster
House Prices in Everton
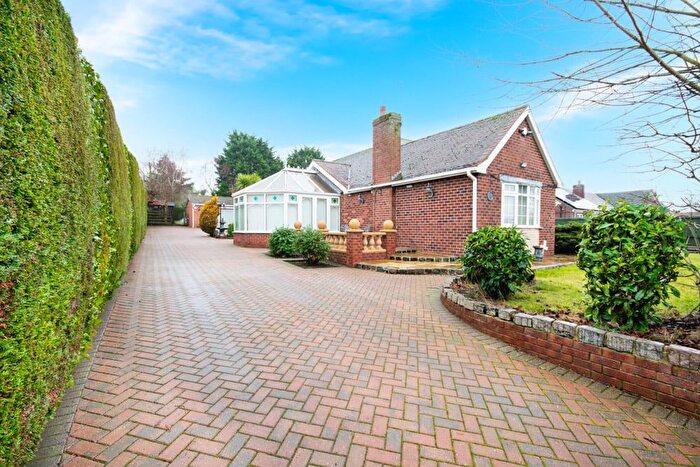
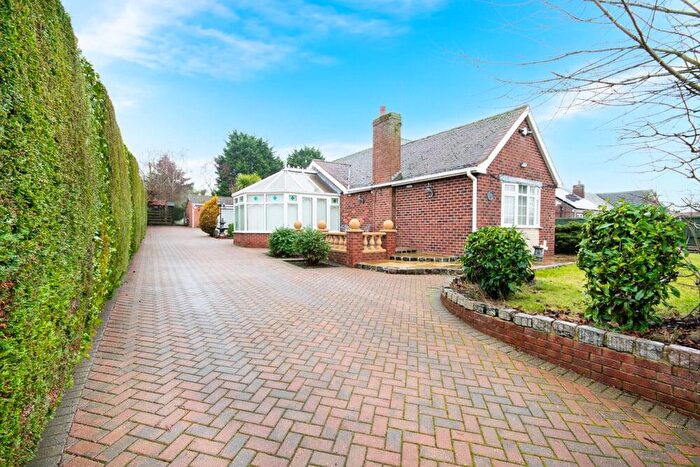
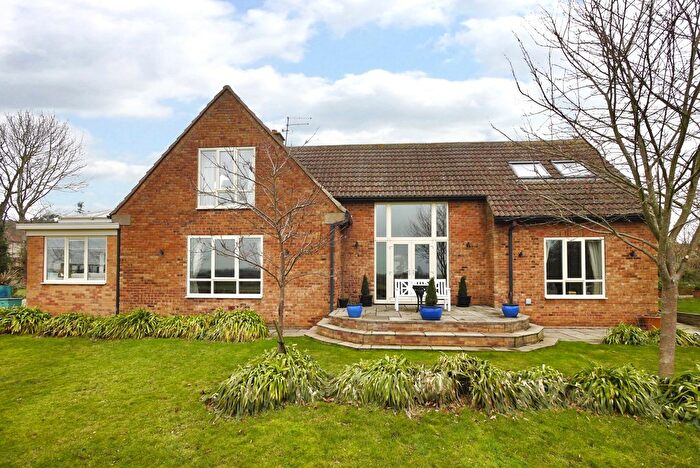
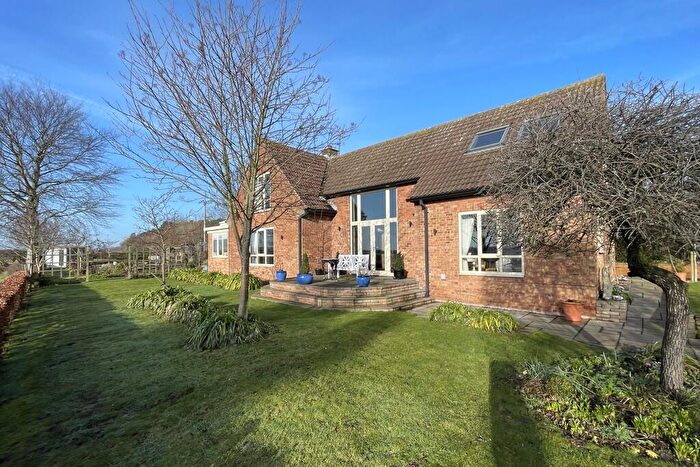
Properties in Everton have an average house price of £353,524.00 and had 102 Property Transactions within the last 3 years¹.
Everton is an area in Doncaster, Nottinghamshire with 947 households², where the most expensive property was sold for £785,000.00.
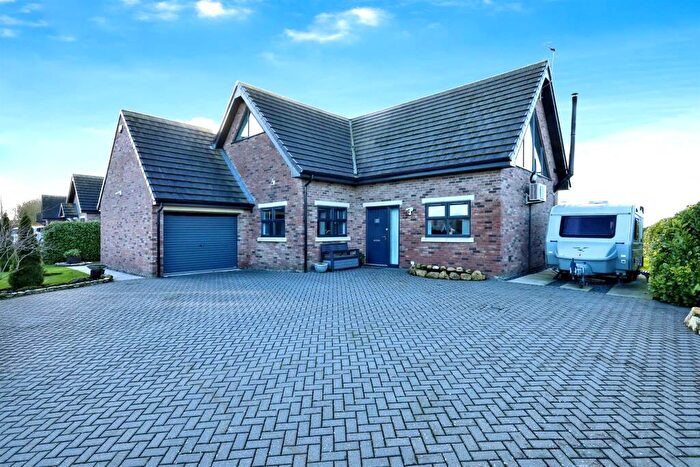
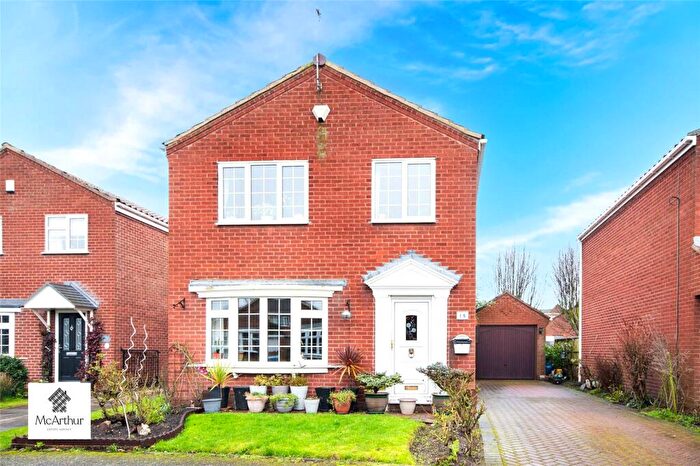
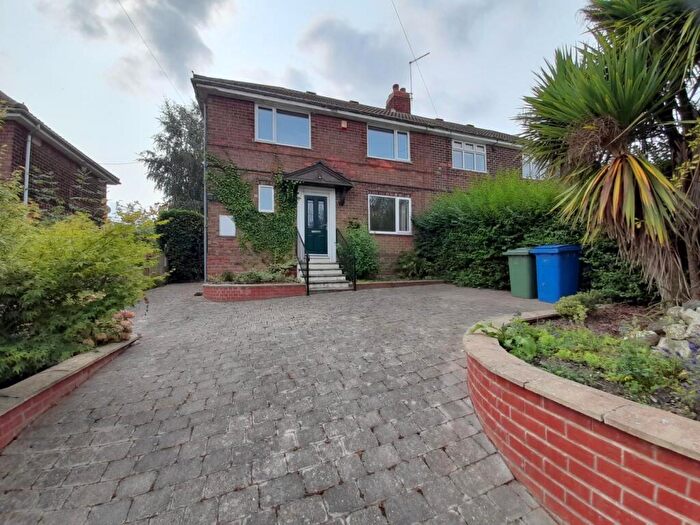
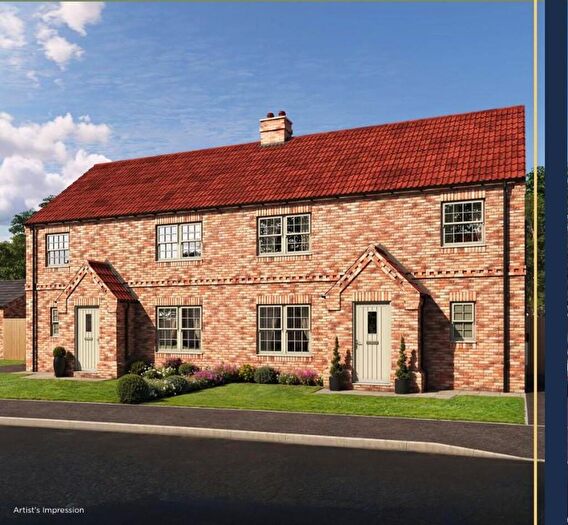
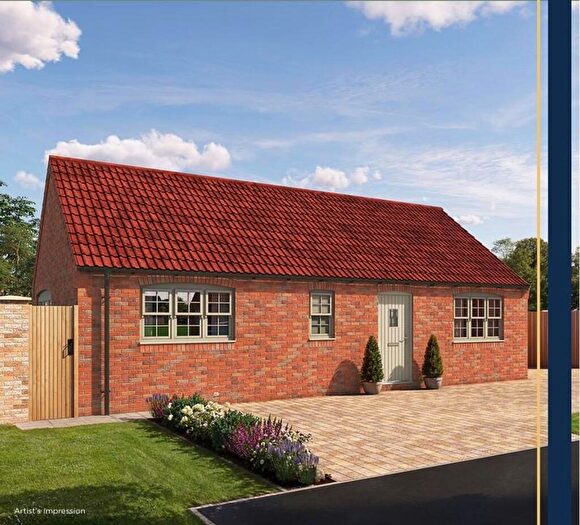
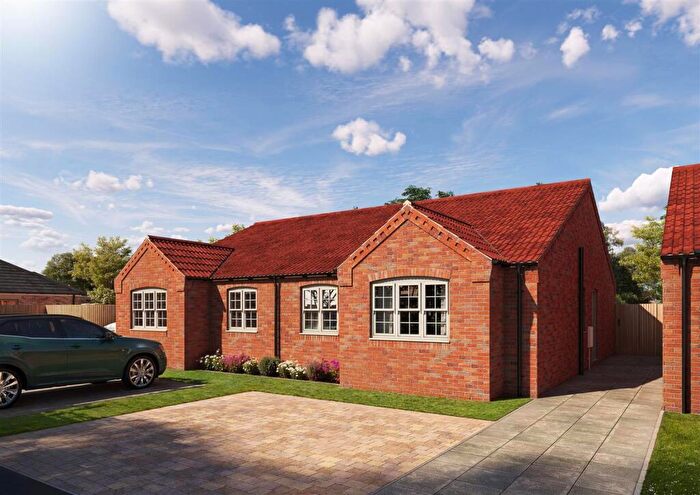
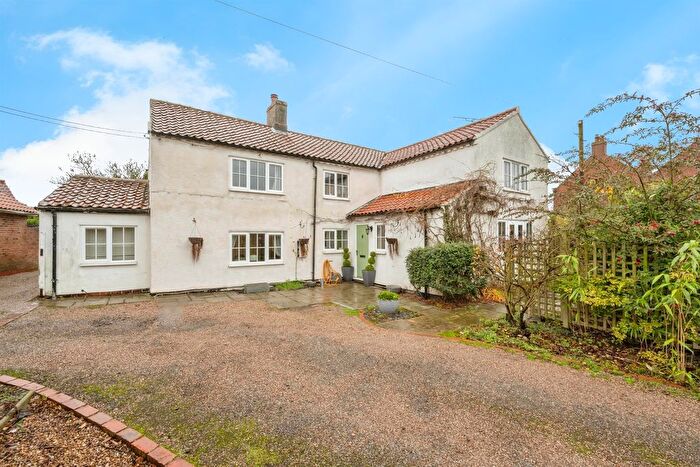
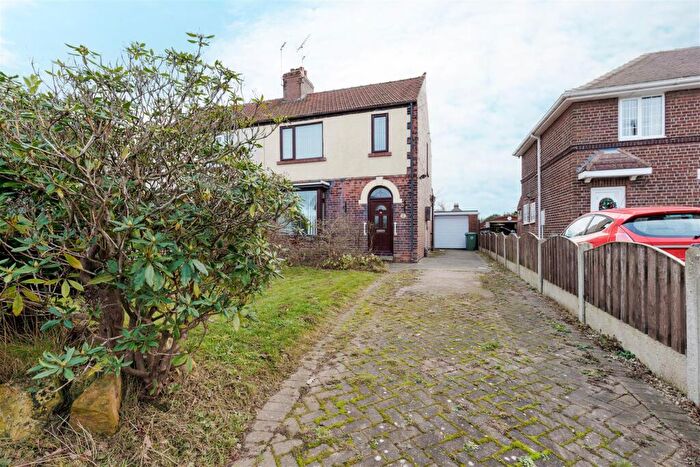
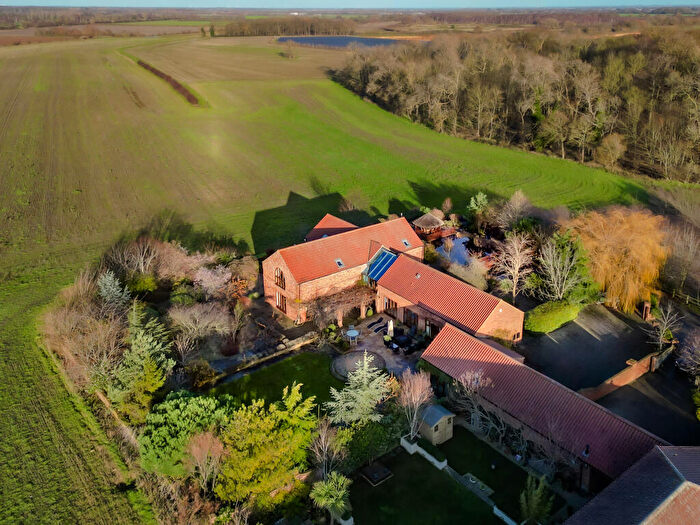
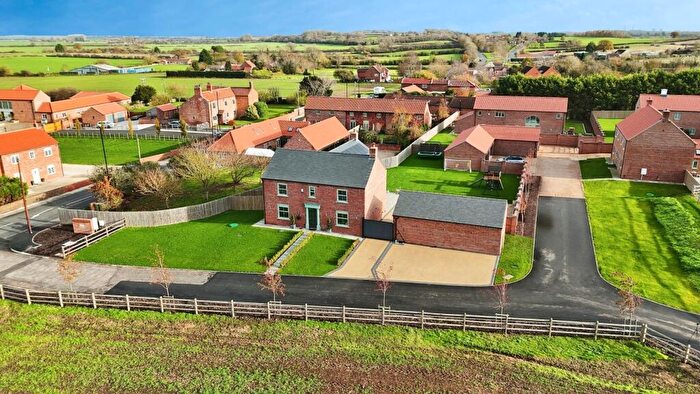
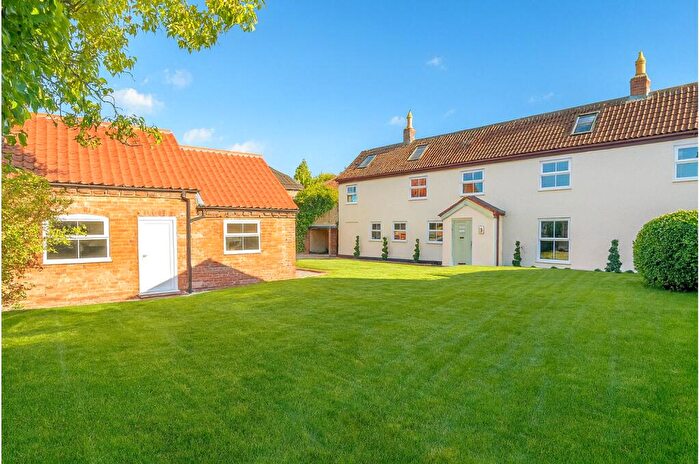
Properties for sale in Everton
Roads and Postcodes in Everton
Navigate through our locations to find the location of your next house in Everton, Doncaster for sale or to rent.
| Streets | Postcodes |
|---|---|
| Ashfield Court | DN10 5ES |
| Back Lane | DN10 6DT |
| Baker Avenue | DN10 4FQ |
| Bawtry Road | DN10 5BP DN10 5BS DN10 5BT DN10 6DL DN10 6DP DN10 6DW |
| Beacon Hill Road | DN10 4RQ |
| Beacon Walk | DN10 4TD |
| Beech Close | DN10 4SP |
| Bracken Hill Lane | DN10 6EP DN10 6FA |
| Brewery Lane | DN10 5BG |
| Brindley Close | DN10 4SJ |
| Carr Road | DN10 4SB DN10 4SL DN10 4SN |
| Carr View | DN10 5AT |
| Chapel Lane | DN10 5BH DN10 5BJ |
| Church Street | DN10 5BB DN10 5BD DN10 6EF DN10 6EQ DN10 5BQ |
| Clayworth Road | DN10 4QR |
| Corner Farm Drive | DN10 5AN |
| Coronation Avenue | DN10 6DN |
| Croft Farm Close | DN10 5DJ |
| Croft Way | DN10 5DL |
| Cross Hill | DN10 4RD DN10 4RE |
| Dame Lane | DN10 6EB |
| Eel Pool Road | DN10 5DH |
| Everton Sluice Lane | DN10 5AW DN10 5AX DN10 5AY |
| Ferry Lane | DN10 5AP |
| Finkell Street | DN10 4SF |
| Gainsborough Road | DN10 4RJ DN10 5BW |
| Gibdyke | DN10 6EL |
| Green Road | DN10 4RN |
| Gringley View | DN10 5EQ |
| Halls Road | DN10 4SQ |
| High Street | DN10 4QP DN10 4RF DN10 4RG DN10 4RH DN10 5AR DN10 5AU DN10 6ED DN10 4RT DN10 5AS |
| Horsewells Street | DN10 4RX |
| Hunters Drive | DN10 4QX |
| Jubilee Close | DN10 6HF |
| Lancaster Road | DN10 4RL |
| Laycock Avenue | DN10 4SA |
| Leys Lane | DN10 4QU DN10 4RS |
| Little Lane | DN10 4RY |
| Long Meadows | DN10 5BL |
| Low Street | DN10 4RZ |
| Manor Close | DN10 6HE |
| Mattersey Road | DN10 5BN DN10 5DP |
| Metcalfe Court | DN10 5AH |
| Middle Bridge Road | DN10 4SD DN10 4SE |
| Middle Street | DN10 6EA |
| Mill Hill | DN10 4RU |
| Mill Lane | DN10 5DG |
| Mill Road | DN10 4QT DN10 4RA |
| Misson Springs | DN10 6ET DN10 6ER |
| Mulberry Court | DN10 6BH |
| Newington Road | DN10 6FD |
| Norwith Hill | DN10 6BU |
| Old Gainsborough Road | DN10 5DE DN10 5DF |
| Old Post Office Street | DN10 5BE |
| Park Drain | DN9 2EP DN9 2EN |
| Pine Close | DN10 5DQ |
| Pitt Lane | DN10 4SG |
| Pusto Hill Lane | DN10 5DB |
| River Lane | DN10 6EJ |
| River View | DN10 6EE |
| Roe Lane | DN10 5AZ |
| Shaw Lock | DN10 4SH |
| Slaynes Lane | DN10 6DY |
| Springs Road | DN10 6ES |
| Station Road | DN10 6EW |
| Stone Hill | DN10 6BN |
| Sunnybank Gardens | DN10 4SS |
| The Crew Yard | DN10 5AL |
| The Green | DN10 6DR DN10 6DS DN10 6DU |
| The Willows | DN10 5JF |
| Top Street | DN10 6EN DN10 6DZ |
| Vicar Lane | DN10 6EG |
| Walkeringham Road | DN10 4ND |
| Wesleyan Court | DN10 5DN |
| West Street | DN10 6DX |
| West Wells Lane | DN10 4QY |
| Westwell Lane | DN10 4RB |
| Westwoodside | DN9 2ER |
| Windsor Close | DN10 4RW |
| Windyridge | DN10 5BA |
| DN10 5BU DN10 5BX DN10 5DA DN10 6DJ DN10 4NA DN10 5BY DN10 5BZ DN10 5DD DN10 5DR DN10 6BJ DN10 6BL |
Transport near Everton
- FAQ
- Price Paid By Year
- Property Type Price
Frequently asked questions about Everton
What is the average price for a property for sale in Everton?
The average price for a property for sale in Everton is £353,524. This amount is 60% higher than the average price in Doncaster. There are 566 property listings for sale in Everton.
What streets have the most expensive properties for sale in Everton?
The streets with the most expensive properties for sale in Everton are Church Street at an average of £675,000, The Willows at an average of £600,000 and Mattersey Road at an average of £598,333.
What streets have the most affordable properties for sale in Everton?
The streets with the most affordable properties for sale in Everton are The Green at an average of £115,000, Coronation Avenue at an average of £159,642 and West Wells Lane at an average of £176,500.
Which train stations are available in or near Everton?
Some of the train stations available in or near Everton are Gainsborough Central, Retford and Gainsborough Lea Road.
Property Price Paid in Everton by Year
The average sold property price by year was:
| Year | Average Sold Price | Price Change |
Sold Properties
|
|---|---|---|---|
| 2025 | £415,180 | 19% |
25 Properties |
| 2024 | £336,787 | 2% |
40 Properties |
| 2023 | £329,958 | -5% |
37 Properties |
| 2022 | £347,311 | -1% |
34 Properties |
| 2021 | £351,859 | -1% |
54 Properties |
| 2020 | £355,570 | 9% |
39 Properties |
| 2019 | £322,062 | 4% |
44 Properties |
| 2018 | £309,178 | 19% |
33 Properties |
| 2017 | £250,906 | -8% |
43 Properties |
| 2016 | £271,827 | 6% |
59 Properties |
| 2015 | £255,374 | 8% |
59 Properties |
| 2014 | £236,019 | 4% |
46 Properties |
| 2013 | £226,310 | 9% |
32 Properties |
| 2012 | £206,092 | -16% |
27 Properties |
| 2011 | £238,096 | -5% |
26 Properties |
| 2010 | £250,500 | 15% |
17 Properties |
| 2009 | £211,970 | -14% |
17 Properties |
| 2008 | £242,440 | -10% |
21 Properties |
| 2007 | £266,425 | -2% |
44 Properties |
| 2006 | £270,971 | 16% |
45 Properties |
| 2005 | £226,862 | 21% |
35 Properties |
| 2004 | £178,095 | -15% |
31 Properties |
| 2003 | £204,645 | 23% |
47 Properties |
| 2002 | £156,671 | 30% |
49 Properties |
| 2001 | £109,495 | -0,4% |
40 Properties |
| 2000 | £109,938 | 16% |
43 Properties |
| 1999 | £91,827 | 10% |
49 Properties |
| 1998 | £83,026 | 8% |
36 Properties |
| 1997 | £76,299 | 8% |
35 Properties |
| 1996 | £70,350 | -27% |
24 Properties |
| 1995 | £89,638 | - |
21 Properties |
Property Price per Property Type in Everton
Here you can find historic sold price data in order to help with your property search.
The average Property Paid Price for specific property types in the last three years are:
| Property Type | Average Sold Price | Sold Properties |
|---|---|---|
| Semi Detached House | £229,260.00 | 25 Semi Detached Houses |
| Detached House | £435,984.00 | 65 Detached Houses |
| Terraced House | £165,745.00 | 12 Terraced Houses |

