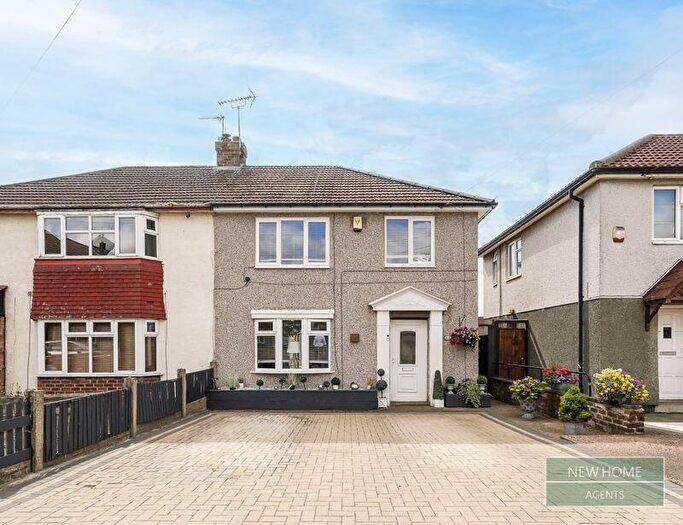
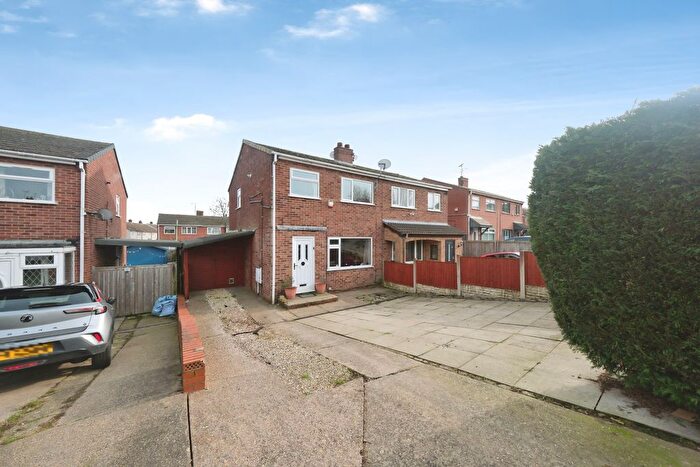
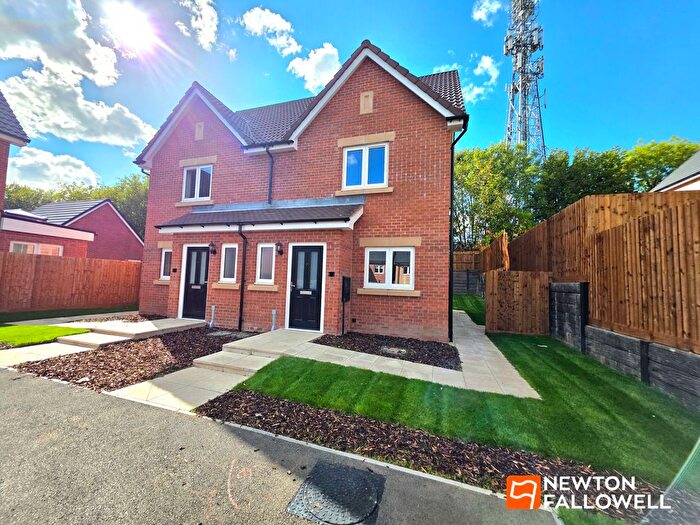
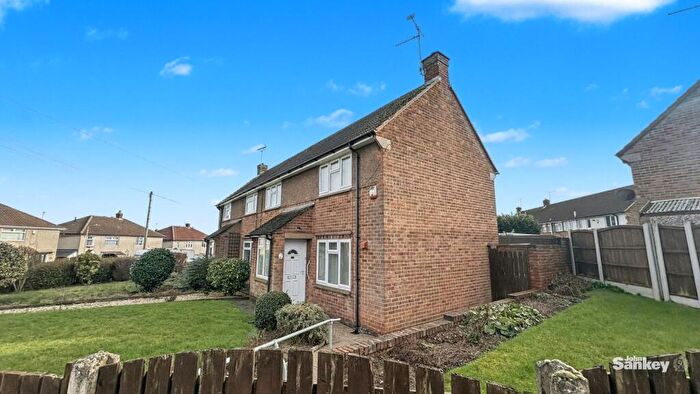
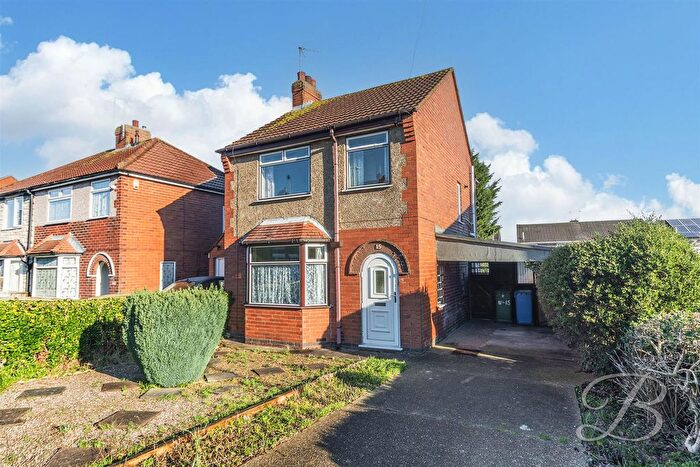
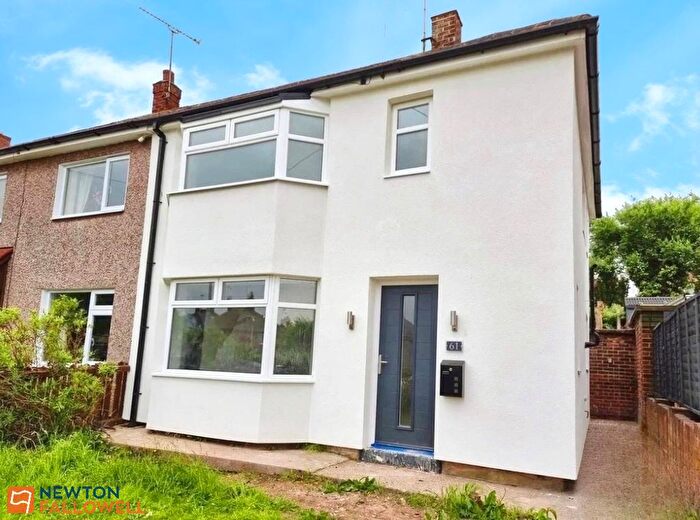
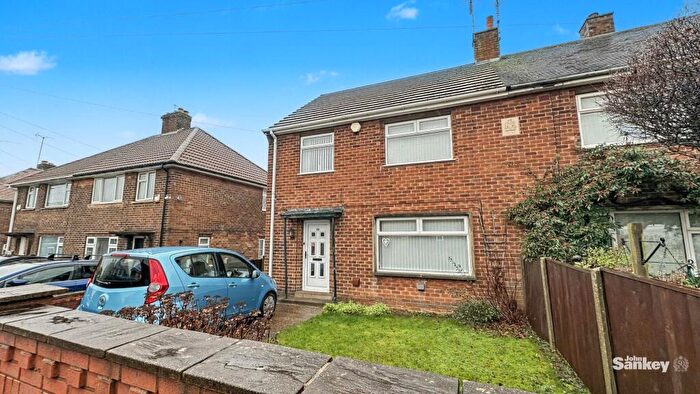
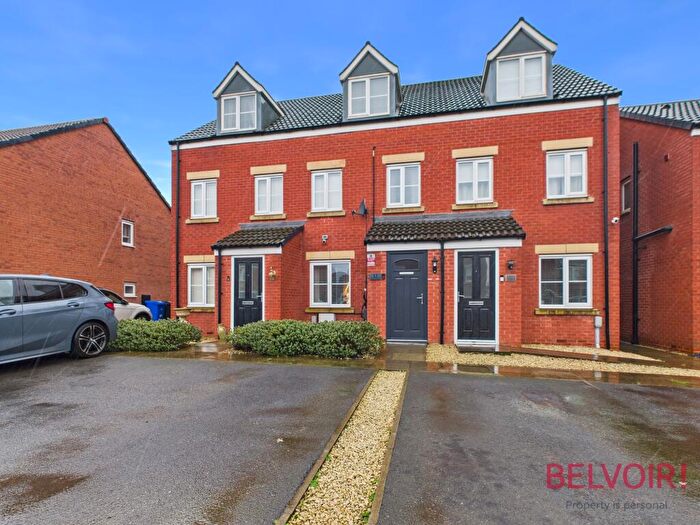
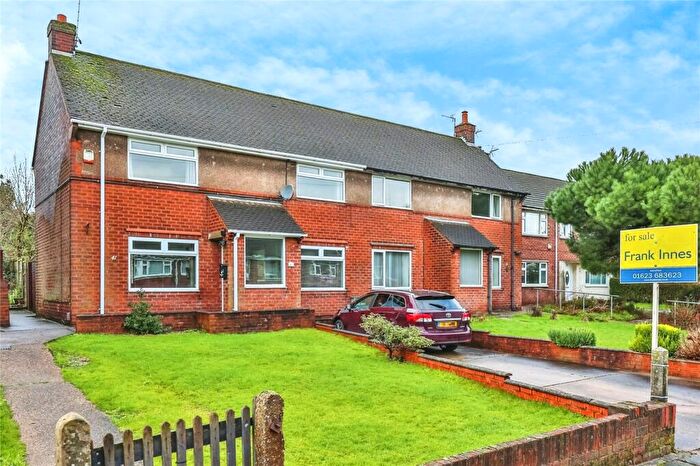
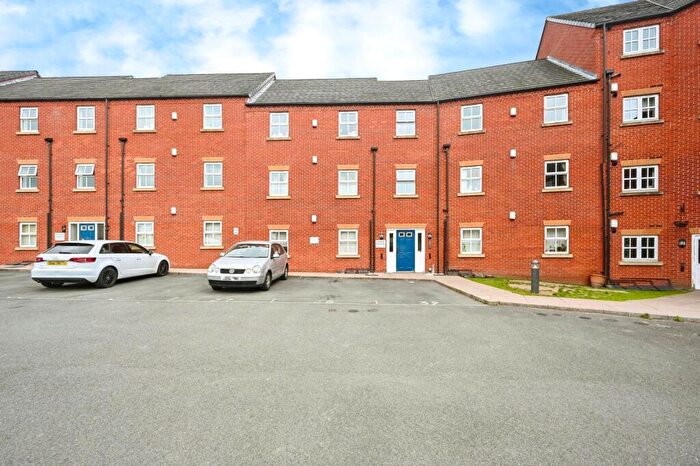
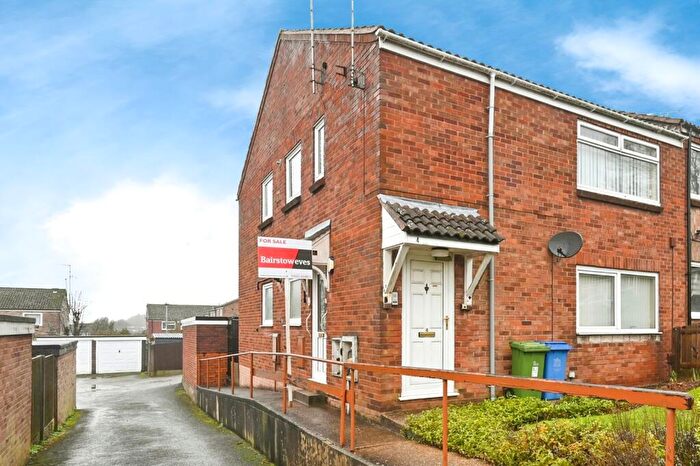
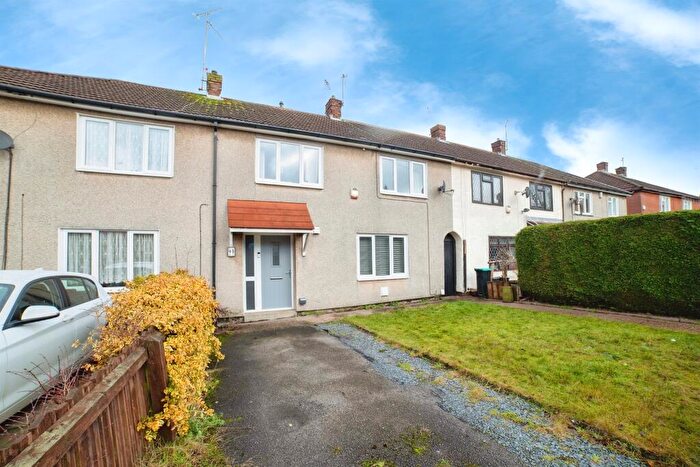
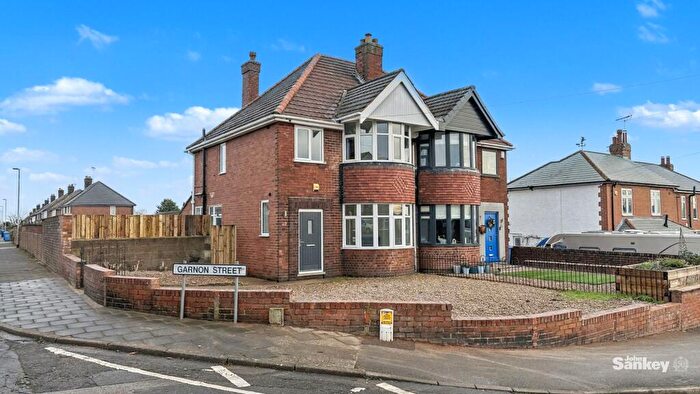
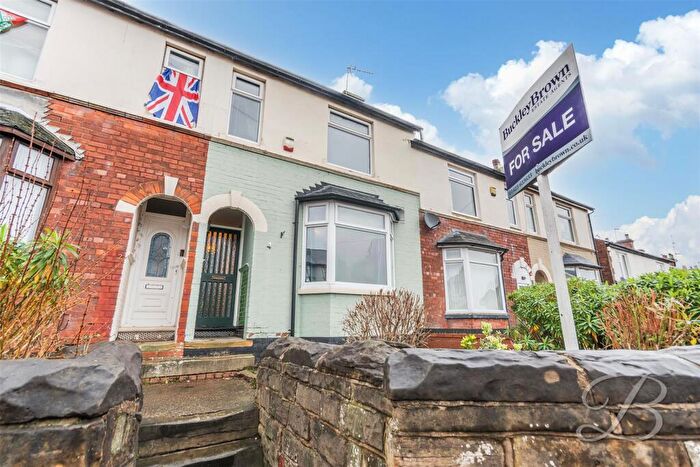
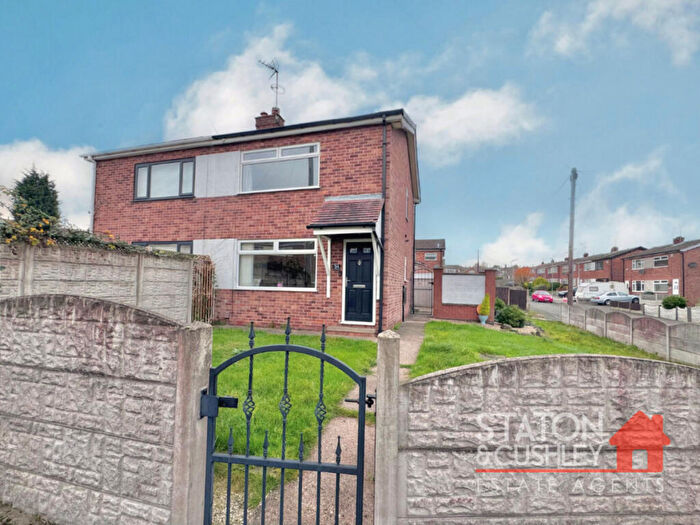
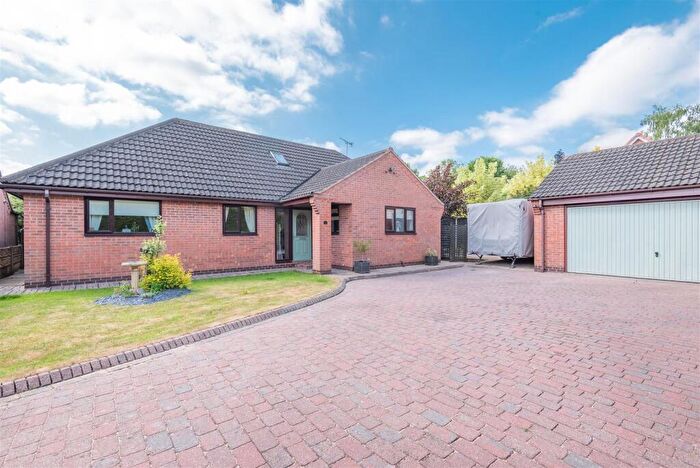
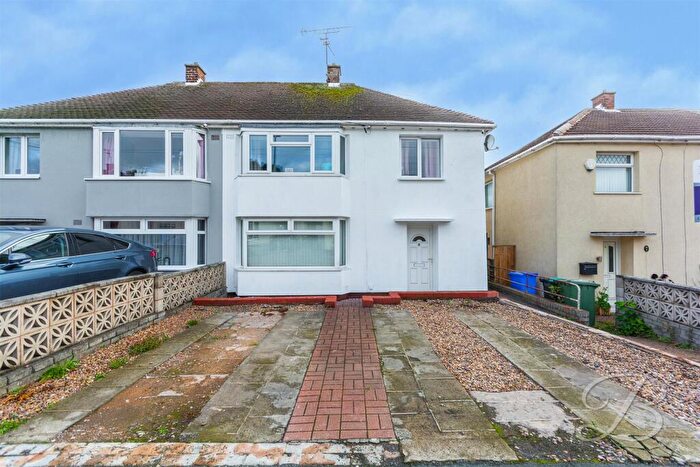
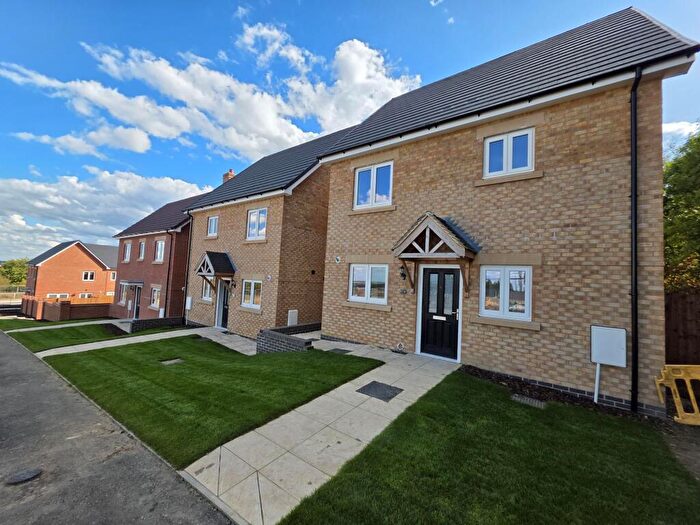
Houses for sale & to rent in Brick Kiln, Mansfield
House Prices in Brick Kiln
Properties in Brick Kiln have an average house price of £158,310.00 and had 128 Property Transactions within the last 3 years¹.
Brick Kiln is an area in Mansfield, Nottinghamshire with 1,346 households², where the most expensive property was sold for £490,000.00.
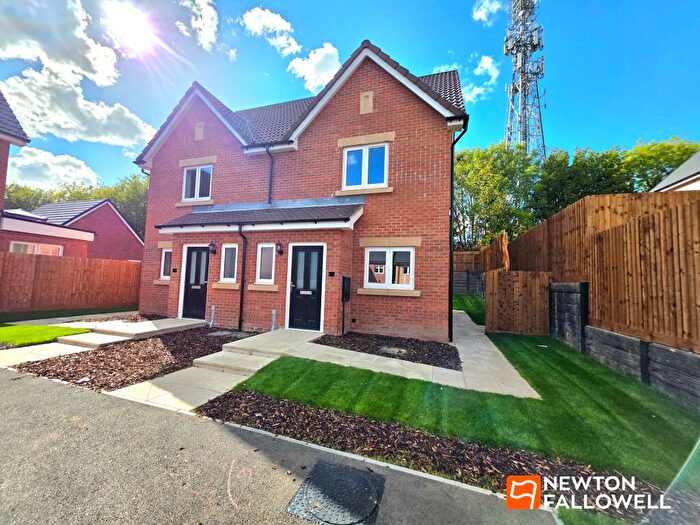
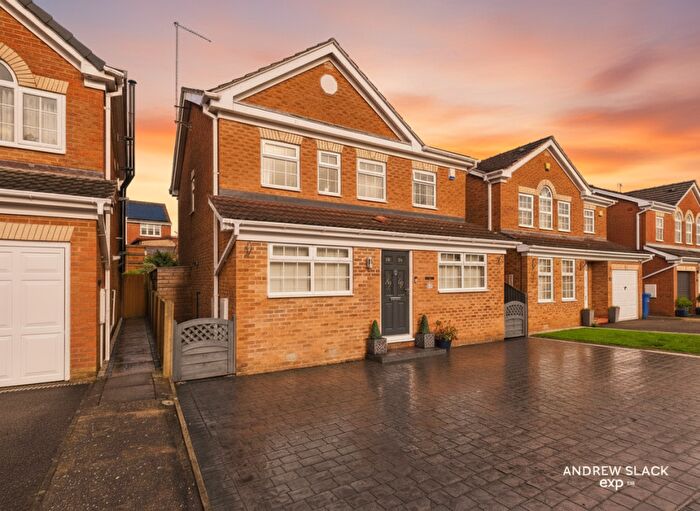
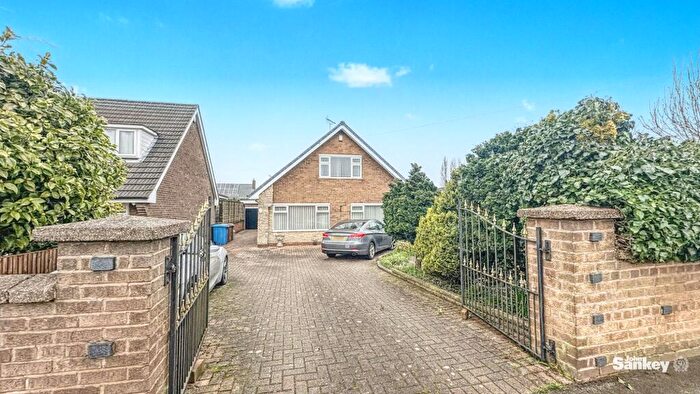
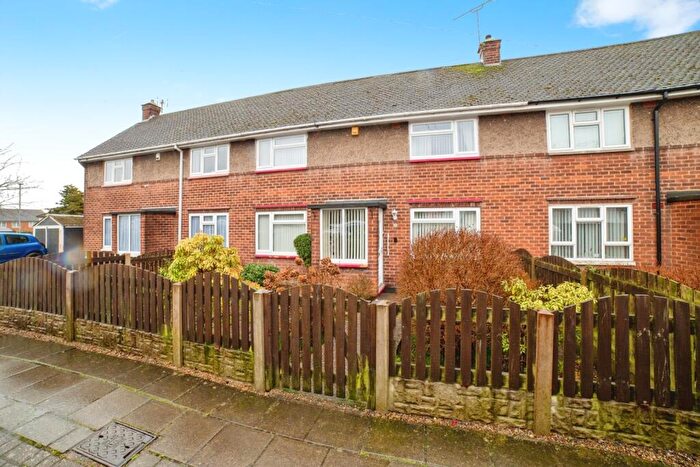
Properties for sale in Brick Kiln
Roads and Postcodes in Brick Kiln
Navigate through our locations to find the location of your next house in Brick Kiln, Mansfield for sale or to rent.
| Streets | Postcodes |
|---|---|
| Abbott Road | NG19 6LX |
| Andover Road | NG19 6TZ |
| Annesley Way | NG19 6PY |
| Averham Close | NG19 6PS |
| Bonington Road | NG19 6QH NG19 6QQ |
| Brick Kiln Lane | NG18 5JT NG18 5JU NG18 5JX NG18 5JY NG18 5JZ NG18 5LA NG19 6LH NG19 6LN NG19 6LU |
| Brockenhurst Road | NG19 6TX |
| Brook Court | NG19 6LF |
| Cherry Grove | NG18 5RQ |
| Chichester Close | NG19 6UE |
| Cottam Grove | NG19 6PT |
| Cranborne Close | NG19 6UB |
| Darlton Street | NG19 6PX NG19 6PU |
| Garnon Street | NG18 5QT |
| Goodhand Crescent | NG18 5RE |
| Harrison Road | NG18 5RG |
| Harworth Close | NG19 6QP |
| Jenford Street | NG18 5QU NG18 5QX NG18 5QY NG18 5QZ |
| Kirton Close | NG19 6LP |
| Ladybrook Lane | NG18 5JR NG19 6PR NG19 6PZ NG19 6QL NG19 6PP |
| Ladybrook Place | NG18 5JP |
| Langford Road | NG19 6QA NG19 6QB NG19 6QD NG19 6QE NG19 6QG |
| Linby Avenue | NG19 6QN |
| Little Robins Court | NG19 6RJ |
| Longstone Way | NG19 6PE |
| Lymington Road | NG19 6TY |
| Merryvale Drive | NG19 6LG |
| Petersfield Close | NG19 6UA |
| Rhodes Walk | NG18 5RD |
| Romsey Place | NG19 6UD |
| Shelford Hill | NG19 6QF |
| The Knoll | NG18 5RA NG18 5RB |
| Ward Place | NG18 5RF |
| Winborne Close | NG19 6TU |
| Winthorpe Street | NG19 6LW NG19 6QW |
Transport near Brick Kiln
- FAQ
- Price Paid By Year
- Property Type Price
Frequently asked questions about Brick Kiln
What is the average price for a property for sale in Brick Kiln?
The average price for a property for sale in Brick Kiln is £158,310. This amount is 19% lower than the average price in Mansfield. There are 834 property listings for sale in Brick Kiln.
What streets have the most expensive properties for sale in Brick Kiln?
The streets with the most expensive properties for sale in Brick Kiln are Romsey Place at an average of £211,000, Petersfield Close at an average of £187,333 and Brick Kiln Lane at an average of £182,972.
What streets have the most affordable properties for sale in Brick Kiln?
The streets with the most affordable properties for sale in Brick Kiln are Longstone Way at an average of £81,000, Goodhand Crescent at an average of £116,400 and Ladybrook Lane at an average of £123,928.
Which train stations are available in or near Brick Kiln?
Some of the train stations available in or near Brick Kiln are Mansfield Town, Mansfield Woodhouse and Sutton Parkway.
Property Price Paid in Brick Kiln by Year
The average sold property price by year was:
| Year | Average Sold Price | Price Change |
Sold Properties
|
|---|---|---|---|
| 2025 | £168,136 | 9% |
38 Properties |
| 2024 | £153,387 | -1% |
49 Properties |
| 2023 | £155,087 | -7% |
41 Properties |
| 2022 | £165,392 | 16% |
50 Properties |
| 2021 | £139,281 | 9% |
41 Properties |
| 2020 | £126,154 | 11% |
45 Properties |
| 2019 | £112,817 | -1% |
39 Properties |
| 2018 | £113,870 | 8% |
39 Properties |
| 2017 | £104,826 | 6% |
41 Properties |
| 2016 | £98,778 | -4% |
40 Properties |
| 2015 | £102,347 | 11% |
35 Properties |
| 2014 | £90,580 | 3% |
34 Properties |
| 2013 | £88,010 | 2% |
36 Properties |
| 2012 | £86,475 | 1% |
28 Properties |
| 2011 | £85,700 | 2% |
22 Properties |
| 2010 | £83,795 | -6% |
22 Properties |
| 2009 | £89,051 | -15% |
26 Properties |
| 2008 | £102,446 | 4% |
32 Properties |
| 2007 | £98,246 | 0,3% |
61 Properties |
| 2006 | £97,970 | 13% |
64 Properties |
| 2005 | £85,413 | 1% |
51 Properties |
| 2004 | £84,724 | 17% |
54 Properties |
| 2003 | £70,335 | 19% |
66 Properties |
| 2002 | £56,903 | 27% |
75 Properties |
| 2001 | £41,667 | 8% |
69 Properties |
| 2000 | £38,230 | -6% |
66 Properties |
| 1999 | £40,664 | 10% |
47 Properties |
| 1998 | £36,414 | 2% |
59 Properties |
| 1997 | £35,857 | 1% |
38 Properties |
| 1996 | £35,525 | 2% |
34 Properties |
| 1995 | £34,644 | - |
41 Properties |
Property Price per Property Type in Brick Kiln
Here you can find historic sold price data in order to help with your property search.
The average Property Paid Price for specific property types in the last three years are:
| Property Type | Average Sold Price | Sold Properties |
|---|---|---|
| Semi Detached House | £155,468.00 | 103 Semi Detached Houses |
| Detached House | £293,750.00 | 6 Detached Houses |
| Terraced House | £145,285.00 | 14 Terraced Houses |
| Flat | £90,800.00 | 5 Flats |

