
Houses for sale & to rent in Grange Farm, Mansfield
House Prices in Grange Farm
Properties in Grange Farm have an average house price of £209k and had 133 Property Transactions within the last 3 years¹.
Grange Farm is an area in Mansfield, Nottinghamshire with 1,282 households², where the most expensive property was sold for £610k.
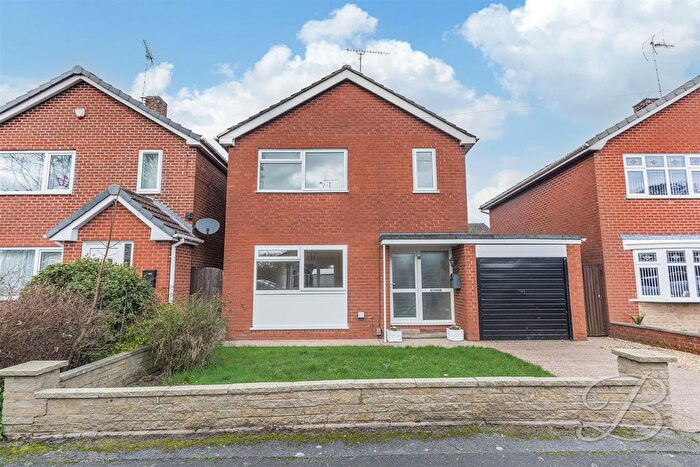
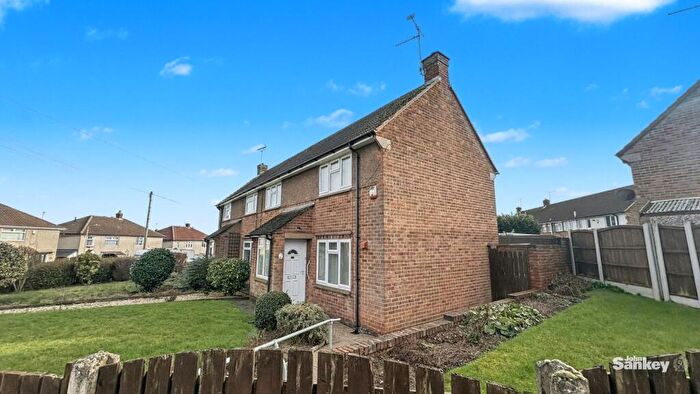
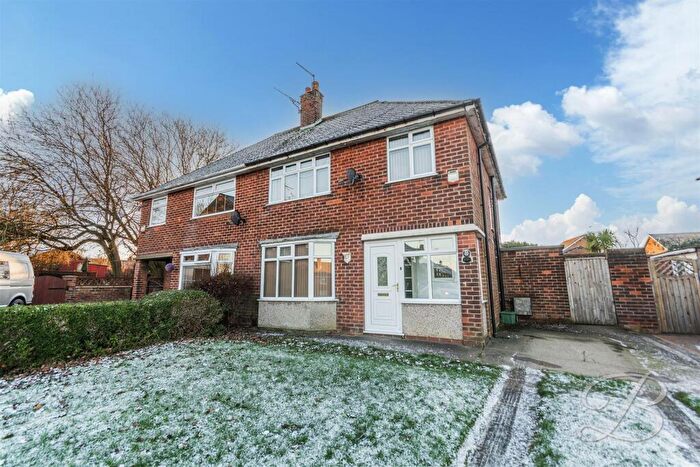
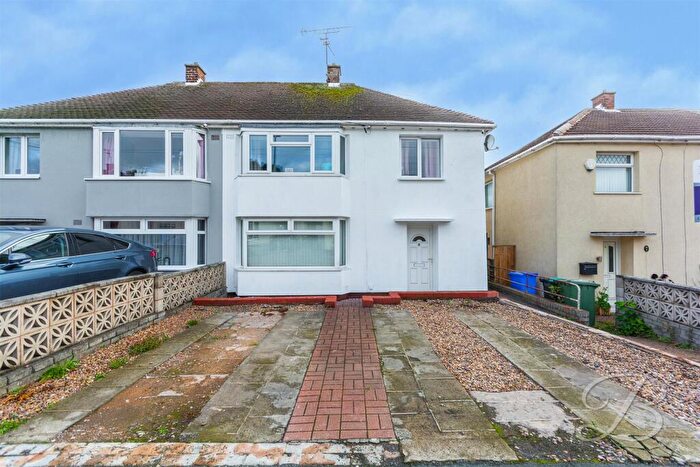
Properties for sale in Grange Farm
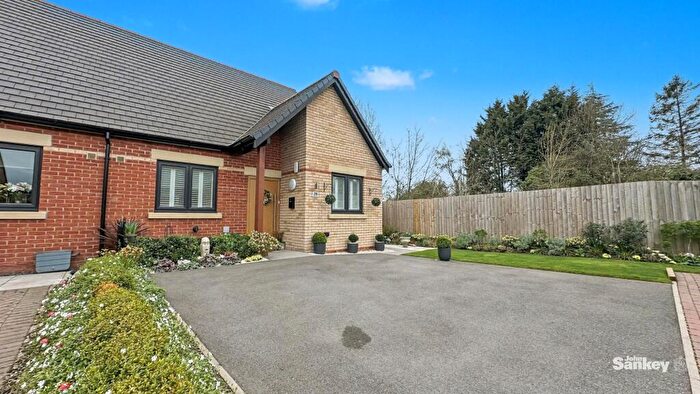
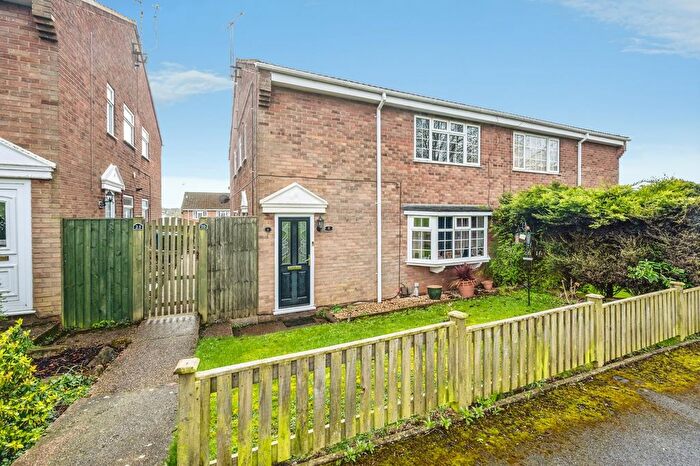
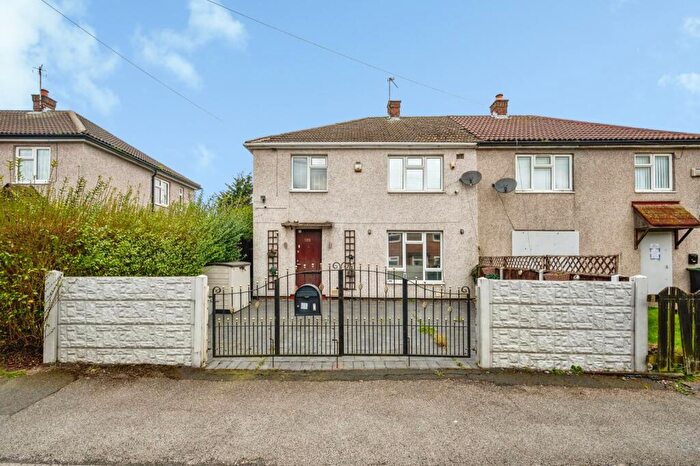
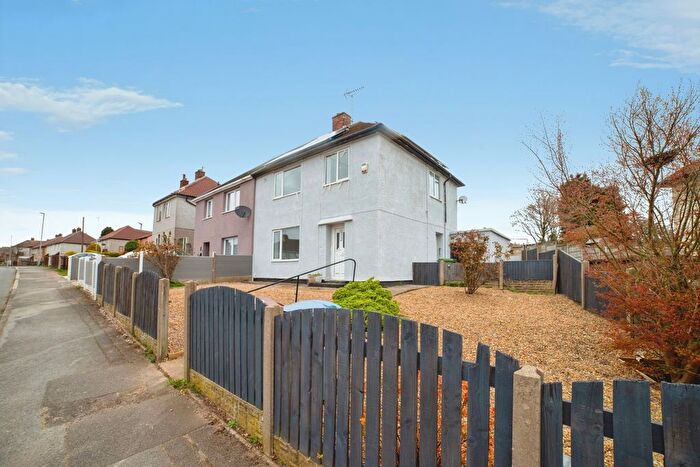
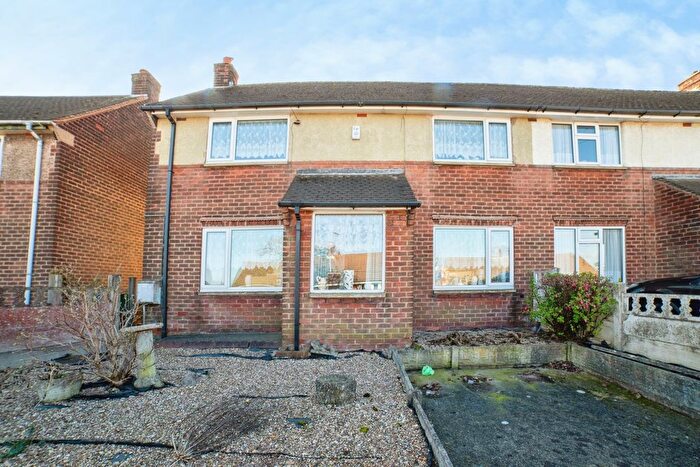
![]()
If you are looking to sell your house, let it out, or receive a property valuation, an expert can help you.
Click the button below to get started.


Roads and Postcodes in Grange Farm
Navigate through our locations to find the location of your next house in Grange Farm, Mansfield for sale or to rent.
| Streets | Postcodes |
|---|---|
| Alder Court | NG17 4NZ NG17 4PJ NG17 4PL |
| Appin Road | NG19 6RN |
| Arran Square | NG19 6RP |
| Bathwood Drive | NG18 5HJ |
| Beauly Drive | NG19 6RU |
| Botany Avenue | NG18 5QN |
| Caunton Close | NG18 5QR |
| Century Avenue | NG18 5EE |
| Chirnside | NG19 6TR |
| Craigs Green | NG19 6RG |
| Cromarty Close | NG19 6RT |
| Dunbar Drive | NG19 6TP |
| Dunnett Road | NG19 6RE |
| Dunoon Road | NG19 6RB |
| Fairlie Avenue | NG19 6RH |
| Featherstone Close | NG18 5HU |
| Frank Avenue | NG18 5EL |
| Grange Avenue | NG18 5EY |
| Granton Rise | NG19 6TS |
| Harthill Drive | NG19 6TT |
| Helmsdale Close | NG19 6RF |
| Hermitage Avenue | NG18 5EG |
| Hermitage Lane | NG18 5HA NG18 5HB |
| Huntly Close | NG18 5HP |
| Intake Avenue | NG18 5EJ |
| Jadella Close | NG18 5EQ |
| Kenmore Close | NG19 6RA |
| Kings Lodge Drive | NG18 5GZ |
| Kings Mill Lane | NG18 5HW |
| Kirkland Avenue | NG18 5QP |
| Lamond Close | NG19 6RQ |
| Larkhall Place | NG19 6TW |
| Lismore Court | NG19 6RL |
| Lucknow Drive | NG18 5HN |
| Maple Tree Meadow | NG19 6PL |
| Mill Court | NG18 5GN |
| Millers Way | NG17 4NX |
| Millersdale Avenue | NG18 5HS |
| Moray Square | NG19 6RS |
| Odins Walk | NG18 5FN |
| Pentland Court | NG19 6RR |
| Randol Close | NG18 5HY |
| Rannoch Drive | NG19 6QU NG19 6QX |
| Renfrew Court | NG19 6QY |
| Robert Avenue | NG18 5EN |
| Rona Close | NG19 6RD |
| Seaforth Square | NG19 6RY |
| Sheepbridge Lane | NG18 5DX NG18 5DY NG18 5EA |
| Skegby Lane | NG19 6PF NG19 6PG NG19 6QR NG19 6QS |
| Skegby Mount | NG19 6QT |
| Spindle Court | NG19 6PW |
| Spinners Close | NG19 6QJ |
| St Christophers Road | NG18 5FL |
| Stirling Avenue | NG19 6QZ |
| Sutton Road | NG18 5ET NG18 5EU NG18 5EX NG18 5HH NG18 5HL NG18 5HR NG18 5HT NG18 5HX |
| Sylvester Street | NG18 5QS |
| The Camerons | NG19 6RX |
| The Gillies | NG19 6RZ |
| The Hermitage | NG18 5HG |
| Washington Drive | NG18 5GP |
| Wellcroft Close | NG18 5GS |
| Western Avenue | NG18 5ED |
| Western Close | NG18 5GA |
| Worsbrough Close | NG18 5GR |
Transport near Grange Farm
-
 Mansfield Town Station
 -
Sutton Parkway Station
-
Mansfield Woodhouse Station
-
Kirkby in Ashfield Station
- FAQ
- Price Paid By Year
- Property Type Price
Frequently asked questions about Grange Farm
What is the average price for a property for sale in Grange Farm?
The average price for a property for sale in Grange Farm is £208,745. This amount is 8% higher than the average price in Mansfield. There are 753 property listings for sale in Grange Farm.
What streets have the most expensive properties for sale in Grange Farm?
The streets with the most expensive properties for sale in Grange Farm are The Hermitage at an average of £499,950, Kings Lodge Drive at an average of £453,166 and Mill Court at an average of £290,000.
What streets have the most affordable properties for sale in Grange Farm?
The streets with the most affordable properties for sale in Grange Farm are Chirnside at an average of £100,000, Spindle Court at an average of £122,470 and The Gillies at an average of £140,000.
Which train stations are available in or near Grange Farm?
Some of the train stations available in or near Grange Farm are Mansfield Town, Sutton Parkway and Mansfield Woodhouse.
Property Price Paid in Grange Farm by Year
The average sold property price by year was:
| Year | Average Sold Price | Price Change |
Sold Properties
|
|---|---|---|---|
| 2025 | £213,354 | 14% |
52 Properties |
| 2024 | £183,513 | -22% |
36 Properties |
| 2023 | £223,605 | 4% |
45 Properties |
| 2022 | £214,147 | 12% |
46 Properties |
| 2021 | £189,476 | 6% |
69 Properties |
| 2020 | £178,120 | -17% |
46 Properties |
| 2019 | £207,755 | 13% |
40 Properties |
| 2018 | £180,512 | 11% |
68 Properties |
| 2017 | £160,392 | 6% |
67 Properties |
| 2016 | £151,218 | 6% |
65 Properties |
| 2015 | £142,033 | 6% |
53 Properties |
| 2014 | £133,423 | 2% |
53 Properties |
| 2013 | £130,863 | 9% |
47 Properties |
| 2012 | £119,275 | 6% |
43 Properties |
| 2011 | £111,810 | -19% |
32 Properties |
| 2010 | £133,066 | 5% |
27 Properties |
| 2009 | £125,821 | -9% |
21 Properties |
| 2008 | £137,717 | -4% |
28 Properties |
| 2007 | £142,761 | 4% |
61 Properties |
| 2006 | £137,515 | 1% |
100 Properties |
| 2005 | £136,654 | -3% |
59 Properties |
| 2004 | £141,269 | 20% |
39 Properties |
| 2003 | £112,952 | 31% |
63 Properties |
| 2002 | £78,491 | 16% |
55 Properties |
| 2001 | £66,078 | 7% |
59 Properties |
| 2000 | £61,237 | 4% |
66 Properties |
| 1999 | £58,932 | 6% |
55 Properties |
| 1998 | £55,648 | 13% |
62 Properties |
| 1997 | £48,611 | -10% |
56 Properties |
| 1996 | £53,307 | -8% |
61 Properties |
| 1995 | £57,570 | - |
45 Properties |
Property Price per Property Type in Grange Farm
Here you can find historic sold price data in order to help with your property search.
The average Property Paid Price for specific property types in the last three years are:
| Property Type | Average Sold Price | Sold Properties |
|---|---|---|
| Semi Detached House | £199,433.00 | 34 Semi Detached Houses |
| Detached House | £260,586.00 | 63 Detached Houses |
| Terraced House | £155,769.00 | 13 Terraced Houses |
| Flat | £110,456.00 | 23 Flats |