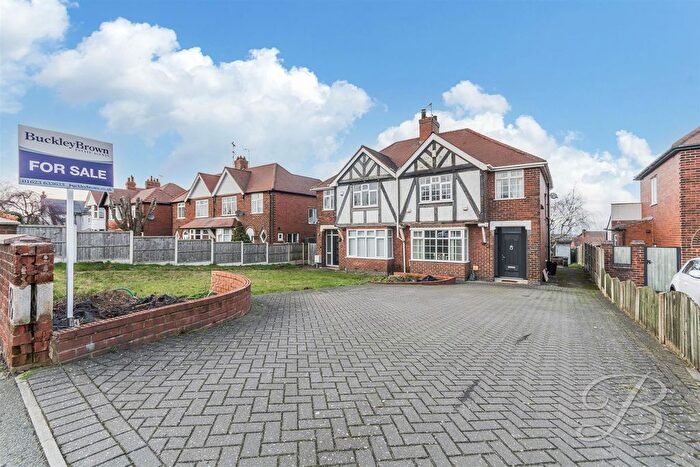
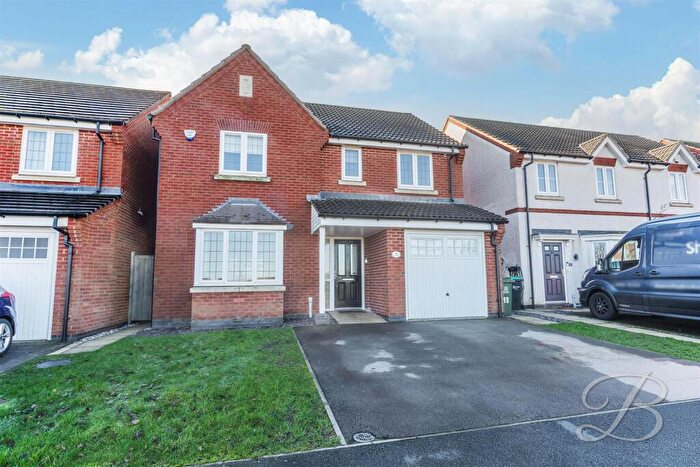
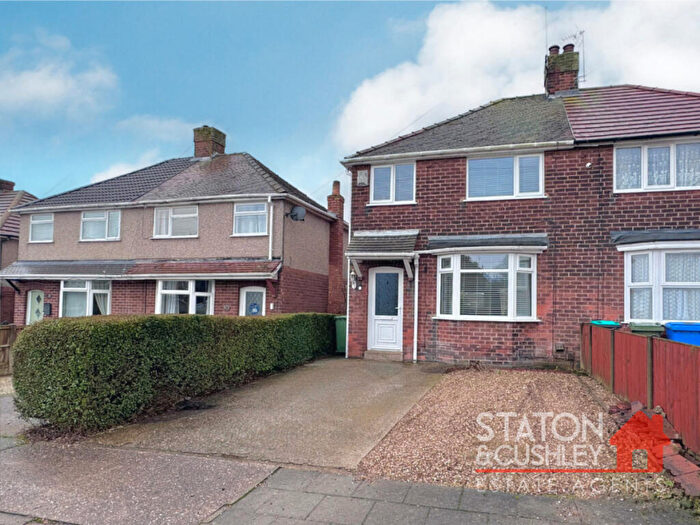
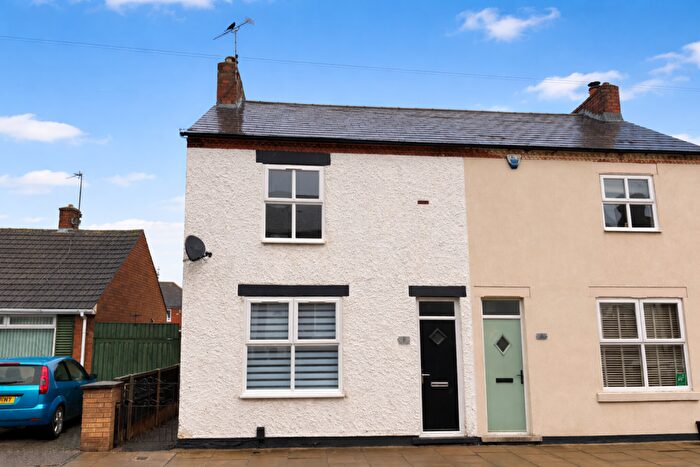
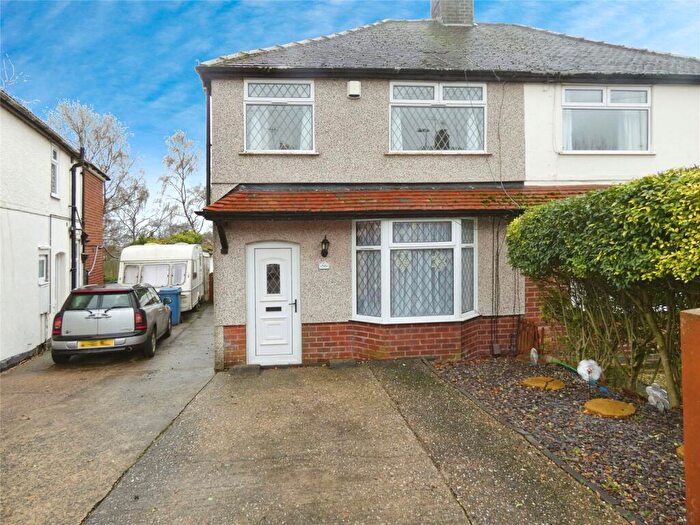
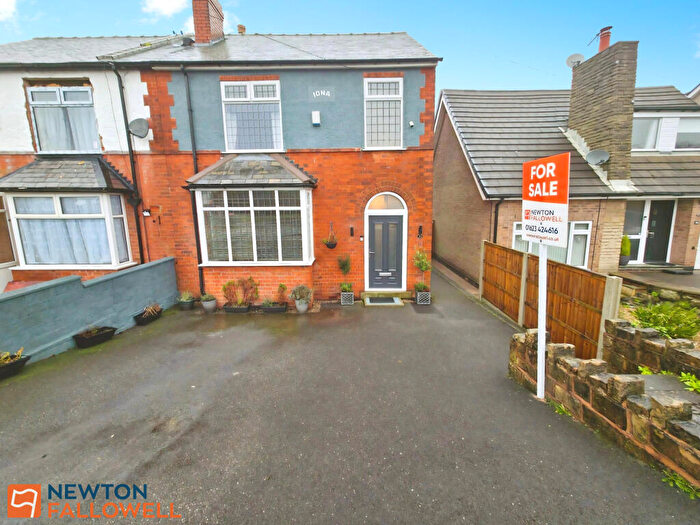
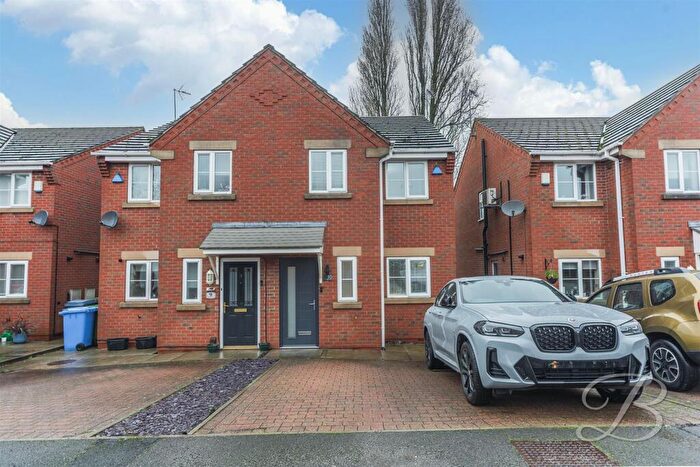
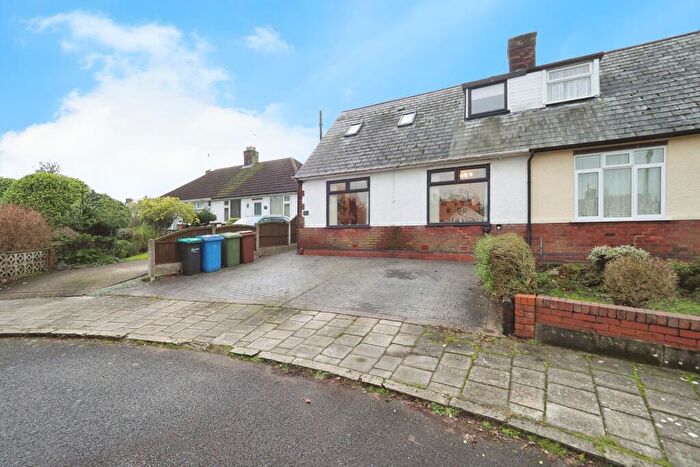
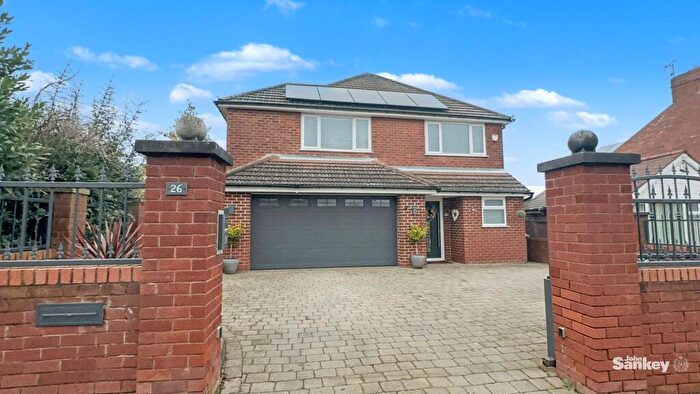
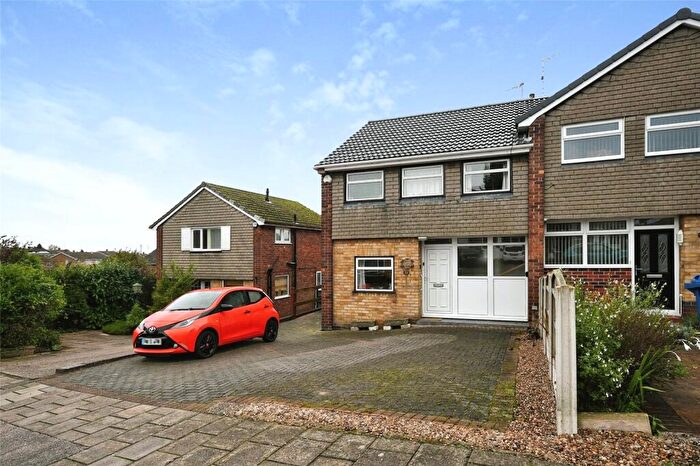
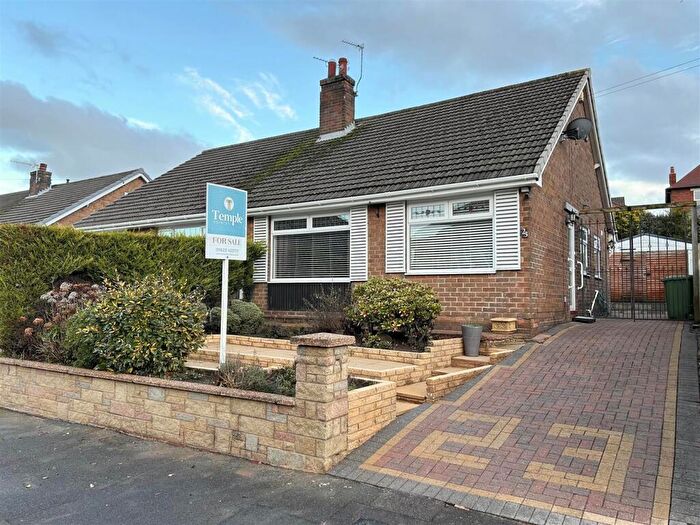
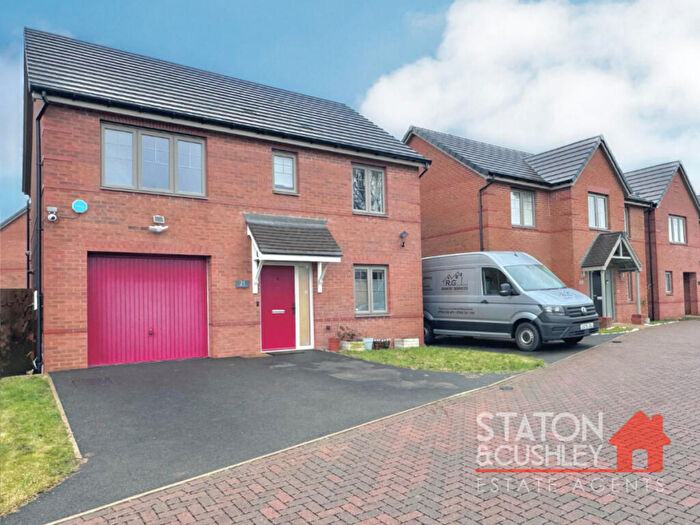
Houses for sale & to rent in Lindhurst, Mansfield
House Prices in Lindhurst
Properties in Lindhurst have an average house price of £310,172.00 and had 84 Property Transactions within the last 3 years¹.
Lindhurst is an area in Mansfield, Nottinghamshire with 1,106 households², where the most expensive property was sold for £750,000.00.
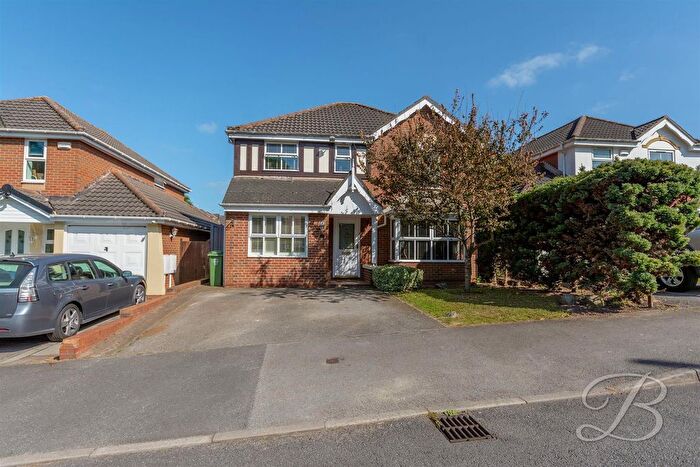
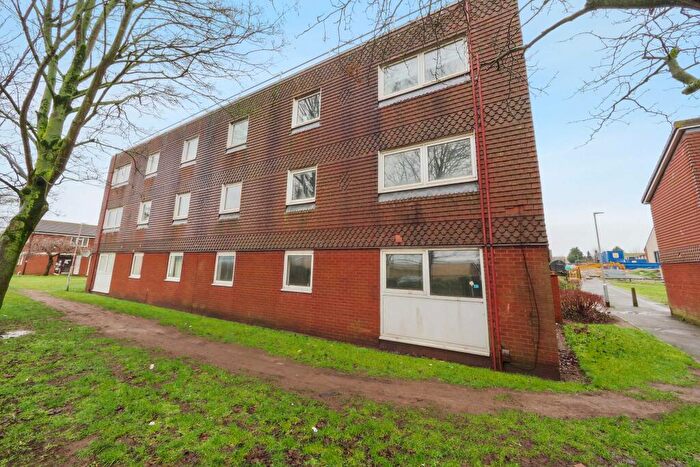
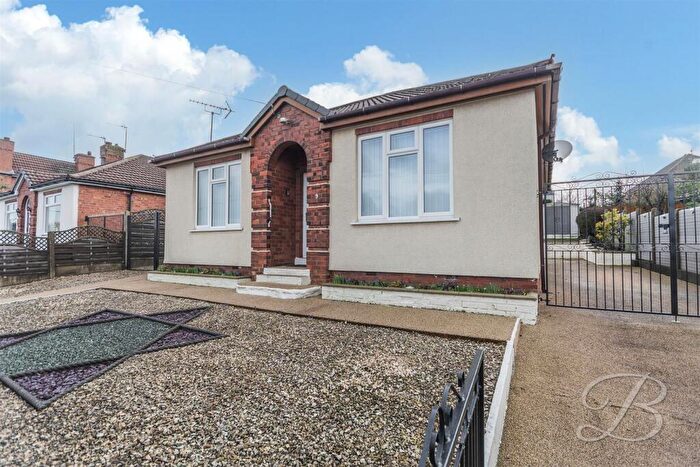
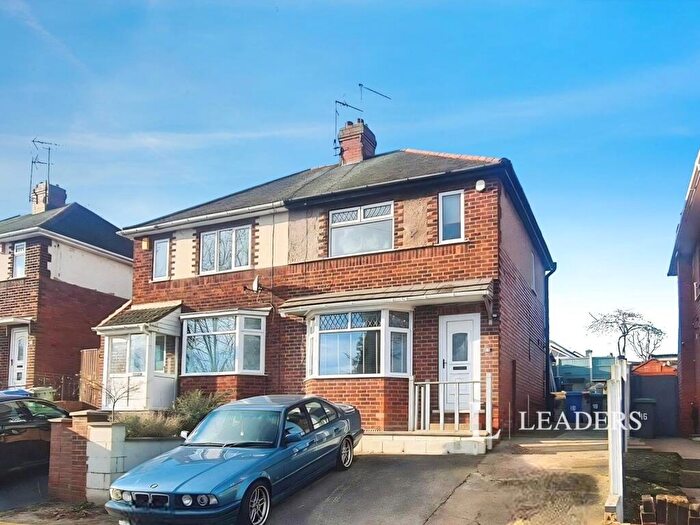
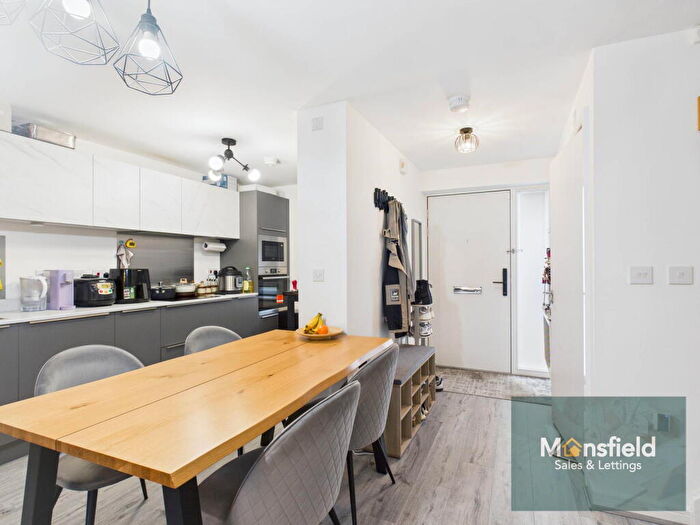
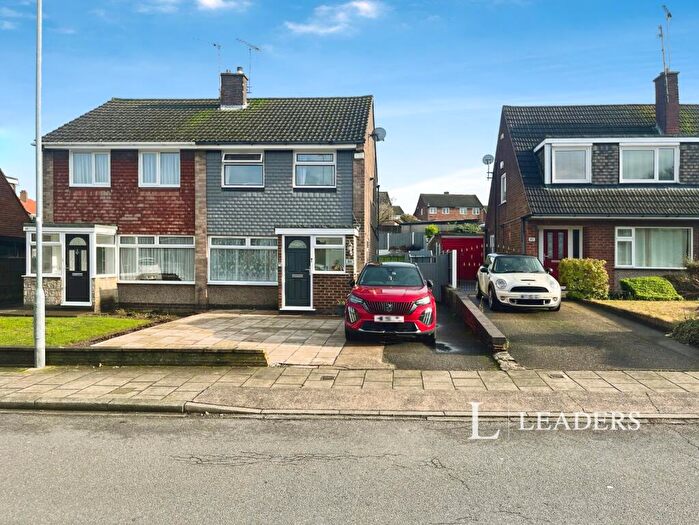
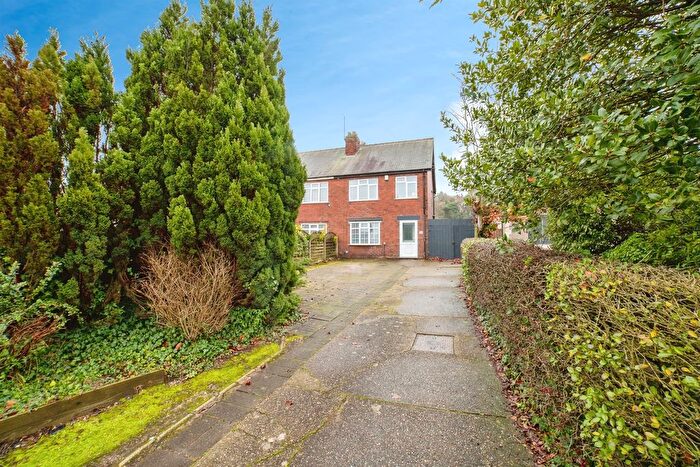
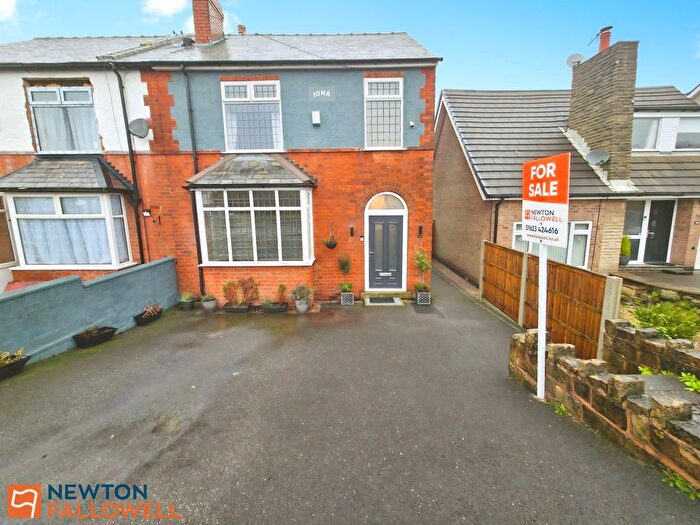
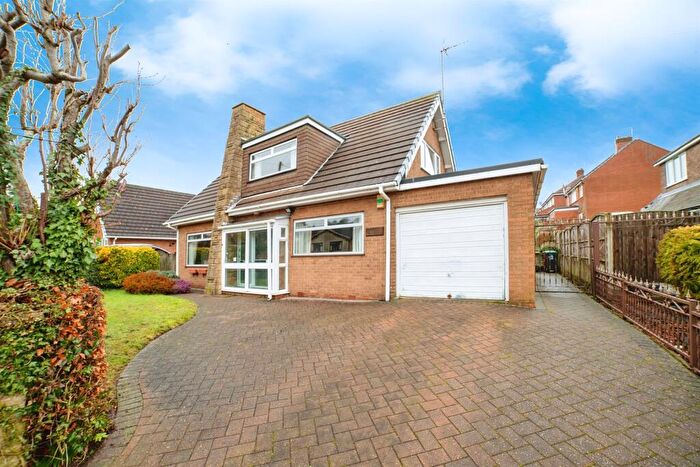
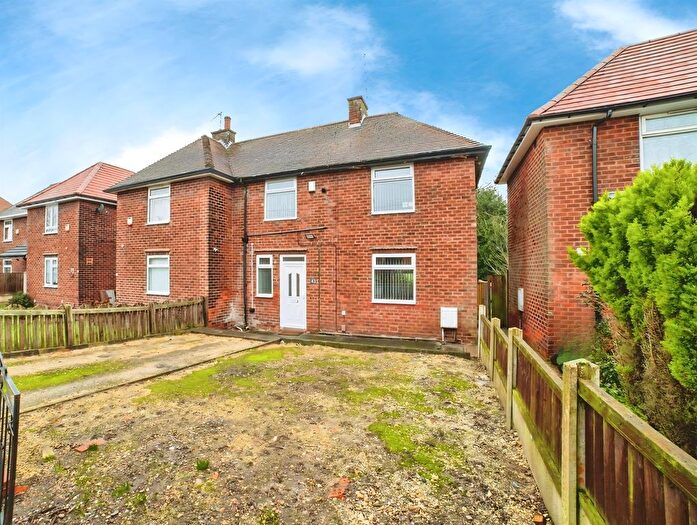
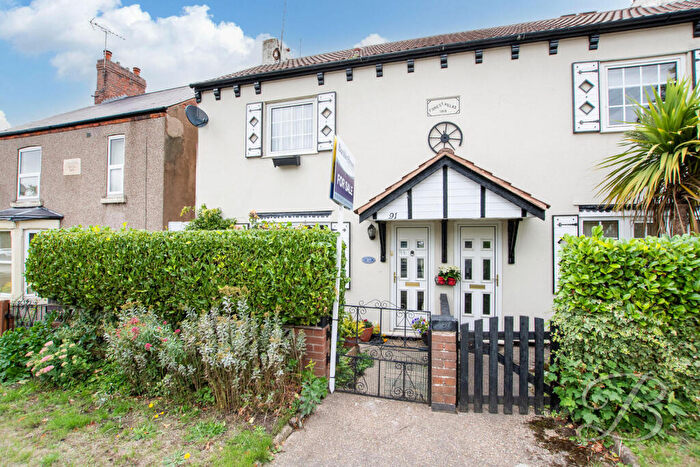
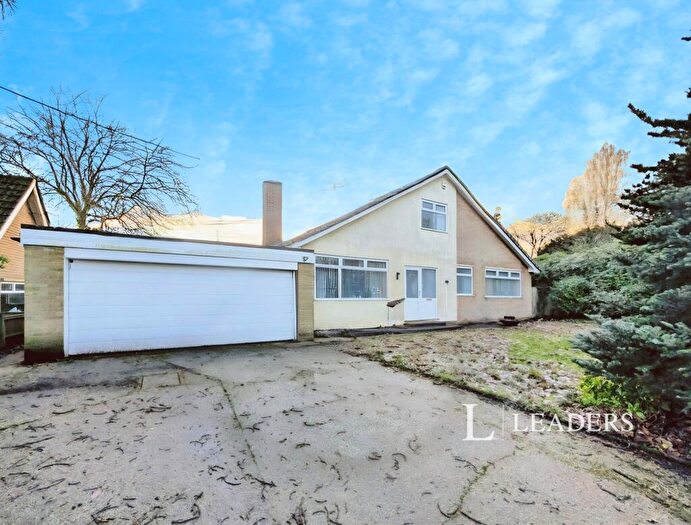
Properties for sale in Lindhurst
Roads and Postcodes in Lindhurst
Navigate through our locations to find the location of your next house in Lindhurst, Mansfield for sale or to rent.
| Streets | Postcodes |
|---|---|
| Acorn Way | NG18 3HD |
| Adamsway | NG18 4FL NG18 4FN NG18 4FW |
| Anglia Way Industrial Estate | NG18 4LP |
| Bellamy Road | NG18 4LN |
| Berry Hill Lane | NG18 4JD |
| Big Barn Lane | NG18 3LB |
| Birch Grove | NG18 4JH |
| Black Scotch Lane | NG18 4JT NG18 4PF |
| Bracken Hill | NG18 3NT |
| Bramble Lane | NG18 3NP NG18 3NR NG18 3NU NG18 3NX |
| Briar Lane | NG18 3HS |
| Carrion Place | NG18 6BE |
| Chatsworth Drive | NG18 4QU NG18 4QX |
| Columbia Avenue | NG18 3LD |
| Dell Lea | NG18 4HW |
| Dorset Way | NG18 3HX |
| Edale Close | NG18 4JY |
| Endor Road | NG18 6BH |
| Eskdale Close | NG18 3GU |
| Firbeck Avenue | NG18 3LE |
| Gorse Avenue | NG18 3NS |
| Greenacre | NG18 3JZ |
| Harvester Way | NG18 6AG |
| Ley Bank | NG18 4LG |
| Lindhurst Lane | NG18 4JE NG18 4JF |
| Lindhurst Way West | NG18 6AP |
| Lindsey Drive | NG18 4HJ |
| Ling Forest Road | NG18 3NN |
| Loxley Drive | NG18 4FB |
| Mandeen Grove | NG18 4FA |
| Mercury Way | NG18 6AR |
| Milldale Court | NG18 3GY |
| Nebula Way | NG18 6BJ |
| North Park | NG18 4PB |
| Oak Tree Lane | NG18 3HR NG18 3GQ NG18 3HG NG18 4LF |
| Oakfield Close | NG18 4PH |
| Oakwood Road | NG18 3HQ |
| Pineview Close | NG18 4PQ |
| Pinewood Drive | NG18 4PG |
| Ribbledale Close | NG18 3GW |
| Rochdale Court | NG18 3GX |
| Ryedale Avenue | NG18 3GT |
| Southpark Avenue | NG18 4PJ NG18 4PL |
| Southwell Gardens | NG18 4LH |
| Southwell Road West | NG18 4HF NG18 4LA NG18 4LB NG18 4LE NG18 4LW NG18 4TR |
| Sovereign Way | NG18 4LQ |
| Star Walk | NG18 6BA |
| The Avenue | NG18 4PD |
| The Dukeries | NG18 3LN |
| Verona Court | NG18 4HN |
| Waterson Avenue | NG18 4JG |
| Waterson Close | NG18 4JQ |
| Waterson Oaks | NG18 4LL |
| Wentbridge Drive | NG18 3HU |
| Wharfedale Gardens | NG18 3GZ |
| Whitestone Close | NG18 4JZ |
| Winchester Close | NG18 4HL |
| Wingfield Road | NG18 3HT |
Transport near Lindhurst
-
Mansfield Town Station
-
Mansfield Woodhouse Station
-
Sutton Parkway Station
-
Kirkby in Ashfield Station
-
Newstead Station
- FAQ
- Price Paid By Year
- Property Type Price
Frequently asked questions about Lindhurst
What is the average price for a property for sale in Lindhurst?
The average price for a property for sale in Lindhurst is £310,172. This amount is 60% higher than the average price in Mansfield. There are 604 property listings for sale in Lindhurst.
What streets have the most expensive properties for sale in Lindhurst?
The streets with the most expensive properties for sale in Lindhurst are The Avenue at an average of £606,666, Berry Hill Lane at an average of £495,000 and Ribbledale Close at an average of £429,250.
What streets have the most affordable properties for sale in Lindhurst?
The streets with the most affordable properties for sale in Lindhurst are Mandeen Grove at an average of £165,000, Firbeck Avenue at an average of £169,500 and Bramble Lane at an average of £180,700.
Which train stations are available in or near Lindhurst?
Some of the train stations available in or near Lindhurst are Mansfield Town, Mansfield Woodhouse and Sutton Parkway.
Property Price Paid in Lindhurst by Year
The average sold property price by year was:
| Year | Average Sold Price | Price Change |
Sold Properties
|
|---|---|---|---|
| 2025 | £316,537 | 10% |
27 Properties |
| 2024 | £284,838 | -19% |
34 Properties |
| 2023 | £340,152 | 8% |
23 Properties |
| 2022 | £312,490 | 3% |
47 Properties |
| 2021 | £303,837 | 18% |
62 Properties |
| 2020 | £248,458 | 6% |
46 Properties |
| 2019 | £232,597 | 4% |
40 Properties |
| 2018 | £222,425 | 2% |
49 Properties |
| 2017 | £218,052 | 2% |
52 Properties |
| 2016 | £214,422 | 11% |
59 Properties |
| 2015 | £191,261 | 4% |
54 Properties |
| 2014 | £184,003 | 8% |
48 Properties |
| 2013 | £170,048 | 3% |
40 Properties |
| 2012 | £165,470 | -14% |
27 Properties |
| 2011 | £187,823 | 13% |
23 Properties |
| 2010 | £164,203 | -6% |
28 Properties |
| 2009 | £173,550 | -10% |
30 Properties |
| 2008 | £191,292 | 3% |
24 Properties |
| 2007 | £186,434 | 4% |
39 Properties |
| 2006 | £179,503 | -0,2% |
43 Properties |
| 2005 | £179,794 | 2% |
39 Properties |
| 2004 | £176,850 | 22% |
53 Properties |
| 2003 | £138,506 | 21% |
52 Properties |
| 2002 | £109,236 | 21% |
81 Properties |
| 2001 | £85,948 | -26% |
52 Properties |
| 2000 | £108,045 | 24% |
60 Properties |
| 1999 | £82,185 | 8% |
80 Properties |
| 1998 | £75,629 | -1% |
66 Properties |
| 1997 | £76,694 | 7% |
53 Properties |
| 1996 | £71,370 | 12% |
61 Properties |
| 1995 | £62,788 | - |
56 Properties |
Property Price per Property Type in Lindhurst
Here you can find historic sold price data in order to help with your property search.
The average Property Paid Price for specific property types in the last three years are:
| Property Type | Average Sold Price | Sold Properties |
|---|---|---|
| Semi Detached House | £190,125.00 | 24 Semi Detached Houses |
| Detached House | £358,191.00 | 60 Detached Houses |

