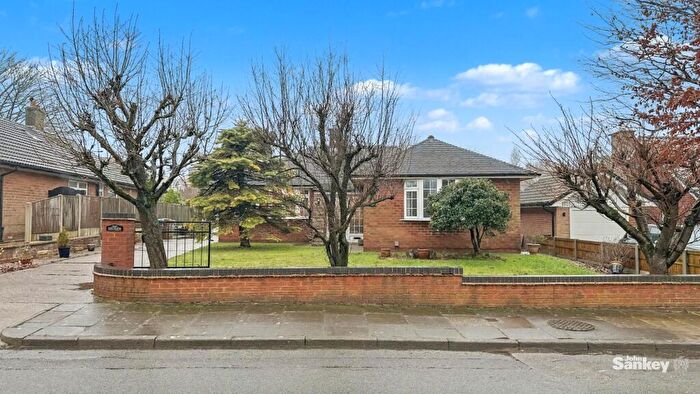
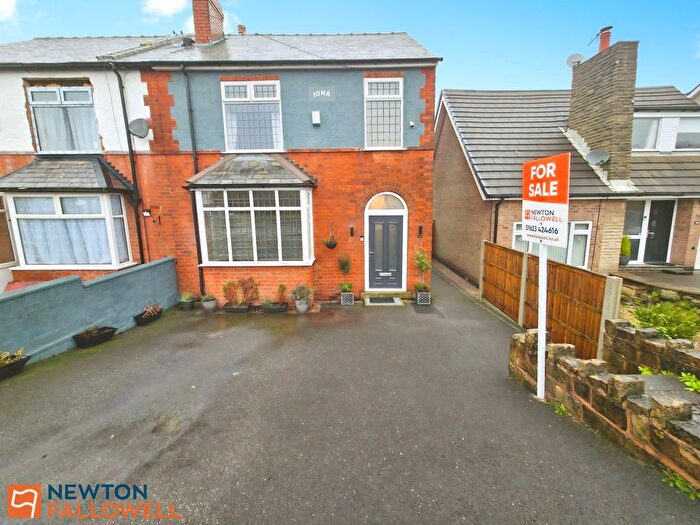
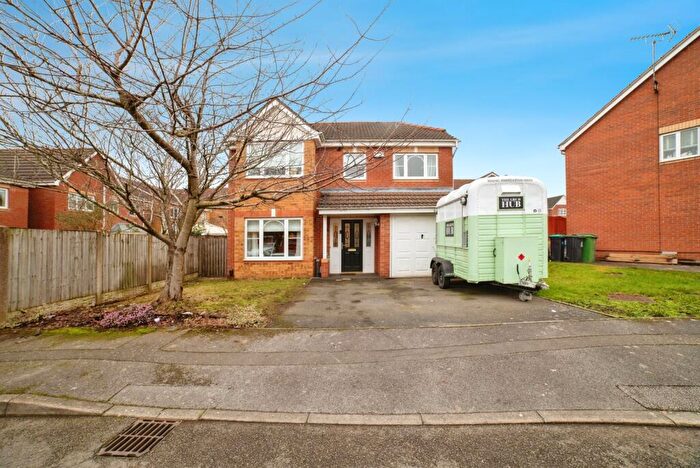
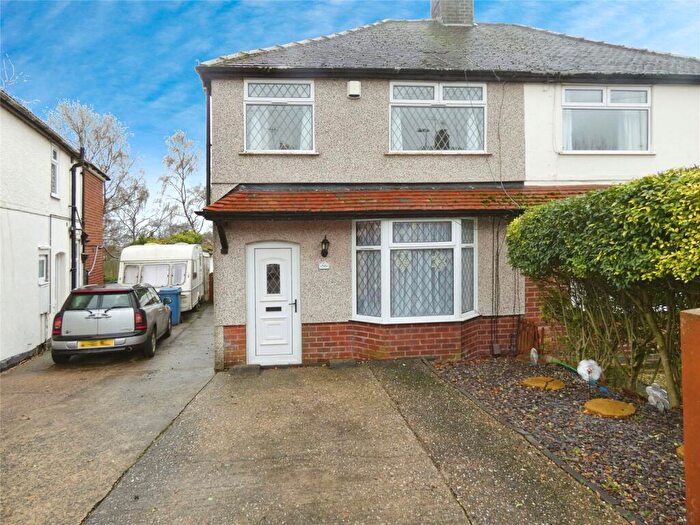
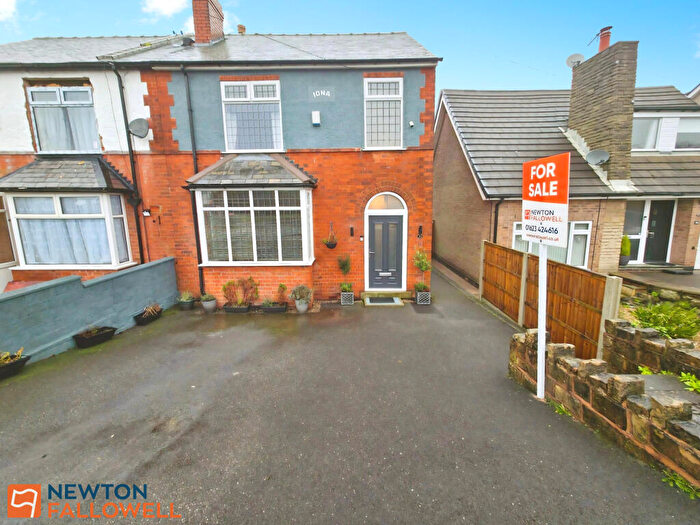
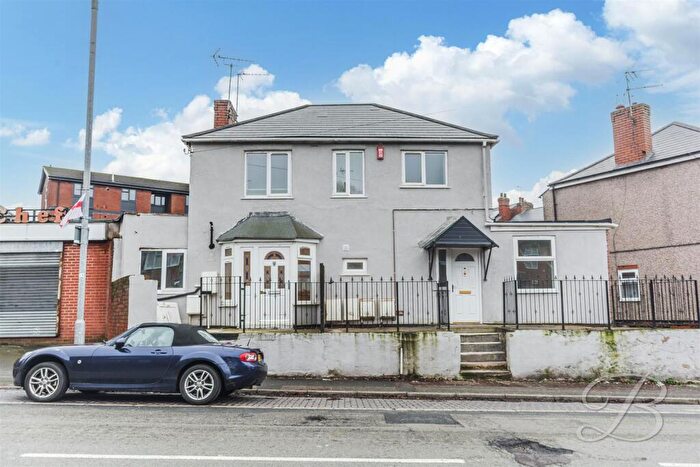
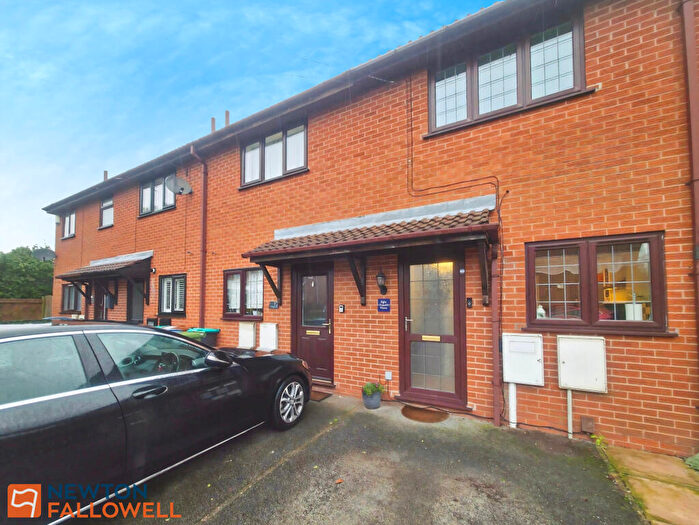
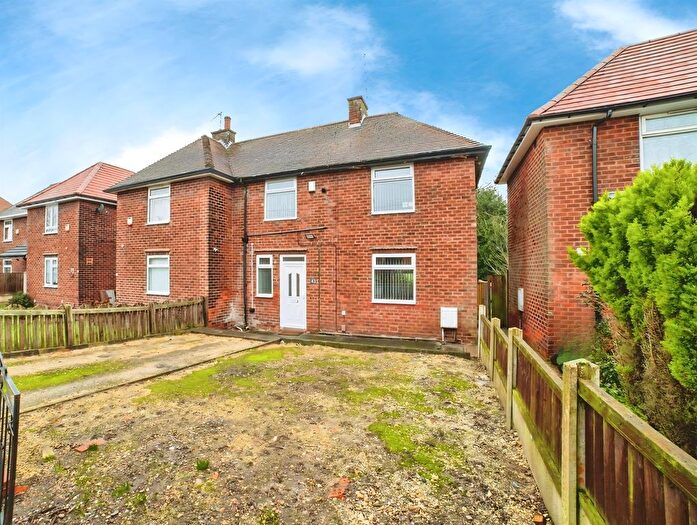
Houses for sale & to rent in Kings Walk, Mansfield
House Prices in Kings Walk
Properties in Kings Walk have an average house price of £206,792.00 and had 180 Property Transactions within the last 3 years¹.
Kings Walk is an area in Mansfield, Nottinghamshire with 1,237 households², where the most expensive property was sold for £402,000.00.
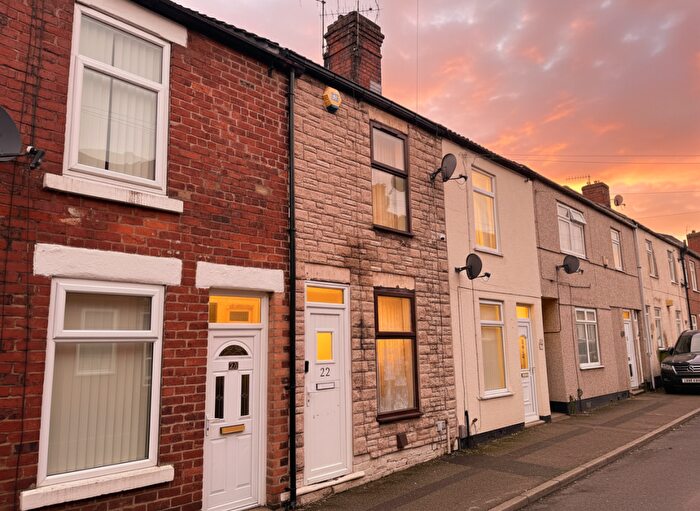
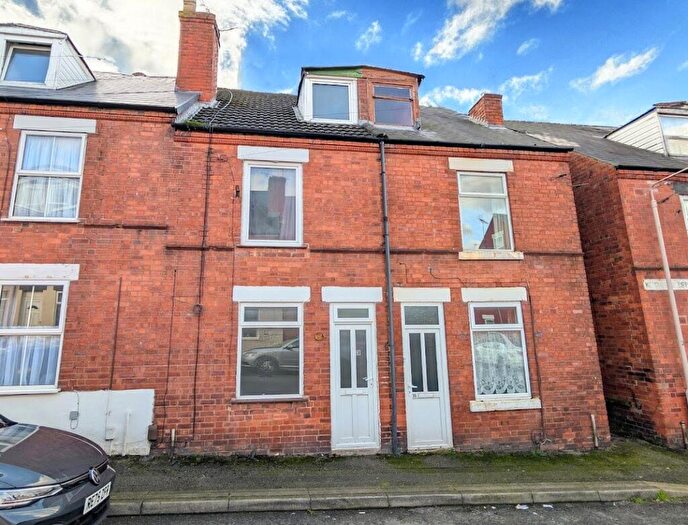
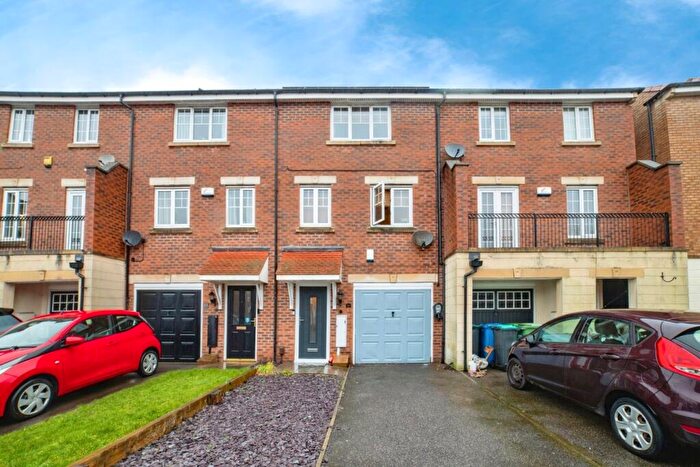
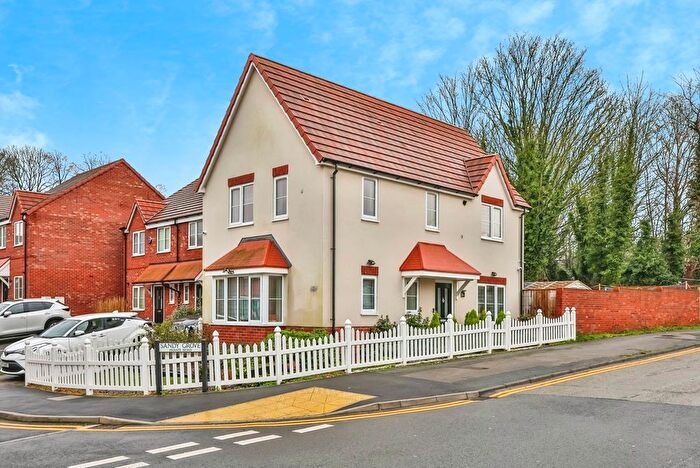
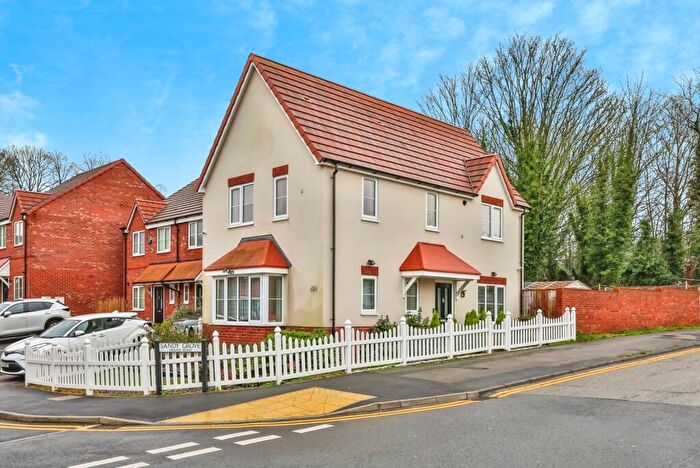
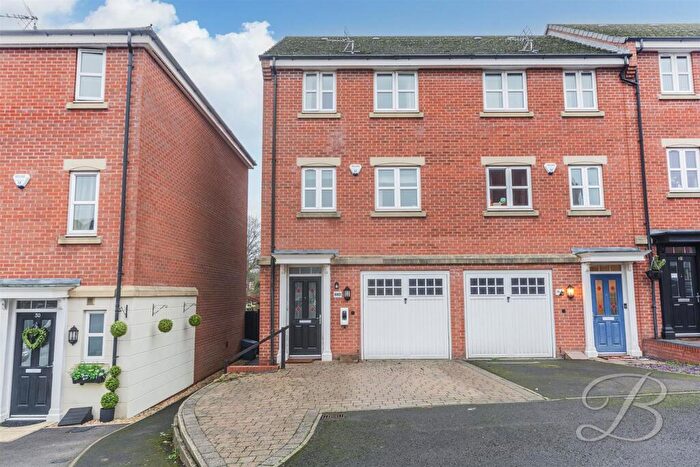
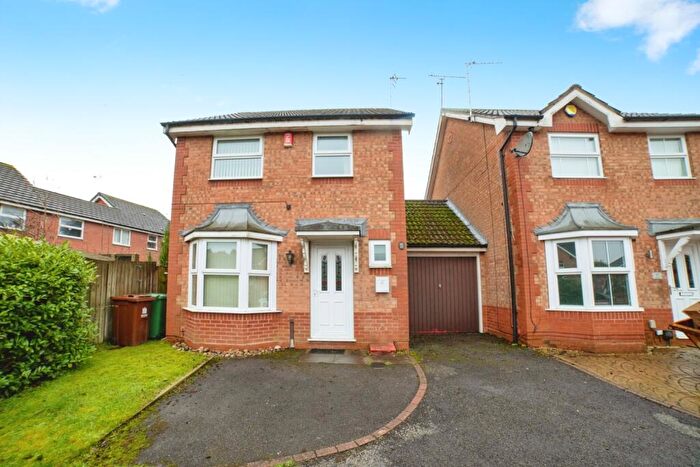
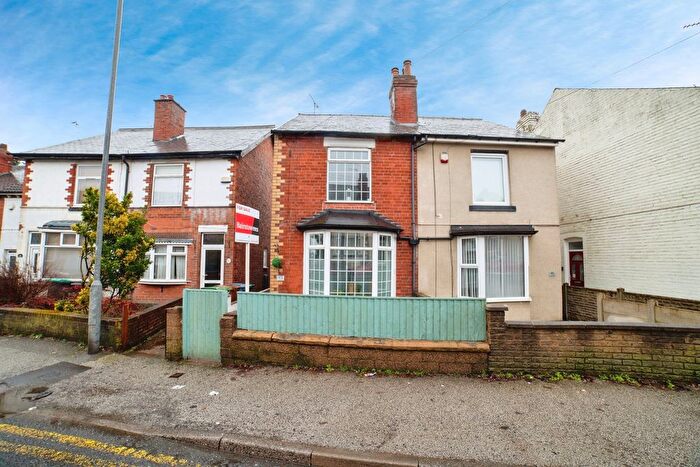
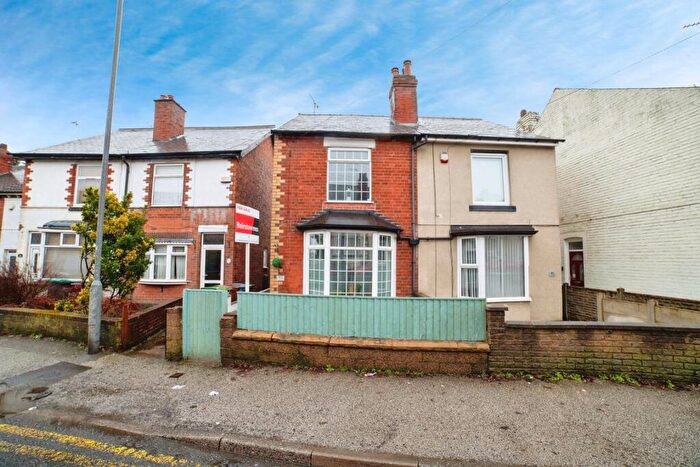
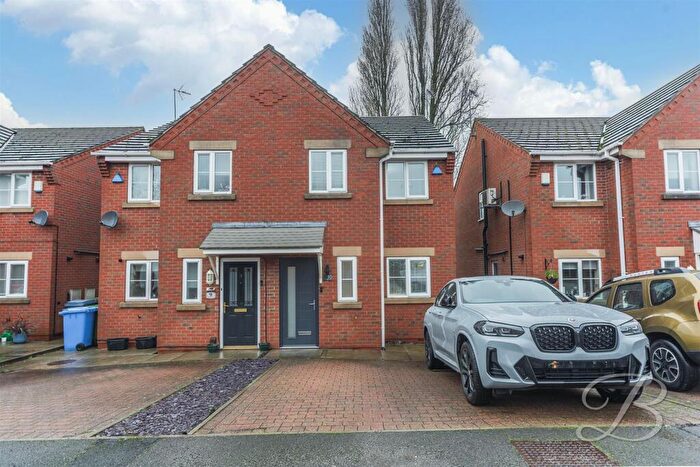
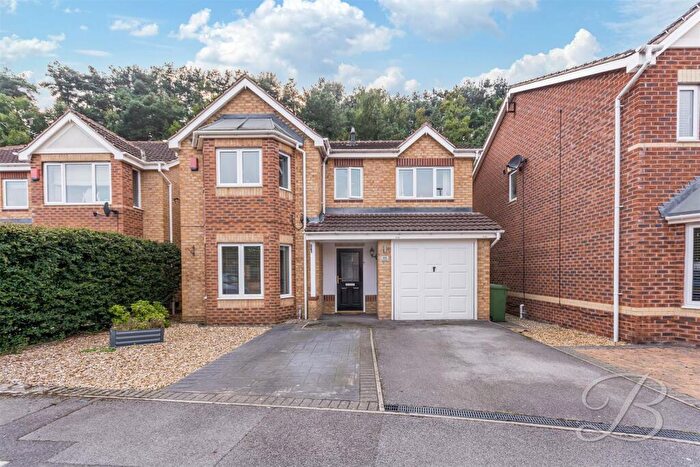
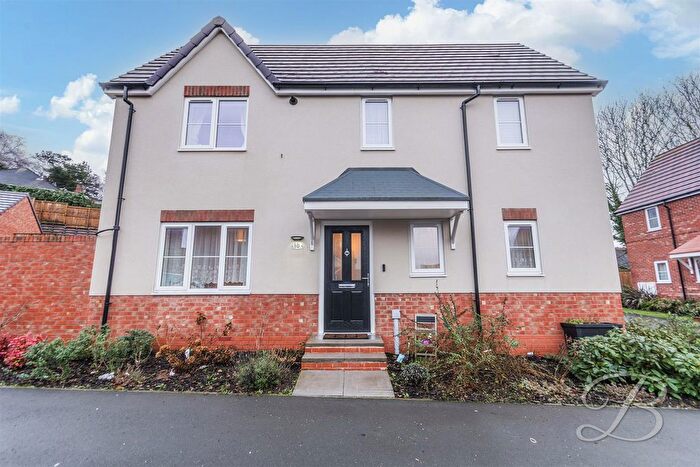
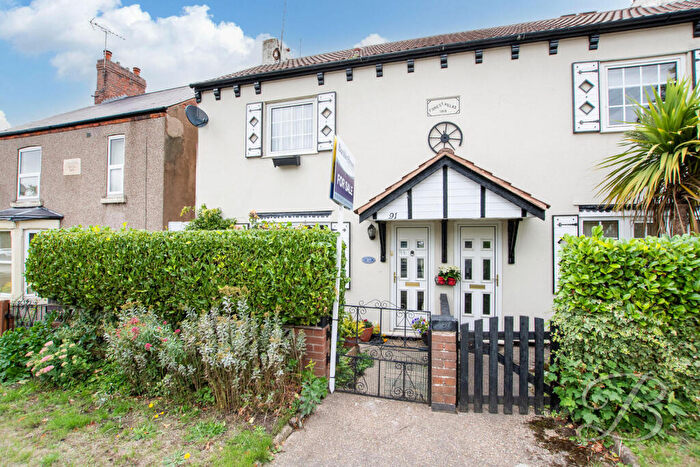
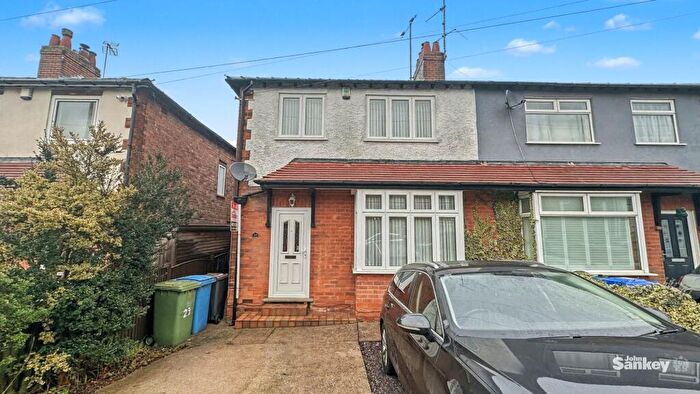
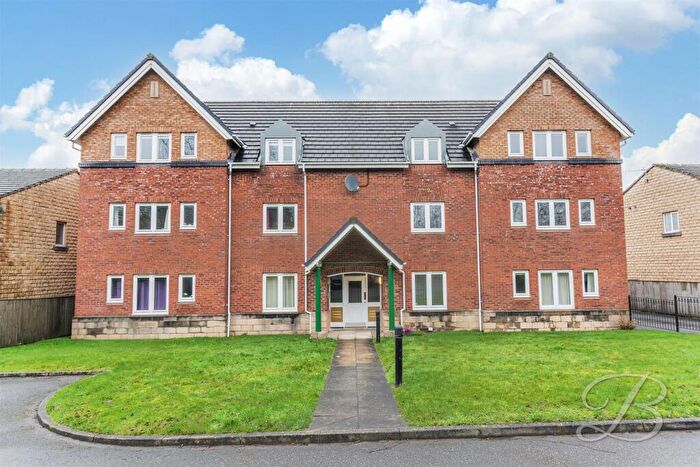
Properties for sale in Kings Walk
Roads and Postcodes in Kings Walk
Navigate through our locations to find the location of your next house in Kings Walk, Mansfield for sale or to rent.
| Streets | Postcodes |
|---|---|
| Admirals Court | NG18 4YS |
| Amber Street | NG18 4XJ |
| Amethyst Gardens | NG18 4XF |
| Arches Road | NG18 4YR |
| Bank End Close | NG18 4QG |
| Berkeley Road | NG18 4YG |
| Berry Hill Close | NG18 4RS |
| Berry Hill Lane | NG18 4JS |
| Berry Hill Road | NG18 4RR NG18 4RT NG18 4RU |
| Birchin Walk | NG18 4XU |
| Black Rock Way | NG18 4YE |
| Cairngorm Drive | NG18 4XT |
| Cobblestone Drive | NG18 4GB |
| Curbar Close | NG18 4XS |
| Diamond Court | NG18 4XH |
| Garnet Close | NG18 4XL |
| Heathfield Way | NG18 4GD |
| Jade Court | NG18 4WJ |
| Kings Stand | NG18 4AY |
| Kings Walk | NG18 4XN NG18 4XR NG18 4YD |
| Madeline Court | NG18 4XW |
| Mayfair Avenue | NG18 4EQ |
| Melrose Avenue | NG18 4EG |
| Mendip Close | NG18 4UR |
| Millrise Road | NG18 4YP |
| Opal Close | NG18 4XD |
| Quarry Bank | NG18 4AT |
| Quartz Avenue | NG18 4XB |
| Redwood Court | NG18 4YN |
| Ruby Way | NG18 4XA NG18 4XQ |
| Sandmartins Close | NG18 4YH |
| Sapphire Street | NG18 4XG |
| Scholars Way | NG18 4YT |
| Southwell Road West | NG18 4EN NG18 4EW |
| Stone Bank | NG18 4GL |
| Topaz Grove | NG18 4XE |
| Valley View | NG18 4US |
| White Rose Avenue | NG18 4YF |
| Windsor Gardens | NG18 4EE |
| Windsor Road | NG18 4EA NG18 4EB NG18 4ED NG18 4EF |
Transport near Kings Walk
-
Mansfield Town Station
-
Mansfield Woodhouse Station
-
Sutton Parkway Station
-
Kirkby in Ashfield Station
-
Newstead Station
-
Shirebrook (Derbys) Station
- FAQ
- Price Paid By Year
- Property Type Price
Frequently asked questions about Kings Walk
What is the average price for a property for sale in Kings Walk?
The average price for a property for sale in Kings Walk is £206,792. This amount is 6% higher than the average price in Mansfield. There are 1,323 property listings for sale in Kings Walk.
What streets have the most expensive properties for sale in Kings Walk?
The streets with the most expensive properties for sale in Kings Walk are Berry Hill Close at an average of £313,750, Opal Close at an average of £300,400 and Kings Stand at an average of £297,821.
What streets have the most affordable properties for sale in Kings Walk?
The streets with the most affordable properties for sale in Kings Walk are Curbar Close at an average of £100,000, Black Rock Way at an average of £123,850 and Heathfield Way at an average of £141,230.
Which train stations are available in or near Kings Walk?
Some of the train stations available in or near Kings Walk are Mansfield Town, Mansfield Woodhouse and Sutton Parkway.
Property Price Paid in Kings Walk by Year
The average sold property price by year was:
| Year | Average Sold Price | Price Change |
Sold Properties
|
|---|---|---|---|
| 2025 | £211,959 | -2% |
55 Properties |
| 2024 | £216,484 | 13% |
71 Properties |
| 2023 | £188,787 | -3% |
54 Properties |
| 2022 | £194,253 | 9% |
87 Properties |
| 2021 | £177,147 | 8% |
96 Properties |
| 2020 | £162,532 | 5% |
84 Properties |
| 2019 | £154,954 | -8% |
78 Properties |
| 2018 | £167,654 | 8% |
92 Properties |
| 2017 | £154,488 | 4% |
93 Properties |
| 2016 | £147,866 | 2% |
114 Properties |
| 2015 | £145,558 | 0,3% |
84 Properties |
| 2014 | £145,121 | 6% |
88 Properties |
| 2013 | £136,292 | -8% |
70 Properties |
| 2012 | £147,171 | 16% |
48 Properties |
| 2011 | £124,332 | -11% |
79 Properties |
| 2010 | £138,211 | 0,1% |
60 Properties |
| 2009 | £138,088 | -9% |
51 Properties |
| 2008 | £151,027 | 8% |
80 Properties |
| 2007 | £138,681 | 3% |
227 Properties |
| 2006 | £133,924 | -12% |
228 Properties |
| 2005 | £150,256 | 5% |
191 Properties |
| 2004 | £143,092 | 9% |
210 Properties |
| 2003 | £129,821 | 6% |
117 Properties |
| 2002 | £122,276 | 20% |
99 Properties |
| 2001 | £97,940 | 28% |
49 Properties |
| 2000 | £70,945 | 34% |
22 Properties |
| 1999 | £46,495 | -11% |
19 Properties |
| 1998 | £51,678 | -1% |
16 Properties |
| 1997 | £51,963 | -0,4% |
22 Properties |
| 1996 | £52,196 | 24% |
15 Properties |
| 1995 | £39,491 | - |
6 Properties |
Property Price per Property Type in Kings Walk
Here you can find historic sold price data in order to help with your property search.
The average Property Paid Price for specific property types in the last three years are:
| Property Type | Average Sold Price | Sold Properties |
|---|---|---|
| Semi Detached House | £205,385.00 | 57 Semi Detached Houses |
| Detached House | £305,260.00 | 48 Detached Houses |
| Terraced House | £181,248.00 | 35 Terraced Houses |
| Flat | £112,986.00 | 40 Flats |

