Houses for sale & to rent in Caunton, Newark
House Prices in Caunton
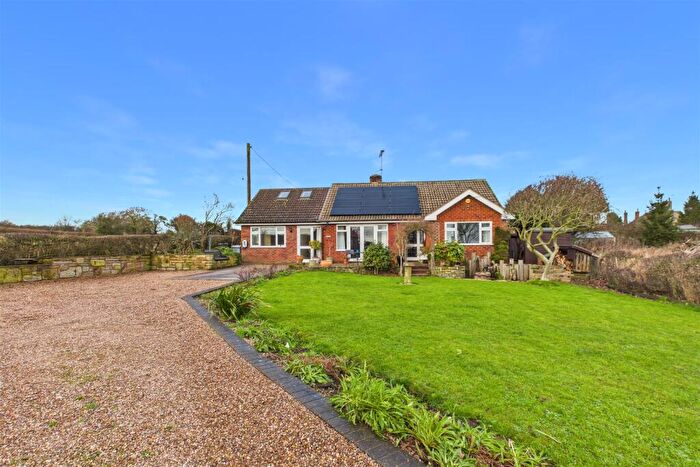
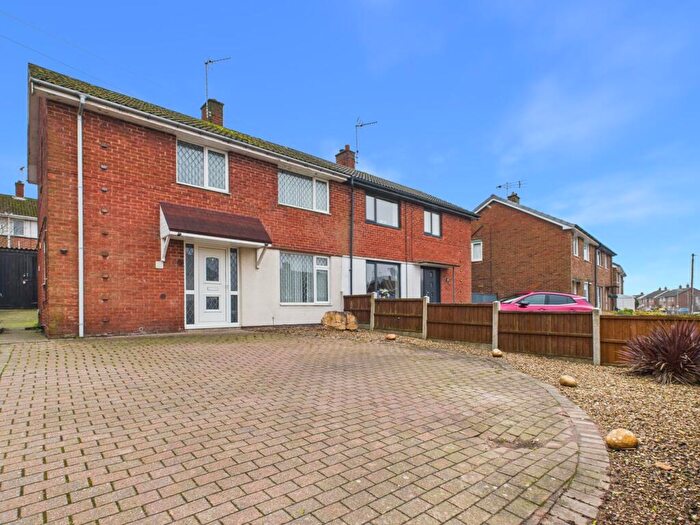
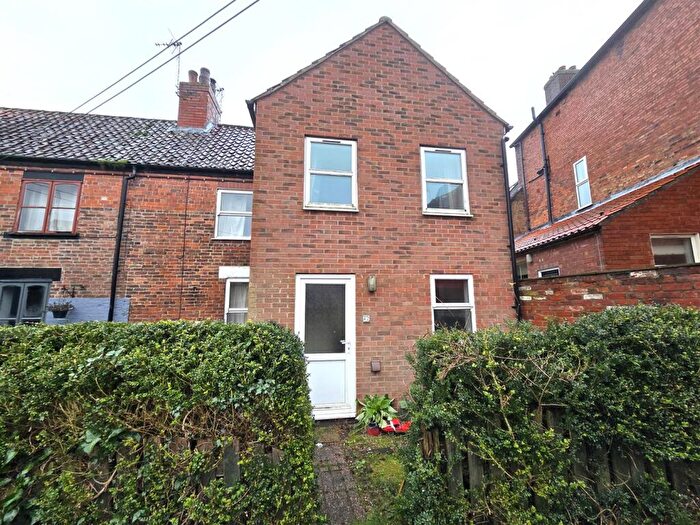
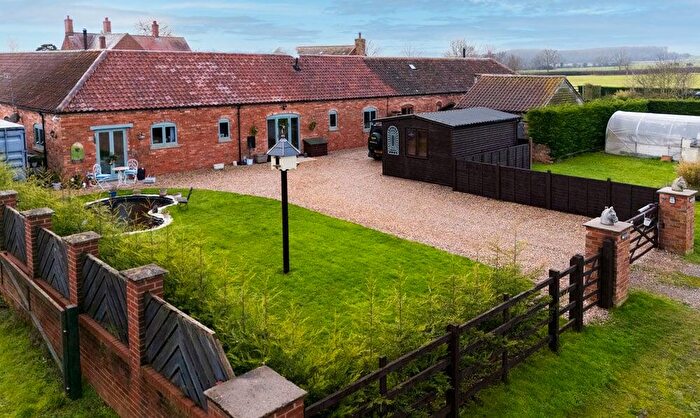
Properties in Caunton have an average house price of £420,852.00 and had 49 Property Transactions within the last 3 years¹.
Caunton is an area in Newark, Nottinghamshire with 770 households², where the most expensive property was sold for £1,090,000.00.
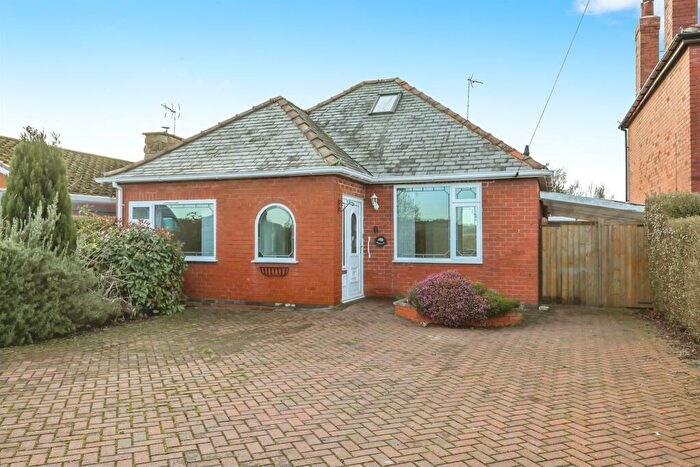
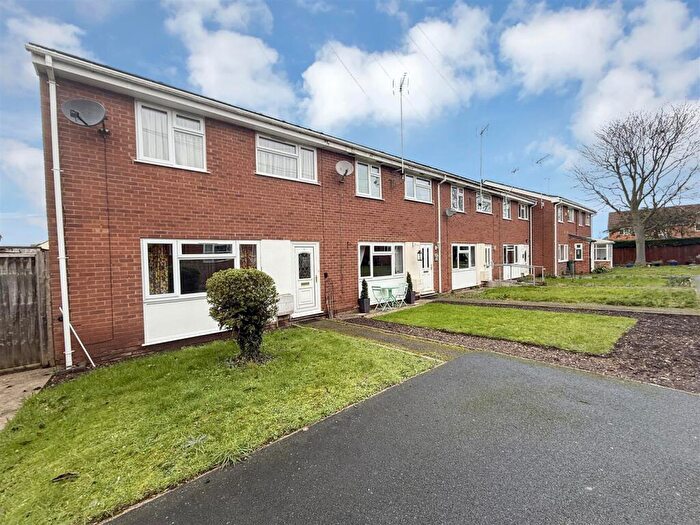
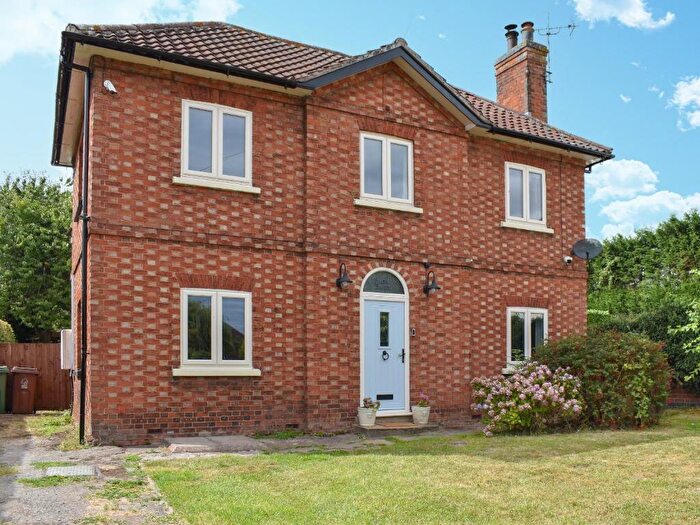
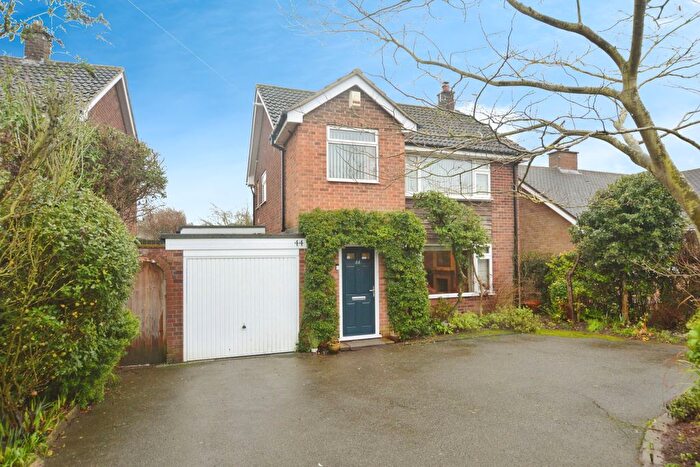
Properties for sale in Caunton
Roads and Postcodes in Caunton
Navigate through our locations to find the location of your next house in Caunton, Newark for sale or to rent.
| Streets | Postcodes |
|---|---|
| Amen Corner | NG23 6AP |
| Baulk Lane | NG22 0AA |
| Bowman Place | NG22 0FD |
| Burnmoor Lane | NG22 0HE |
| Chapel Lane | NG22 0BF NG23 6AN |
| Church Farm Gardens | NG22 0EW |
| Church View | NG22 0HN |
| Cross Hill | NG22 0SX |
| Deans Close | NG23 6AG |
| Eakring Road | NG22 0AG NG22 0ED NG22 0EE NG22 0EG |
| Elm Tree Rise | NG22 0BE |
| Flash Lane | NG22 0AT |
| Gaddick View | NG22 0HD |
| Great North Road | NG22 0NE |
| Hagg Lane | NG22 0HJ |
| High Street | NG22 0NX |
| Hockerton Road | NG23 6BA |
| Holly Mount | NG22 0AF |
| Holme Lane | NG22 0EU |
| Kirton Road | NG22 0HF NG22 0HQ |
| Lamberts Lane | NG23 6JB |
| Laxton Road | NG22 0ET NG22 0EY NG22 0NS |
| Main Street | NG22 0AD NG22 0EZ NG22 0NU NG23 6AB NG23 6LJ |
| Manor Farm Rise | NG22 0ER |
| Manor Road | NG23 6AD |
| Manor View | NG23 6AW |
| Maplebeck Road | NG23 6AS |
| Maypole Green | NG22 0FE |
| Maypole Road | NG22 0EF |
| Mill Lane | NG22 0EX NG23 6AJ |
| Milner Fields | NG22 0SJ |
| Moorhouse Road | NG22 0HH |
| Newark Road | NG22 0EA NG22 0EJ NG23 6AE |
| Norwell Road | NG23 6AF NG23 6AH NG23 6AQ |
| Ollerton Road | NG23 6AY |
| Ossington Road | NG22 0AB |
| Parkins Row | NG23 6AL |
| Potter Lane | NG22 0EB |
| Roewood Lane | NG22 8PH NG22 8PJ |
| School Lane | NG22 0AE NG23 6AA |
| Tanyard | NG22 0FB |
| The Bar | NG22 0NT |
| Timothy Road | NG22 0NY |
| Town End | NG22 0SY |
| Tuxford Road | NG22 0HA |
| Weston Road | NG22 0HB |
| NG22 0AH NG22 0AU NG22 0BJ NG22 0BP NG22 0BS NG22 0PA NG23 6AX NG23 6AZ NG23 6LG NG23 6LH NG23 6LT NG23 6LU NG23 6LZ |
Transport near Caunton
-
Collingham Station
-
Rolleston Station
-
Fiskerton Station
-
Newark Castle Station
-
Newark North Gate Station
-
Swinderby Station
-
Bleasby Station
-
Retford Station
- FAQ
- Price Paid By Year
- Property Type Price
Frequently asked questions about Caunton
What is the average price for a property for sale in Caunton?
The average price for a property for sale in Caunton is £420,852. This amount is 69% higher than the average price in Newark. There are 2,200 property listings for sale in Caunton.
What streets have the most expensive properties for sale in Caunton?
The streets with the most expensive properties for sale in Caunton are Norwell Road at an average of £663,333, Church View at an average of £605,000 and Baulk Lane at an average of £570,000.
What streets have the most affordable properties for sale in Caunton?
The streets with the most affordable properties for sale in Caunton are Deans Close at an average of £225,500, Elm Tree Rise at an average of £232,500 and Holly Mount at an average of £305,000.
Which train stations are available in or near Caunton?
Some of the train stations available in or near Caunton are Collingham, Rolleston and Fiskerton.
Property Price Paid in Caunton by Year
The average sold property price by year was:
| Year | Average Sold Price | Price Change |
Sold Properties
|
|---|---|---|---|
| 2025 | £414,234 | 5% |
16 Properties |
| 2024 | £392,593 | -16% |
16 Properties |
| 2023 | £453,676 | -3% |
17 Properties |
| 2022 | £465,404 | 11% |
21 Properties |
| 2021 | £413,544 | 36% |
34 Properties |
| 2020 | £266,236 | -12% |
19 Properties |
| 2019 | £299,150 | -26% |
20 Properties |
| 2018 | £376,125 | 20% |
16 Properties |
| 2017 | £301,606 | 6% |
23 Properties |
| 2016 | £283,455 | 8% |
35 Properties |
| 2015 | £261,830 | -7% |
21 Properties |
| 2014 | £279,454 | 21% |
34 Properties |
| 2013 | £220,960 | -26% |
17 Properties |
| 2012 | £278,117 | 4% |
17 Properties |
| 2011 | £266,531 | -9% |
16 Properties |
| 2010 | £289,218 | 30% |
25 Properties |
| 2009 | £202,055 | -28% |
9 Properties |
| 2008 | £258,318 | -9% |
11 Properties |
| 2007 | £281,588 | 7% |
30 Properties |
| 2006 | £261,291 | -7% |
23 Properties |
| 2005 | £279,248 | 21% |
26 Properties |
| 2004 | £220,460 | 5% |
25 Properties |
| 2003 | £209,651 | 19% |
24 Properties |
| 2002 | £169,126 | -1% |
44 Properties |
| 2001 | £170,240 | 20% |
43 Properties |
| 2000 | £135,783 | 14% |
27 Properties |
| 1999 | £116,254 | 9% |
41 Properties |
| 1998 | £105,248 | 16% |
27 Properties |
| 1997 | £88,498 | 7% |
29 Properties |
| 1996 | £81,979 | 14% |
24 Properties |
| 1995 | £70,605 | - |
24 Properties |
Property Price per Property Type in Caunton
Here you can find historic sold price data in order to help with your property search.
The average Property Paid Price for specific property types in the last three years are:
| Property Type | Average Sold Price | Sold Properties |
|---|---|---|
| Semi Detached House | £297,384.00 | 13 Semi Detached Houses |
| Detached House | £462,080.00 | 34 Detached Houses |
| Terraced House | £522,500.00 | 2 Terraced Houses |

