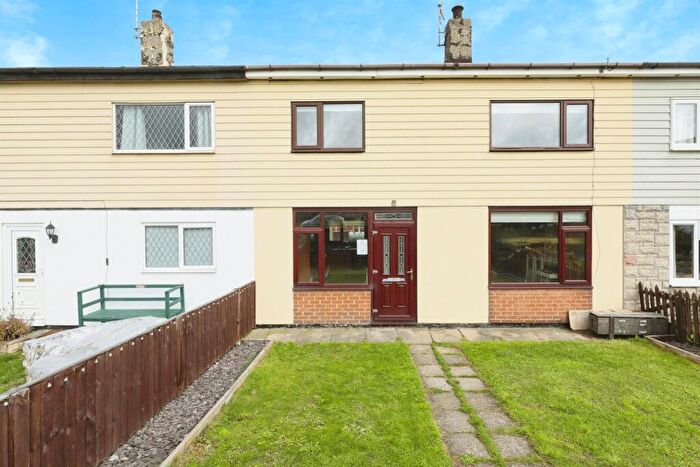
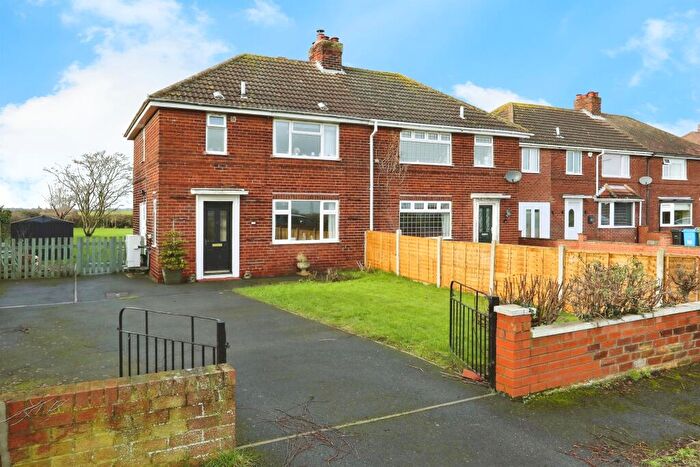
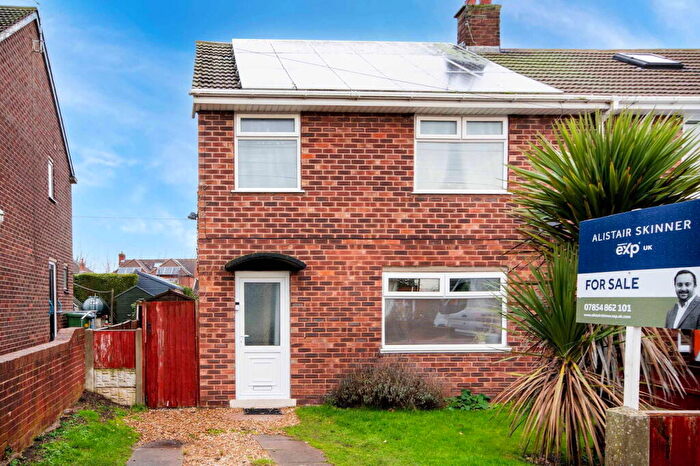
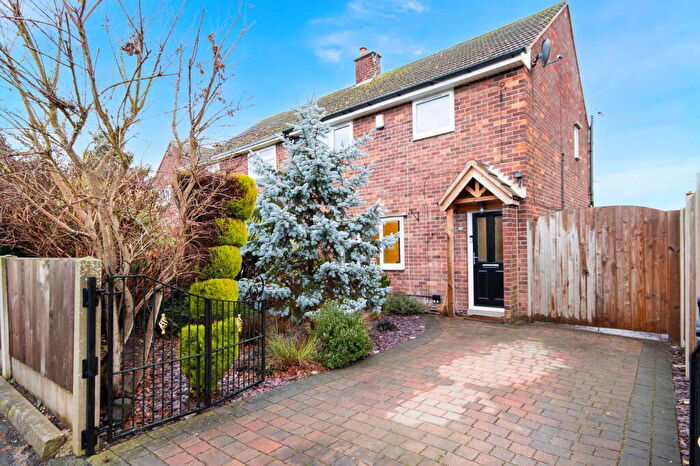
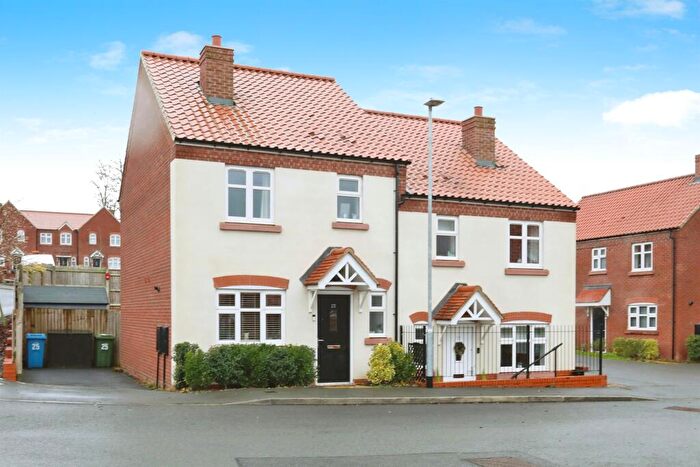
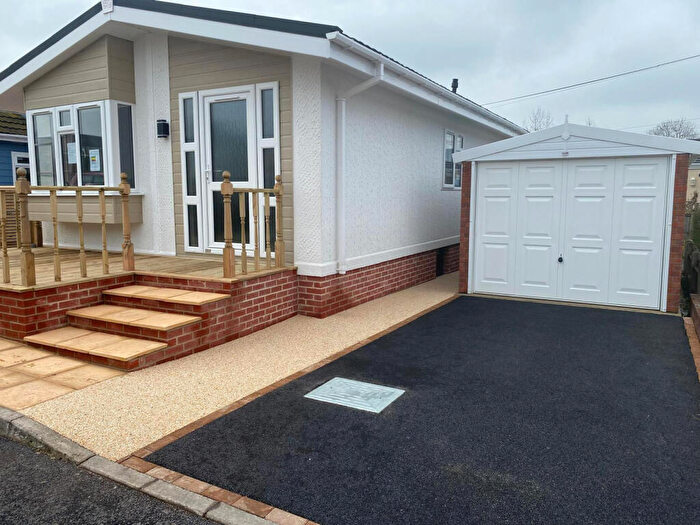
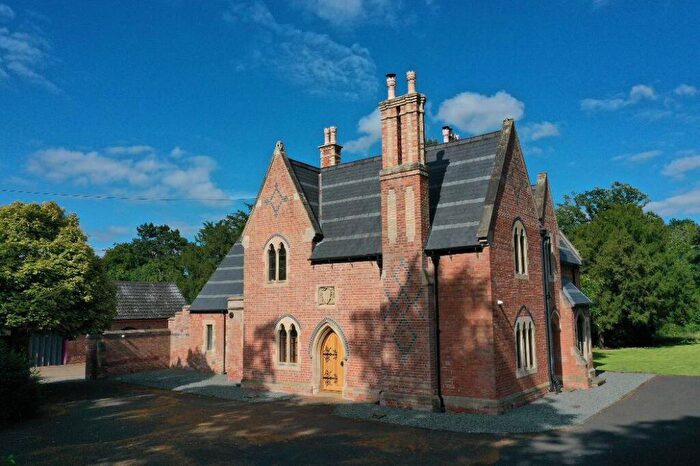
Houses for sale & to rent in Tuxford And Trent, Newark
House Prices in Tuxford And Trent
Properties in Tuxford And Trent have an average house price of £245,923.00 and had 173 Property Transactions within the last 3 years¹.
Tuxford And Trent is an area in Newark, Nottinghamshire with 1,597 households², where the most expensive property was sold for £1,000,000.00.
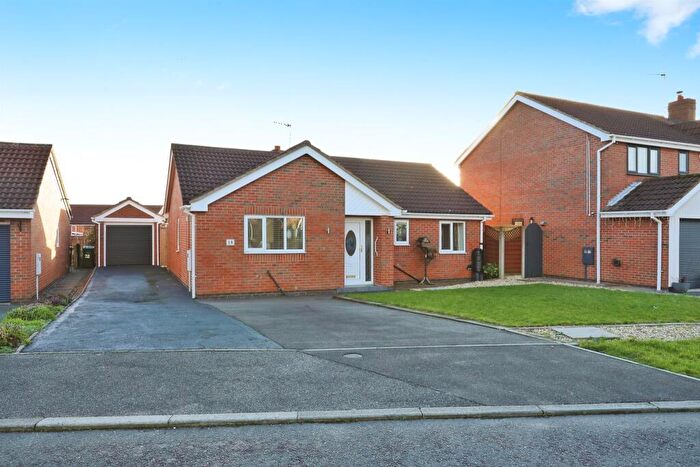
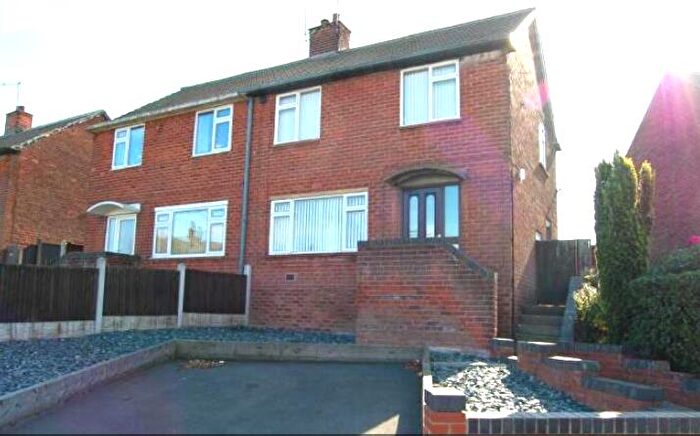
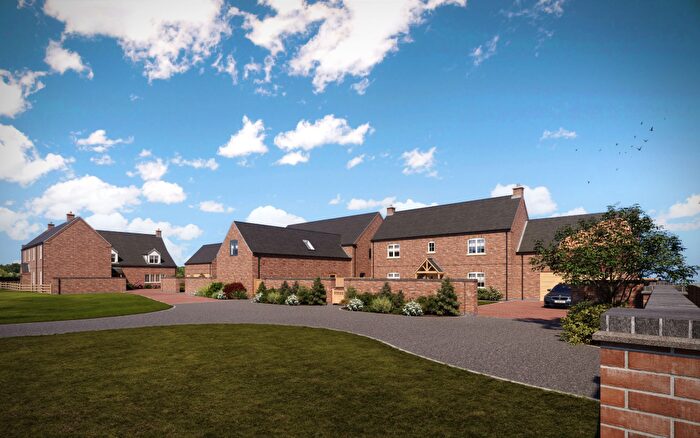
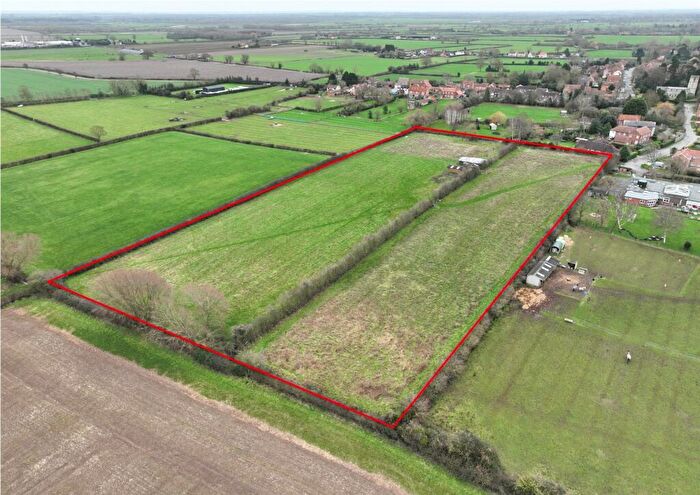
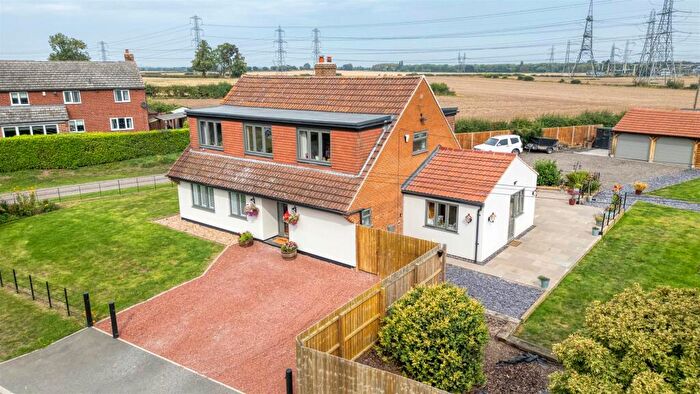
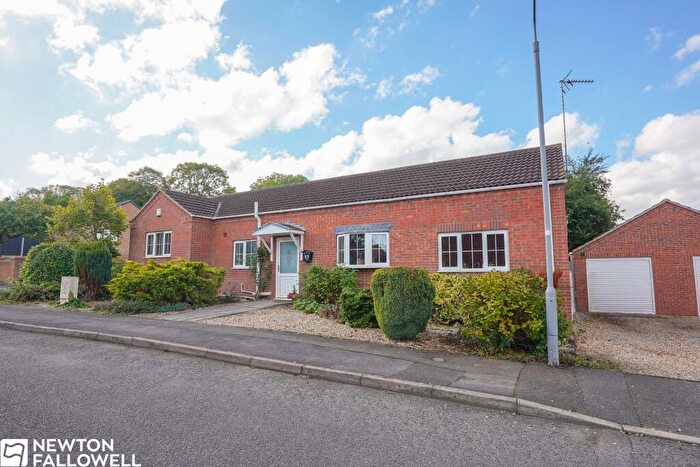
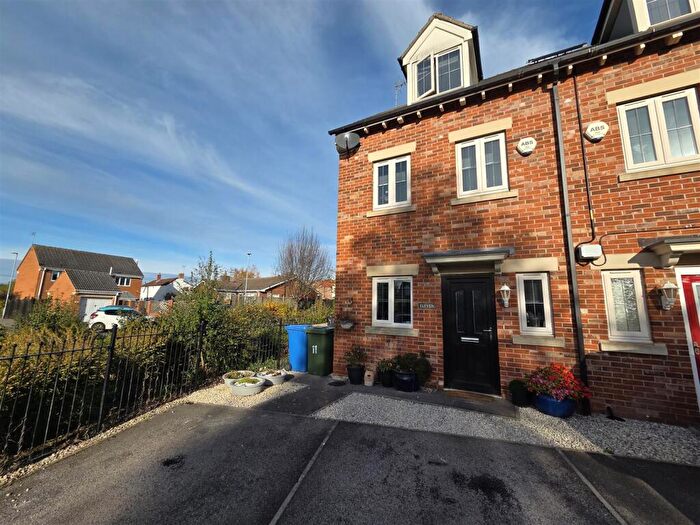
Properties for sale in Tuxford And Trent
Roads and Postcodes in Tuxford And Trent
Navigate through our locations to find the location of your next house in Tuxford And Trent, Newark for sale or to rent.
| Streets | Postcodes |
|---|---|
| America Gardens | NG22 0QE |
| Ash Close | NG22 0WA |
| Ash Vale | NG22 0ND |
| Ashvale Road | NG22 0NH NG22 0JY |
| Aspen Close | NG22 0QA |
| Aspen Court | NG22 0QB |
| Bell Close | NG23 6RZ |
| Bevercotes Lane | NG22 0LQ NG22 0FN |
| Bevercotes Road | NG22 0NN |
| Birch Court | NG22 0NG |
| Birtley Drive | NG22 0FT |
| Blenheim Avenue | NG22 0LR |
| Blue Bell Yard | NG22 0LD |
| Brotts Road | NG23 6RL |
| Burleigh Court | NG22 0LE |
| Burleigh Rise | NG22 0NB |
| Byron Close | NG22 0TG |
| Callerdale Grove | NG22 0FR |
| Capps Place | NG22 0JE |
| Cartwright Close | NG22 0UN |
| Chantry Walk | NG22 0DU |
| Charter Place | NG22 0HY |
| Chequers Lane | NG22 0UD |
| Chestnut Court | NG23 6UD |
| Chestnut Way | NG22 0JX |
| Church Walk | NG22 0TX |
| Clark Lane | NG22 0LZ |
| Clinton Gardens | NG22 0FQ |
| Cocketts Hill | NG22 0UE |
| Coronation Terrace | NG22 0TZ |
| Darlton Road | NG22 0UH NG22 0UJ |
| Dunham Road | NG22 0TA |
| East Gate | NG23 6RN |
| Eastfield Park | NG22 0JW |
| Edenhall Close | NG22 0FS |
| Egmanton Road | NG22 0NR NG22 0LP |
| Eldon Green | NG22 0GZ |
| Eldon Street | NG22 0LB NG22 0LG NG22 0LH |
| Faraday Avenue | NG22 0HT |
| Farhill Lane | NG22 0BX |
| Fleming Avenue | NG22 0HZ |
| Gilbert Avenue | NG22 0JB |
| Grassthorpe Road | NG23 6RG NG23 6RX NG23 6RY |
| Great North Road | NG23 6TZ |
| Hawthorne Leys | NG23 6RE |
| Haynes Close | NG22 0JA |
| Hill Side | NG22 0JJ |
| Hollowgate Lane | NG23 6SF NG23 6UF |
| Horne Lane | NG22 0US |
| Hunters Close | NG23 6SR |
| Landa Grove | NG22 0JG |
| Laneham Road | NG22 0UL NG22 0UW |
| Leach Close | NG22 0UQ |
| Lexington Court | NG22 0NQ |
| Lexington Gardens | NG22 0LX |
| Lincoln Road | NG22 0HP NG22 0HR NG22 0HS NG22 0JN NG22 0JQ NG22 0JL NG22 0JP |
| Linden Avenue | NG22 0JR NG22 0JS |
| Lodge Lane | NG22 0NL |
| Long Lane | NG22 0LS |
| Long Row | NG22 0UX |
| Low Road | NG22 0FJ |
| Machin Close | NG22 0JZ |
| Main Street | NG22 0TY NG22 0UR |
| Manor Grove | NG23 6FJ |
| Maple Close | NG22 0JT |
| Market Place | NG22 0LA NG22 0LL NG22 0LJ |
| Markham Road | NG22 0NP |
| Marnham Road | NG22 0JH NG22 0PY NG22 0PZ NG22 0PX NG23 6SP |
| Mayfair Place | NG22 0JD |
| Mill Lane | NG23 6RW |
| Newark Road | NG22 0NA |
| Newcastle Court | NG22 0GY |
| Newcastle Street | NG22 0LN NG22 0LT NG22 0LW |
| Nicholas Place | NG22 0HU |
| Normanton Road | NG23 6TH NG23 6TQ |
| North Road | NG23 6TG |
| Ollerton Road | NG22 0LF NG22 0PF NG22 0PQ |
| Orchard Crescent | NG22 0LU |
| Peel Avenue | NG22 0LY |
| Pooles Yard | NG23 6UB |
| Retford Road | NG22 0NW |
| Roberts Close | NG22 0UP |
| Skegby Road | NG23 6RR NG23 6RS |
| South Street | NG23 6RH NG23 6RQ |
| Sparrow Lane | NG23 6SH |
| St Oswalds Park | NG22 0UB |
| Tall Gables | NG22 0UG |
| The Beeches | NG22 0NF |
| The Green | NG22 0TU |
| The Hawthornes | NG22 0UA |
| The Pastures | NG22 0NJ |
| Tuxford Road | NG22 0TQ NG23 6RP |
| Upper Row | NG22 0UF |
| Welbeck Place | NG22 0JF NG22 0DX |
| Woodcoates Road | NG22 0TH |
| Woodcotes Lane | NG22 0TJ NG22 0TL NG22 0TN NG22 0TW |
| Woodhouse Place | NG22 0HX |
| NG22 0TF NG22 0UT NG22 0UU NG22 0UY NG22 0UZ NG23 6SA NG23 6SG NG23 6SL NG23 6SN NG22 0TD NG22 0WT NG22 0WY NG23 6RU NG23 6SQ NG22 0FU |
Transport near Tuxford And Trent
- FAQ
- Price Paid By Year
- Property Type Price
Frequently asked questions about Tuxford And Trent
What is the average price for a property for sale in Tuxford And Trent?
The average price for a property for sale in Tuxford And Trent is £245,923. This amount is 2% lower than the average price in Newark. There are 784 property listings for sale in Tuxford And Trent.
What streets have the most expensive properties for sale in Tuxford And Trent?
The streets with the most expensive properties for sale in Tuxford And Trent are Ollerton Road at an average of £676,666, America Gardens at an average of £655,000 and Upper Row at an average of £527,200.
What streets have the most affordable properties for sale in Tuxford And Trent?
The streets with the most affordable properties for sale in Tuxford And Trent are The Pastures at an average of £95,000, Hill Side at an average of £121,000 and Ash Vale at an average of £125,000.
Which train stations are available in or near Tuxford And Trent?
Some of the train stations available in or near Tuxford And Trent are Retford, Collingham and Swinderby.
Property Price Paid in Tuxford And Trent by Year
The average sold property price by year was:
| Year | Average Sold Price | Price Change |
Sold Properties
|
|---|---|---|---|
| 2025 | £219,732 | -22% |
35 Properties |
| 2024 | £267,879 | 14% |
42 Properties |
| 2023 | £229,903 | -13% |
43 Properties |
| 2022 | £258,816 | 15% |
53 Properties |
| 2021 | £218,853 | 3% |
77 Properties |
| 2020 | £211,607 | 21% |
56 Properties |
| 2019 | £166,248 | -25% |
43 Properties |
| 2018 | £207,596 | 4% |
76 Properties |
| 2017 | £199,650 | 6% |
64 Properties |
| 2016 | £188,248 | 5% |
64 Properties |
| 2015 | £179,454 | 11% |
64 Properties |
| 2014 | £159,432 | 3% |
62 Properties |
| 2013 | £155,363 | -2% |
50 Properties |
| 2012 | £158,555 | 0,1% |
49 Properties |
| 2011 | £158,438 | 3% |
49 Properties |
| 2010 | £154,253 | 6% |
38 Properties |
| 2009 | £145,500 | -34% |
27 Properties |
| 2008 | £194,410 | 9% |
35 Properties |
| 2007 | £177,520 | -2% |
62 Properties |
| 2006 | £180,698 | 25% |
90 Properties |
| 2005 | £136,087 | -3% |
79 Properties |
| 2004 | £139,552 | 8% |
65 Properties |
| 2003 | £128,944 | 19% |
78 Properties |
| 2002 | £104,248 | 29% |
80 Properties |
| 2001 | £74,348 | 10% |
75 Properties |
| 2000 | £67,153 | -9% |
48 Properties |
| 1999 | £73,211 | 24% |
57 Properties |
| 1998 | £55,840 | -26% |
48 Properties |
| 1997 | £70,359 | 26% |
47 Properties |
| 1996 | £52,055 | -2% |
39 Properties |
| 1995 | £53,187 | - |
43 Properties |
Property Price per Property Type in Tuxford And Trent
Here you can find historic sold price data in order to help with your property search.
The average Property Paid Price for specific property types in the last three years are:
| Property Type | Average Sold Price | Sold Properties |
|---|---|---|
| Semi Detached House | £196,301.00 | 68 Semi Detached Houses |
| Detached House | £357,171.00 | 68 Detached Houses |
| Terraced House | £139,409.00 | 33 Terraced Houses |
| Flat | £77,000.00 | 4 Flats |

