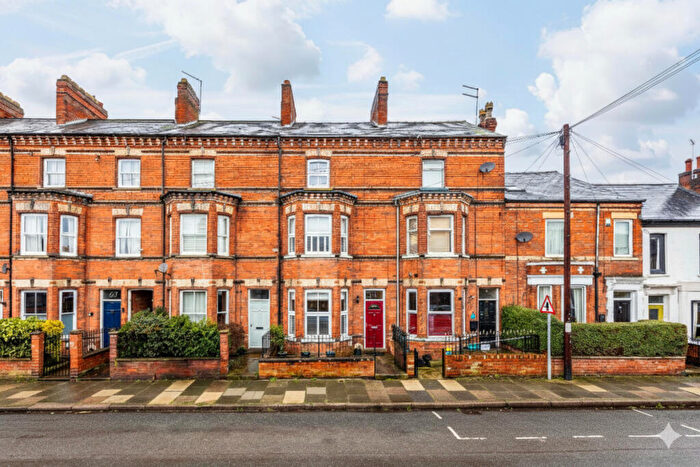
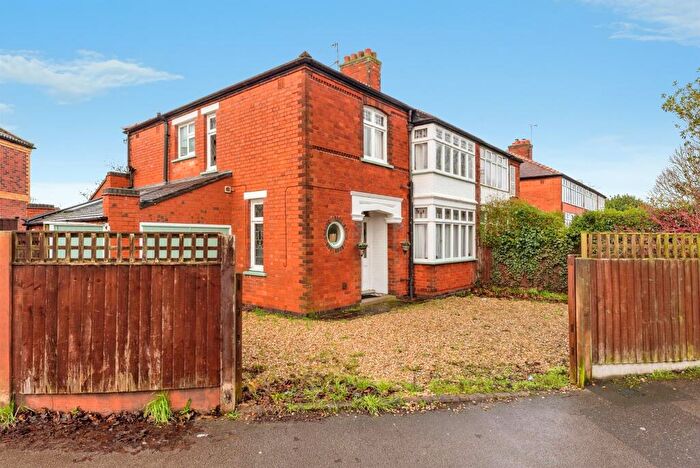
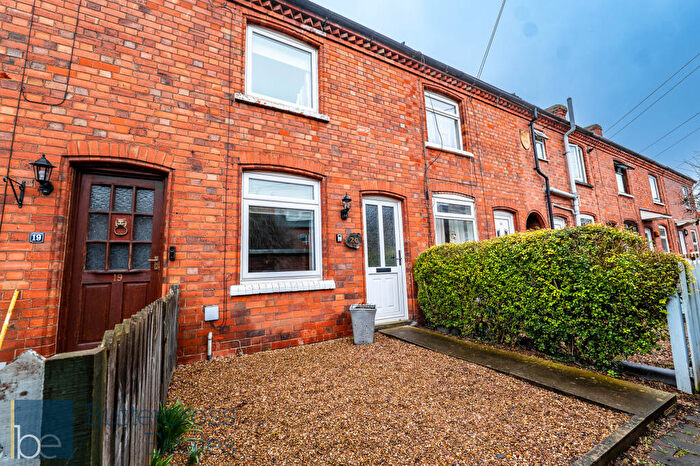
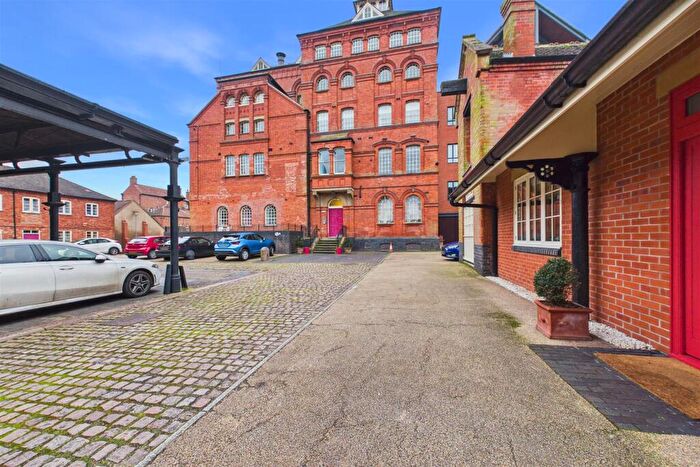
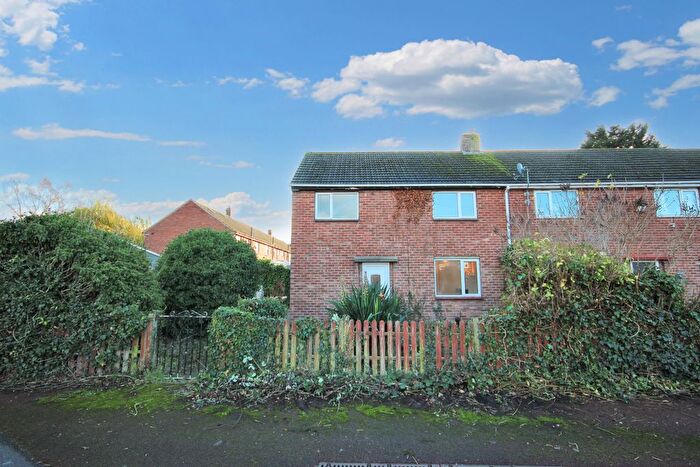
Houses for sale & to rent in Magnus, Newark
House Prices in Magnus
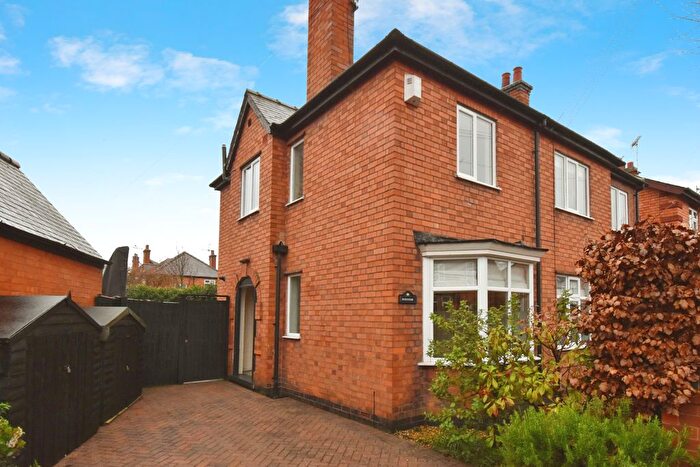
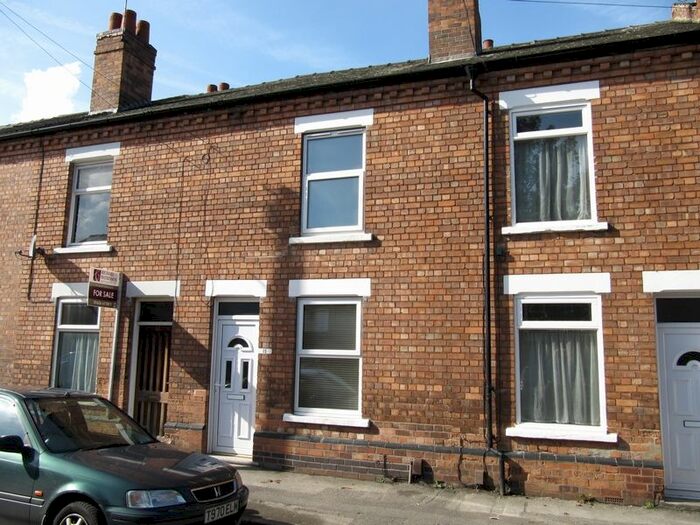
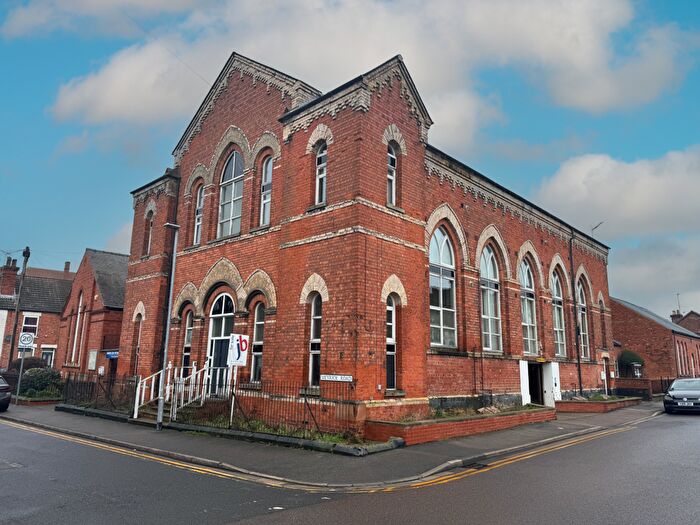
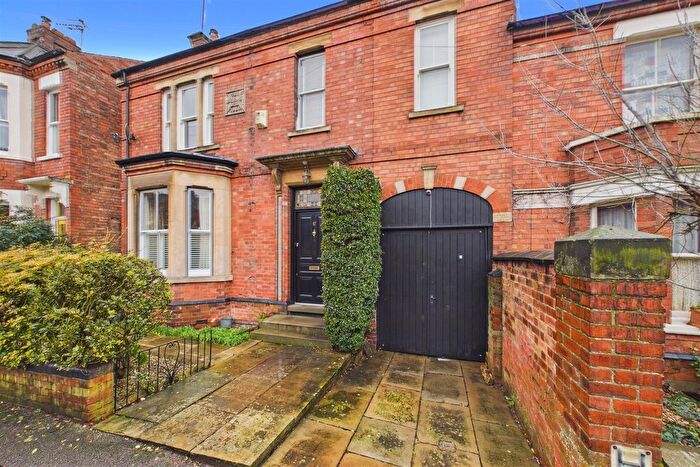
Properties in Magnus have an average house price of £193,238.00 and had 228 Property Transactions within the last 3 years¹.
Magnus is an area in Newark, Nottinghamshire with 2,185 households², where the most expensive property was sold for £540,000.00.
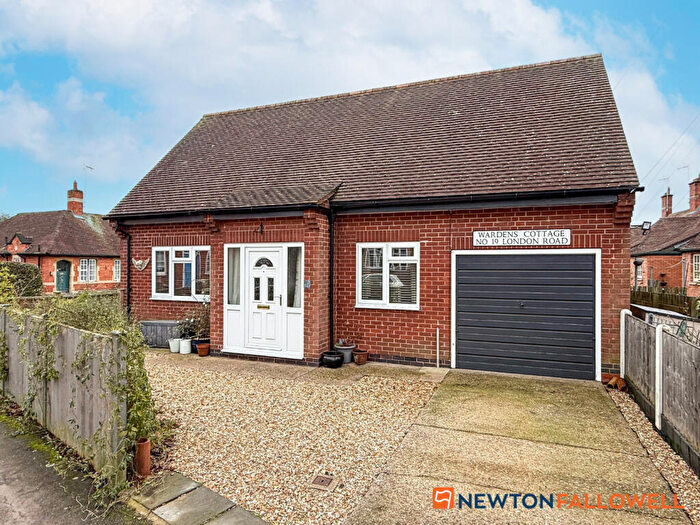
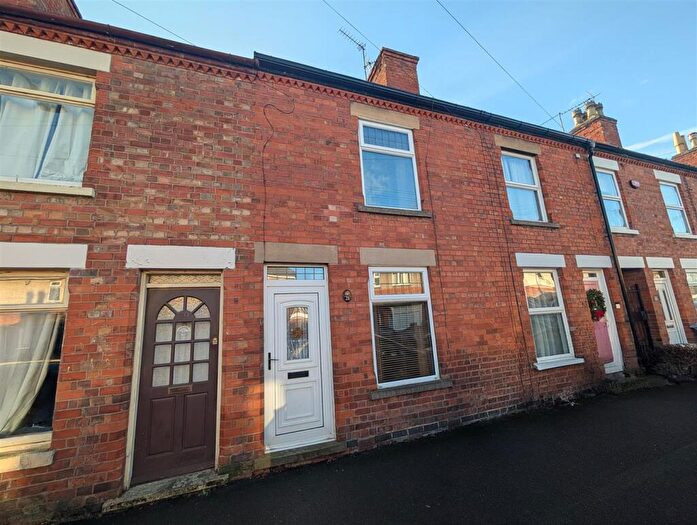
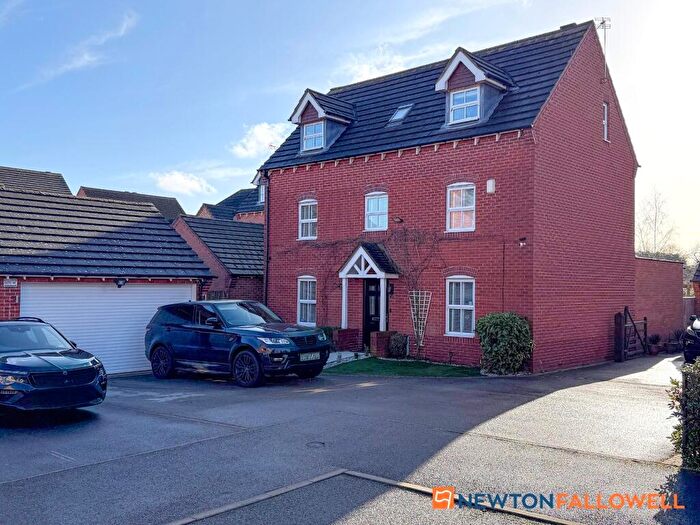
Properties for sale in Magnus
Roads and Postcodes in Magnus
Navigate through our locations to find the location of your next house in Magnus, Newark for sale or to rent.
| Streets | Postcodes |
|---|---|
| Albert Street | NG24 4BJ |
| Albion Street | NG24 4BL |
| Appleton Gate | NG24 1JY |
| Bailey Road | NG24 4EW |
| Balderton Gate | NG24 1UE NG24 1UN |
| Bancroft Road | NG24 1SF NG24 1SJ |
| Barnby Gate | NG24 1PX NG24 1PZ NG24 1QD |
| Bede House Court | NG24 1PU |
| Bede House Lane | NG24 1PY |
| Beech Avenue | NG24 4DY |
| Beeston Road | NG24 1SN |
| Belvoir Crescent | NG24 4DW |
| Bentinck Road | NG24 4HT |
| Boundary Road | NG24 4AJ NG24 4AL NG24 4AS NG24 4AT NG24 4DZ NG24 4EA |
| Bowbridge Road | NG24 4BY NG24 4BZ NG24 4DF NG24 4DG NG24 4DQ NG24 4EG |
| Bromley Avenue | NG24 4DS |
| Byron Close | NG24 4DX |
| Carlton Road | NG24 4HD NG24 4HE |
| Carter Gate | NG24 1UA |
| Castle Brewery | NG24 4AF NG24 4FF |
| Castle Brewery Court | NG24 4ED |
| Cavendish Avenue | NG24 4DP |
| Chatham Court | NG24 4BH |
| Chatsworth Road | NG24 4EY |
| Chestnut Copse | NG24 1RX |
| Clayton Close | NG24 4HN |
| Cleveland Square | NG24 4HQ |
| Clumber Avenue | NG24 4DT |
| Dunholme Avenue | NG24 4AR |
| Earp Avenue | NG24 4DD |
| Elm Avenue | NG24 1SE NG24 1SW |
| Elm Close | NG24 1SG |
| Falstone Avenue | NG24 1SH |
| Friary Gardens | NG24 1JH |
| George Street | NG24 1LA |
| Gladstone Road | NG24 4HZ |
| Gopher Road | NG24 4HH |
| Granby Avenue | NG24 4DR |
| Guildhall Street | NG24 1UH NG24 1UP |
| Hardwick Avenue | NG24 4AW |
| Harewood Avenue | NG24 4AN NG24 4BE |
| Hatton Gardens | NG24 4BU NG24 4BX |
| Holden Crescent | NG24 4HU |
| Jubilee Street | NG24 4DA |
| Lime Grove | NG24 4AG NG24 4AH NG24 4AQ |
| London Road | NG24 1SB NG24 1SP NG24 1SQ NG24 1TF NG24 1TS NG24 1TW |
| Magnus Street | NG24 1LB |
| Marton Road | NG24 1SL |
| Milner Street | NG24 4AA |
| Montgomery Road | NG24 4HA |
| Newcastle Avenue | NG24 4DN |
| Quibell Road | NG24 4HB |
| Robins Court | NG24 1QG |
| Rufford Avenue | NG24 4BD |
| Rupert Crescent | NG24 4AP |
| Rutland Avenue | NG24 4DL |
| Salisbury Road | NG24 4HY |
| Southend Avenue | NG24 4BG |
| Staunton Road | NG24 4EX NG24 4EZ |
| Sydney Terrace | NG24 4DB |
| The Crescent | NG24 4DU |
| The Croft | NG24 1QE |
| The Orchard | NG24 1SZ |
| The Park | NG24 1SD |
| Thoresby Avenue | NG24 4DJ |
| Victoria Gardens | NG24 1UL |
| Walker Close | NG24 4BP |
| Willis Road | NG24 4HF |
| Winchilsea Avenue | NG24 4AD |
| Windsor Road | NG24 4HS |
Transport near Magnus
- FAQ
- Price Paid By Year
- Property Type Price
Frequently asked questions about Magnus
What is the average price for a property for sale in Magnus?
The average price for a property for sale in Magnus is £193,238. This amount is 22% lower than the average price in Newark. There are 1,353 property listings for sale in Magnus.
What streets have the most expensive properties for sale in Magnus?
The streets with the most expensive properties for sale in Magnus are Chestnut Copse at an average of £490,000, The Park at an average of £470,000 and Magnus Street at an average of £436,666.
What streets have the most affordable properties for sale in Magnus?
The streets with the most affordable properties for sale in Magnus are Robins Court at an average of £65,000, Victoria Gardens at an average of £82,500 and Castle Brewery Court at an average of £99,785.
Which train stations are available in or near Magnus?
Some of the train stations available in or near Magnus are Newark Castle, Newark North Gate and Rolleston.
Property Price Paid in Magnus by Year
The average sold property price by year was:
| Year | Average Sold Price | Price Change |
Sold Properties
|
|---|---|---|---|
| 2025 | £199,674 | 3% |
57 Properties |
| 2024 | £193,499 | 2% |
83 Properties |
| 2023 | £188,823 | -3% |
88 Properties |
| 2022 | £194,300 | 3% |
84 Properties |
| 2021 | £188,113 | 9% |
108 Properties |
| 2020 | £170,312 | -2% |
91 Properties |
| 2019 | £173,827 | 5% |
84 Properties |
| 2018 | £165,243 | 11% |
85 Properties |
| 2017 | £147,376 | -7% |
80 Properties |
| 2016 | £157,210 | 15% |
108 Properties |
| 2015 | £133,527 | -1% |
99 Properties |
| 2014 | £134,313 | 1% |
100 Properties |
| 2013 | £133,609 | 2% |
96 Properties |
| 2012 | £131,342 | 11% |
72 Properties |
| 2011 | £116,392 | -2% |
78 Properties |
| 2010 | £118,616 | -9% |
73 Properties |
| 2009 | £129,640 | -9% |
67 Properties |
| 2008 | £141,482 | 4% |
63 Properties |
| 2007 | £136,091 | 8% |
129 Properties |
| 2006 | £125,225 | 4% |
127 Properties |
| 2005 | £120,291 | 0,1% |
97 Properties |
| 2004 | £120,115 | 12% |
136 Properties |
| 2003 | £105,105 | 14% |
124 Properties |
| 2002 | £90,251 | 28% |
135 Properties |
| 2001 | £64,844 | 15% |
103 Properties |
| 2000 | £55,091 | 8% |
119 Properties |
| 1999 | £50,487 | 0,5% |
119 Properties |
| 1998 | £50,235 | 12% |
87 Properties |
| 1997 | £44,328 | -6% |
89 Properties |
| 1996 | £47,087 | 7% |
80 Properties |
| 1995 | £43,890 | - |
57 Properties |
Property Price per Property Type in Magnus
Here you can find historic sold price data in order to help with your property search.
The average Property Paid Price for specific property types in the last three years are:
| Property Type | Average Sold Price | Sold Properties |
|---|---|---|
| Semi Detached House | £217,267.00 | 98 Semi Detached Houses |
| Detached House | £334,687.00 | 16 Detached Houses |
| Terraced House | £158,117.00 | 74 Terraced Houses |
| Flat | £142,762.00 | 40 Flats |

