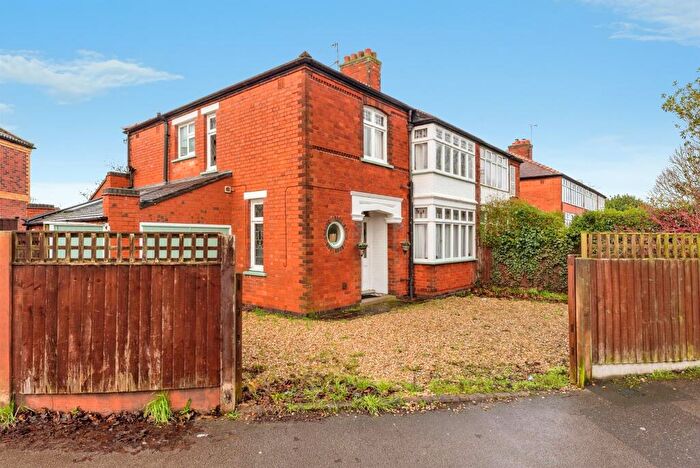
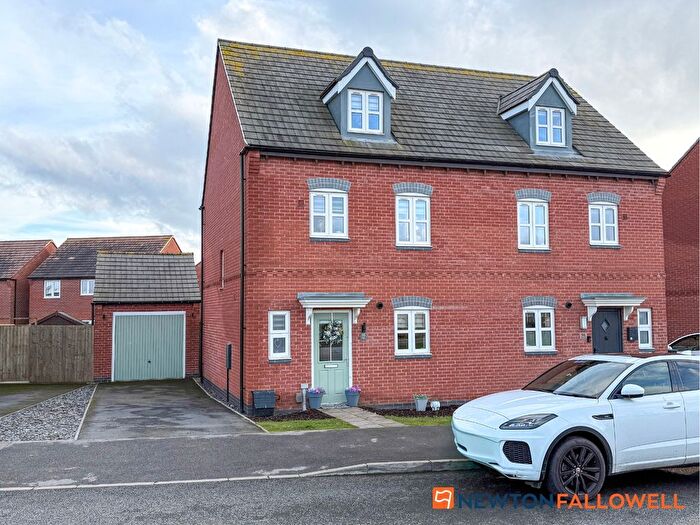
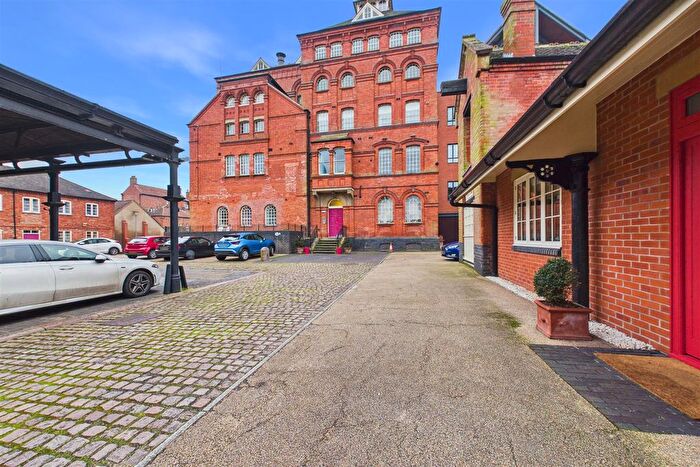
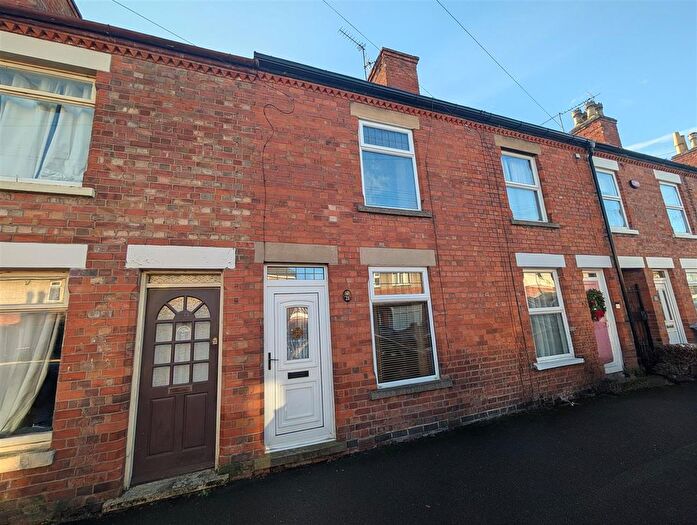
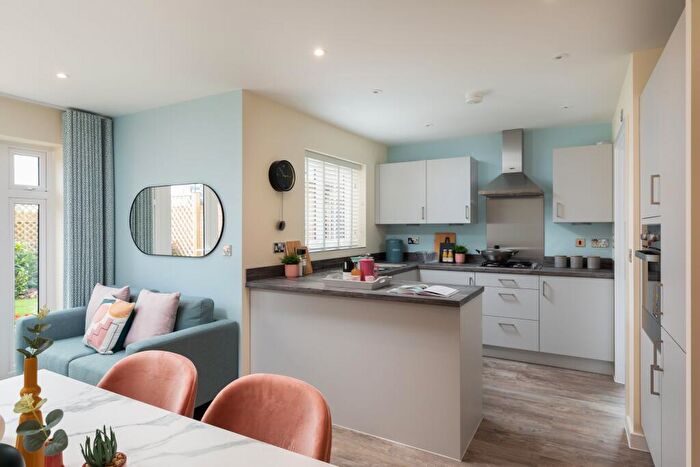
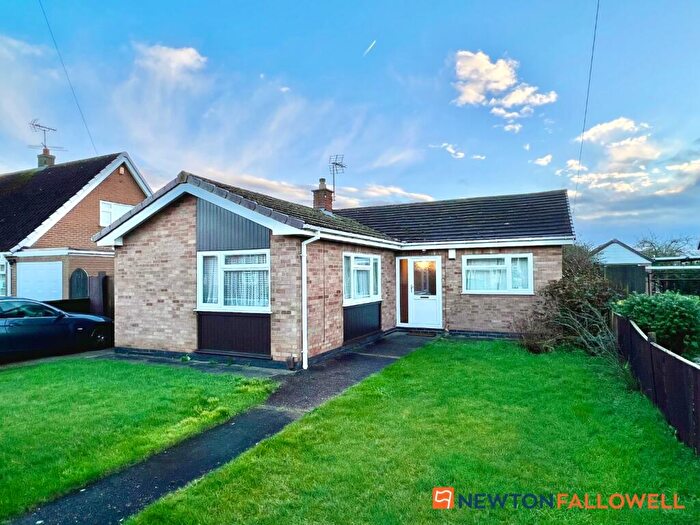
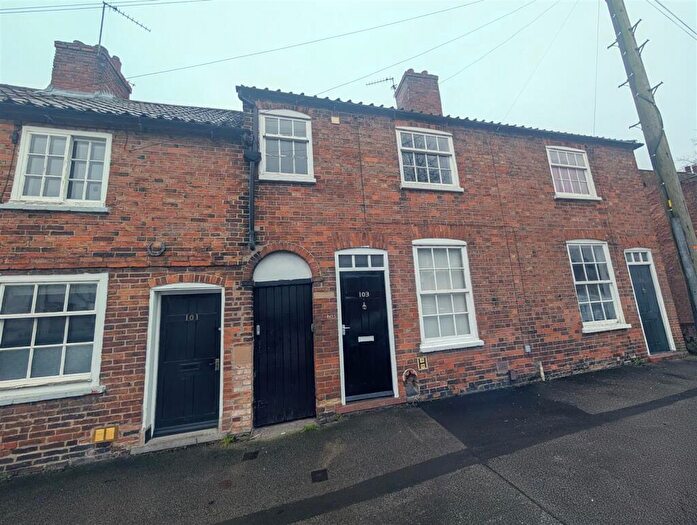
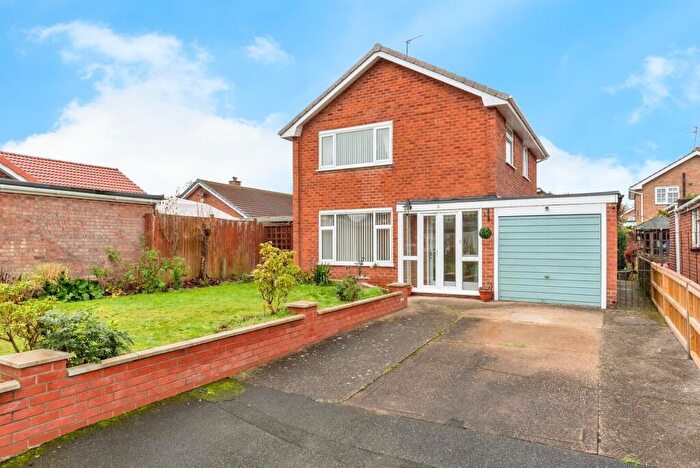
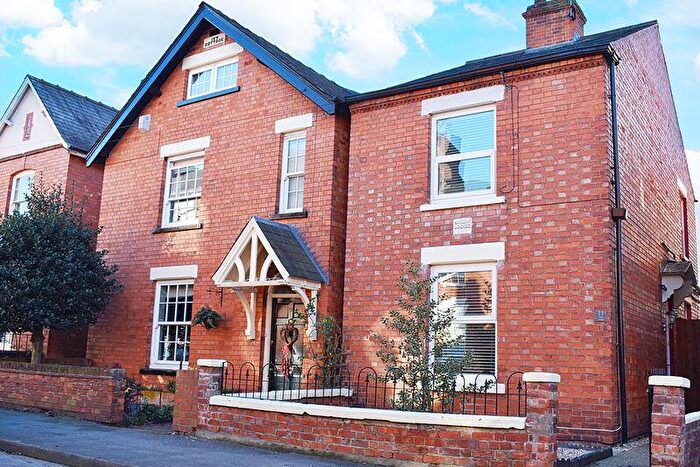
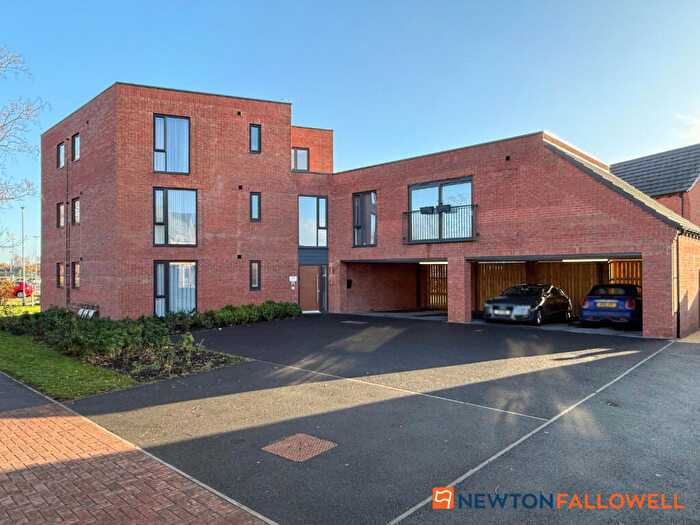
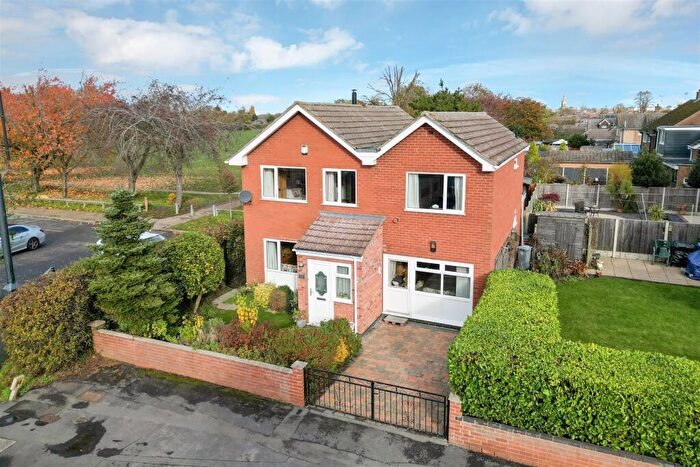
Houses for sale & to rent in Devon, Newark
House Prices in Devon
Properties in Devon have an average house price of £184,615.00 and had 165 Property Transactions within the last 3 years¹.
Devon is an area in Newark, Nottinghamshire with 2,445 households², where the most expensive property was sold for £460,000.00.
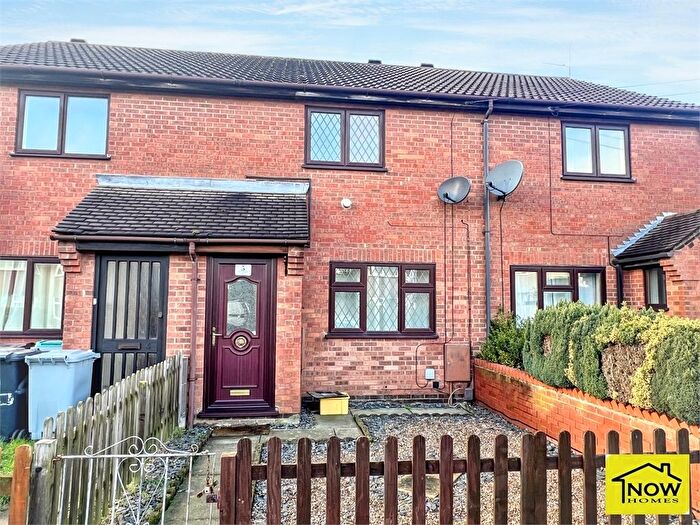
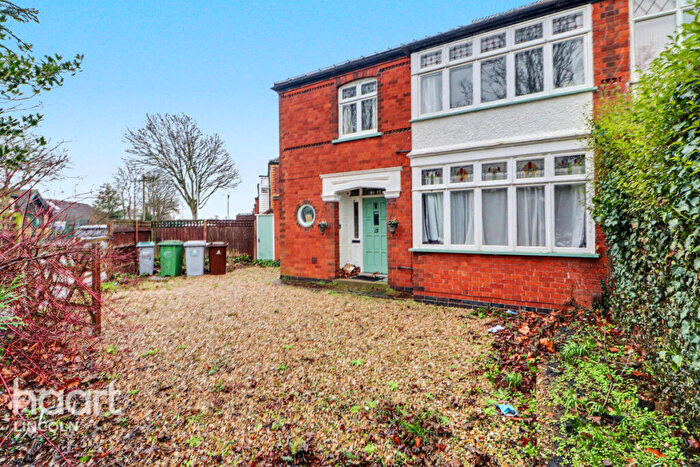
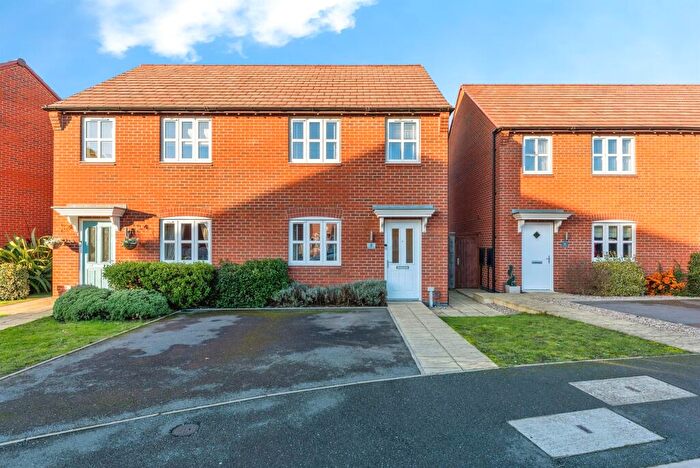
Properties for sale in Devon
Roads and Postcodes in Devon
Navigate through our locations to find the location of your next house in Devon, Newark for sale or to rent.
| Streets | Postcodes |
|---|---|
| Ash Road | NG24 4LQ |
| Bailey Road | NG24 4EP |
| Barker Way | NG24 4BF |
| Beech Avenue | NG24 4JN |
| Bellmond Close | NG24 4ER |
| Bevercotes Close | NG24 4JT |
| Bowbridge Road | NG24 4EF NG24 4EL |
| Broughton Drive | NG24 4PX |
| Cardinal Hinsley Close | NG24 4NQ |
| Carlton Close | NG24 4HG |
| Carswell Close | NG24 4HW |
| Chantry Close | NG24 4JZ |
| Cherry Holt | NG24 4JU NG24 4JX NG24 4JY NG24 4LA |
| Churchill Drive | NG24 4LU NG24 4ND NG24 4NG NG24 4NT |
| Clarke Avenue | NG24 4NY |
| Cleveland Square | NG24 4HJ NG24 4HL |
| College Close | NG24 4GA |
| Cranmer Road | NG24 4ET NG24 4EU |
| De Caldwell Drive | NG24 4JS |
| Devon Road | NG24 4JL NG24 4JP NG24 4JW |
| Elizabeth Road | NG24 4NP NG24 4NR |
| Eton Avenue | NG24 4JB NG24 4JD NG24 4JF NG24 4JH NG24 4JJ |
| Eton Close | NG24 4JR |
| Fairfax Avenue | NG24 4PQ |
| Forster Avenue | NG24 4PF |
| Friars Crescent | NG24 4LY |
| Gorse Road | NG24 4LZ |
| Grange Road | NG24 4LE NG24 4LH NG24 4LN NG24 4LP NG24 4LR NG24 4LS NG24 4LT NG24 4PL NG24 4PN NG24 4PP NG24 4PW NG24 4LF NG24 4LG NG24 4LJ NG24 4LL NG24 4LW NG24 4NL |
| Greenway | NG24 4JE |
| Hawton Road | NG24 4QA NG24 4QE NG24 4QG NG24 4RQ |
| Jersey Street | NG24 4NE |
| Langdale Close | NG24 4PG |
| Larkfields | NG24 4NW |
| Lilac Close | NG24 4LD |
| Lindsay Avenue | NG24 4LB |
| London Road | NG24 1TT |
| Maple Grove | NG24 4NB |
| Meldrum Crescent | NG24 4NZ |
| Mercia Road | NG24 4NA |
| Orston Avenue | NG24 4NS |
| Philip Road | NG24 4LX NG24 4PB NG24 4PD NG24 4PE |
| Pierson Street | NG24 4JG |
| Prebble Close | NG24 4NN |
| Saucemere Drive | NG24 4HR |
| Shelton Avenue | NG24 4NX |
| St Marys Gardens | NG24 4JQ |
| Stoke Avenue | NG24 4PH |
| Sutton Avenue | NG24 4PA |
| Sycamore Close | NG24 4ES |
| The Twitchell | NG24 4NU |
| Thorpe Close | NG24 4PJ |
| Trinity Road | NG24 4EN |
| Vale View | NG24 4PR |
| Wentworth Corner | NG24 4PS |
| Windsor Avenue | NG24 4JA |
| Windsor Road | NG24 4HX |
| Winston Court | NG24 4NF |
| NG24 4FJ NG24 4FN |
Transport near Devon
- FAQ
- Price Paid By Year
- Property Type Price
Frequently asked questions about Devon
What is the average price for a property for sale in Devon?
The average price for a property for sale in Devon is £184,615. This amount is 26% lower than the average price in Newark. There are 985 property listings for sale in Devon.
What streets have the most expensive properties for sale in Devon?
The streets with the most expensive properties for sale in Devon are Saucemere Drive at an average of £381,000, Hawton Road at an average of £304,153 and Windsor Avenue at an average of £274,000.
What streets have the most affordable properties for sale in Devon?
The streets with the most affordable properties for sale in Devon are Ash Road at an average of £72,333, College Close at an average of £82,500 and Forster Avenue at an average of £102,500.
Which train stations are available in or near Devon?
Some of the train stations available in or near Devon are Newark Castle, Newark North Gate and Rolleston.
Property Price Paid in Devon by Year
The average sold property price by year was:
| Year | Average Sold Price | Price Change |
Sold Properties
|
|---|---|---|---|
| 2025 | £196,558 | 5% |
43 Properties |
| 2024 | £187,543 | 7% |
59 Properties |
| 2023 | £173,721 | -1% |
63 Properties |
| 2022 | £176,281 | 5% |
66 Properties |
| 2021 | £167,256 | 13% |
79 Properties |
| 2020 | £146,172 | 7% |
55 Properties |
| 2019 | £136,311 | -4% |
72 Properties |
| 2018 | £141,565 | 5% |
64 Properties |
| 2017 | £134,657 | 8% |
73 Properties |
| 2016 | £123,516 | -4% |
71 Properties |
| 2015 | £128,730 | 5% |
54 Properties |
| 2014 | £122,190 | 5% |
84 Properties |
| 2013 | £115,729 | 5% |
46 Properties |
| 2012 | £110,478 | 16% |
48 Properties |
| 2011 | £92,577 | -17% |
41 Properties |
| 2010 | £108,431 | -0,2% |
40 Properties |
| 2009 | £108,601 | -4% |
34 Properties |
| 2008 | £112,974 | -14% |
46 Properties |
| 2007 | £128,798 | 10% |
94 Properties |
| 2006 | £116,031 | 8% |
94 Properties |
| 2005 | £106,255 | -3% |
66 Properties |
| 2004 | £109,573 | 13% |
127 Properties |
| 2003 | £95,164 | 28% |
134 Properties |
| 2002 | £68,755 | 29% |
92 Properties |
| 2001 | £48,585 | -5% |
70 Properties |
| 2000 | £51,216 | 16% |
59 Properties |
| 1999 | £42,789 | -23% |
46 Properties |
| 1998 | £52,712 | 15% |
47 Properties |
| 1997 | £44,833 | 11% |
55 Properties |
| 1996 | £39,780 | -3% |
36 Properties |
| 1995 | £40,970 | - |
34 Properties |
Property Price per Property Type in Devon
Here you can find historic sold price data in order to help with your property search.
The average Property Paid Price for specific property types in the last three years are:
| Property Type | Average Sold Price | Sold Properties |
|---|---|---|
| Semi Detached House | £176,799.00 | 80 Semi Detached Houses |
| Detached House | £274,412.00 | 29 Detached Houses |
| Terraced House | £162,172.00 | 47 Terraced Houses |
| Flat | £81,944.00 | 9 Flats |

