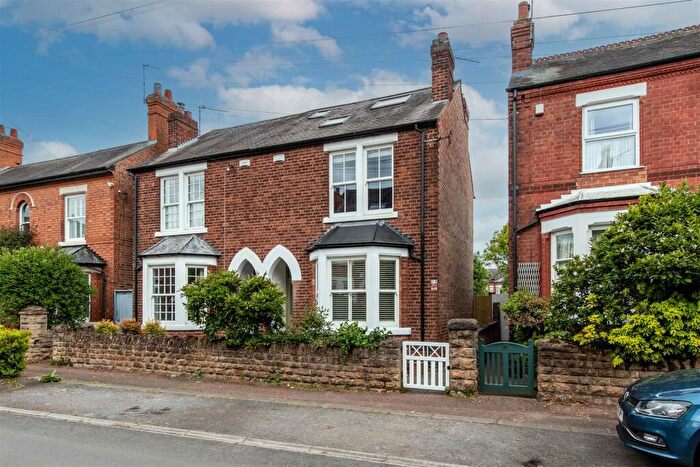
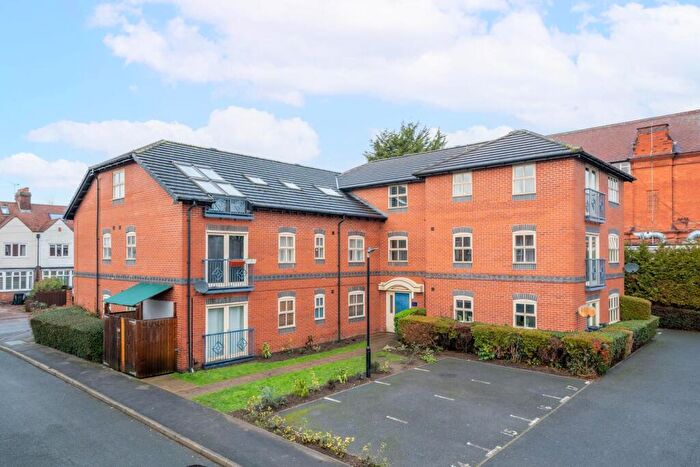
Houses for sale & to rent in Abbey, Nottingham
House Prices in Abbey
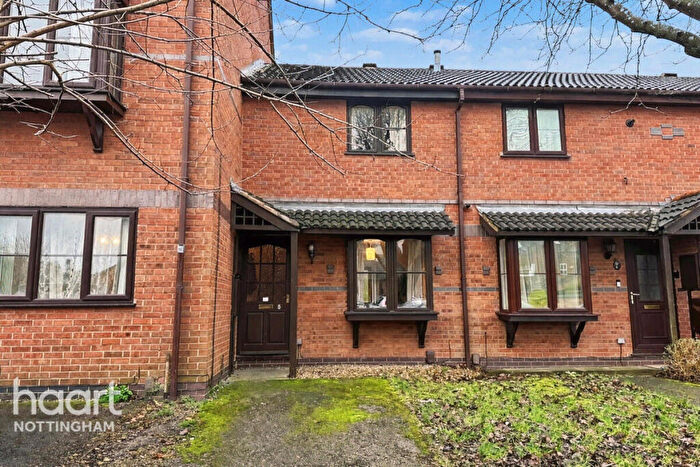
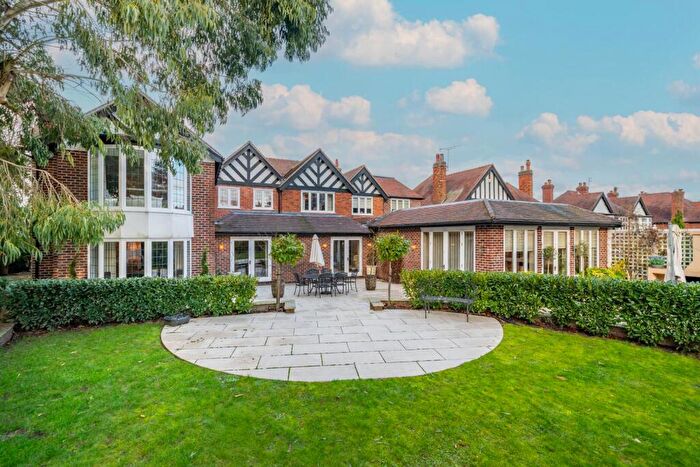
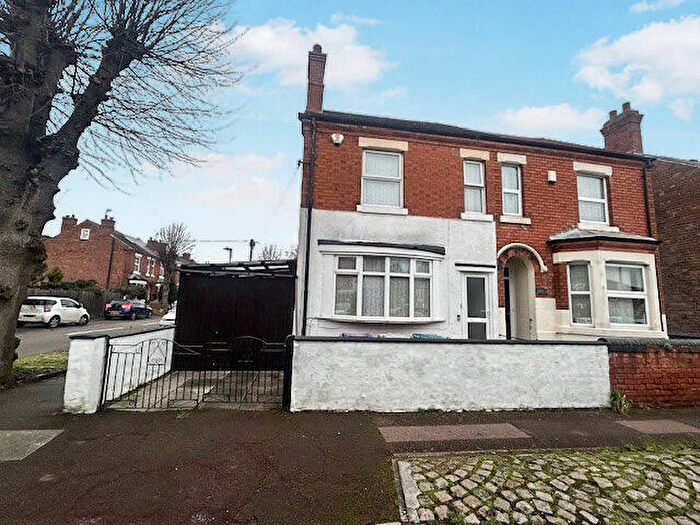
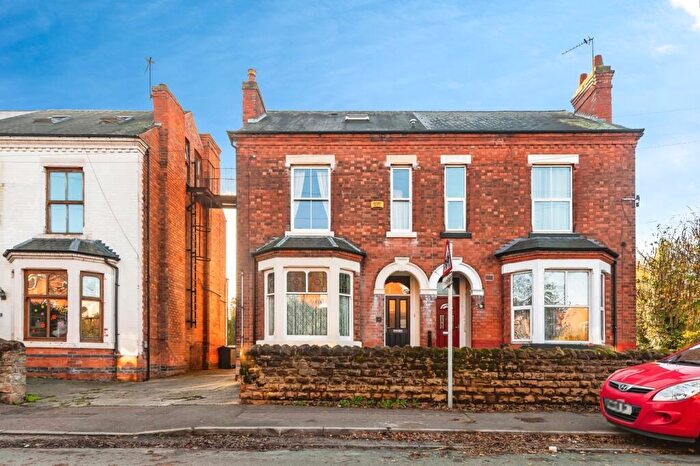
Properties in Abbey have an average house price of £417,651.00 and had 171 Property Transactions within the last 3 years¹.
Abbey is an area in Nottingham, Nottinghamshire with 1,877 households², where the most expensive property was sold for £1,390,000.00.
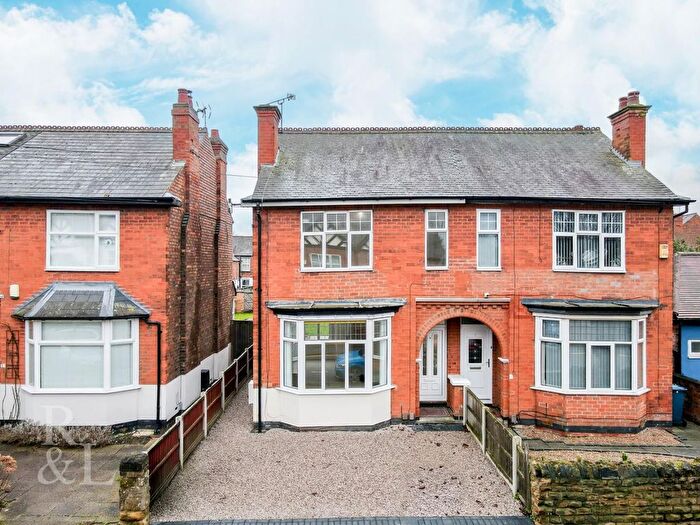
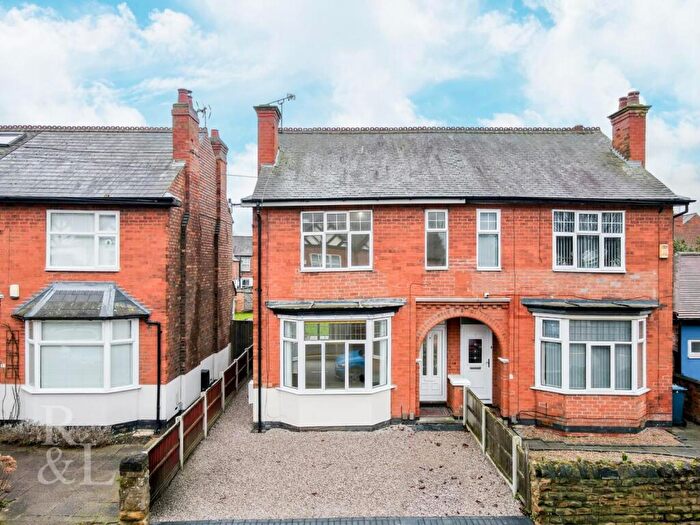
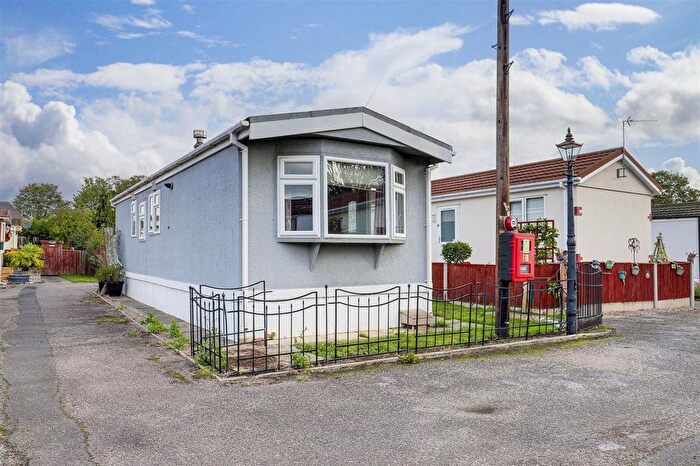
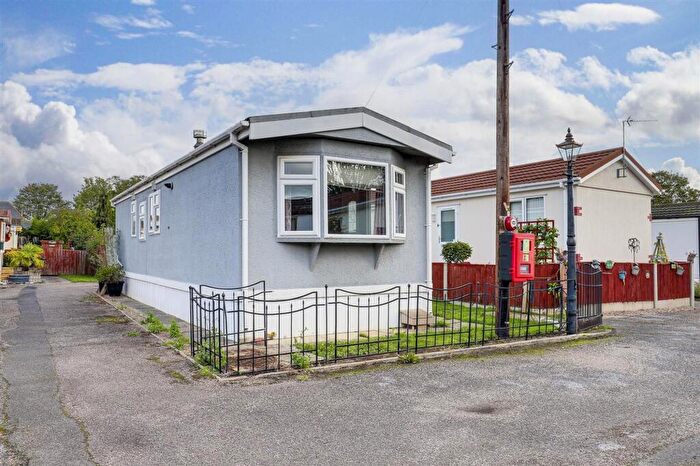
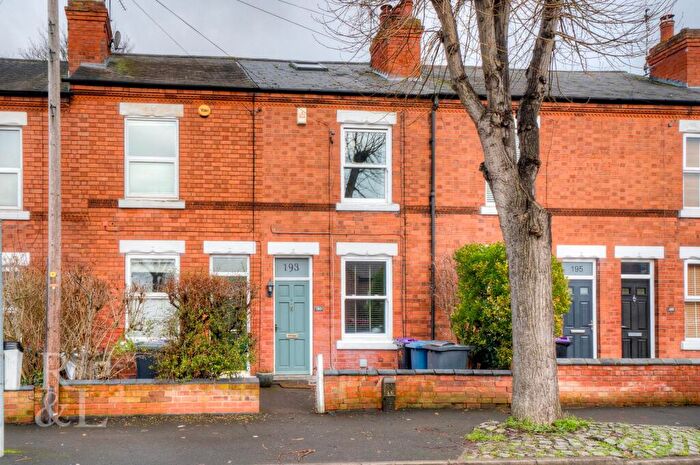
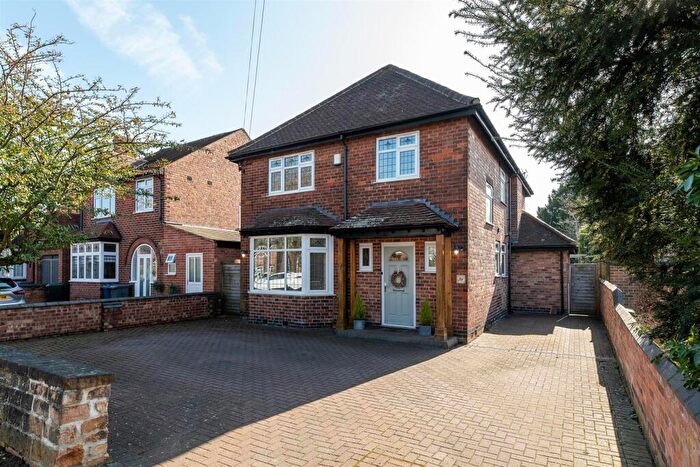
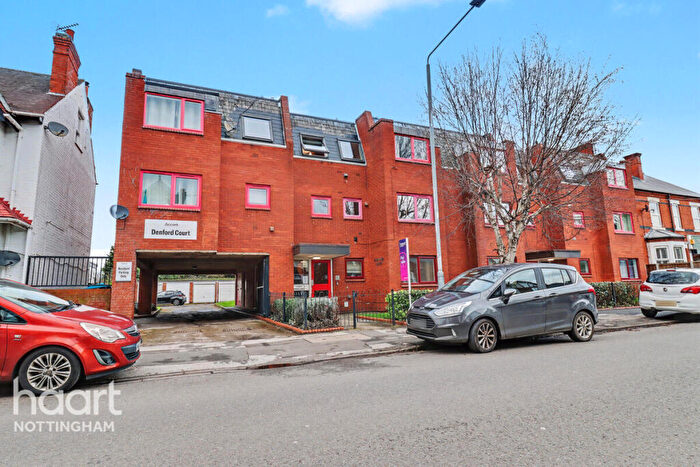
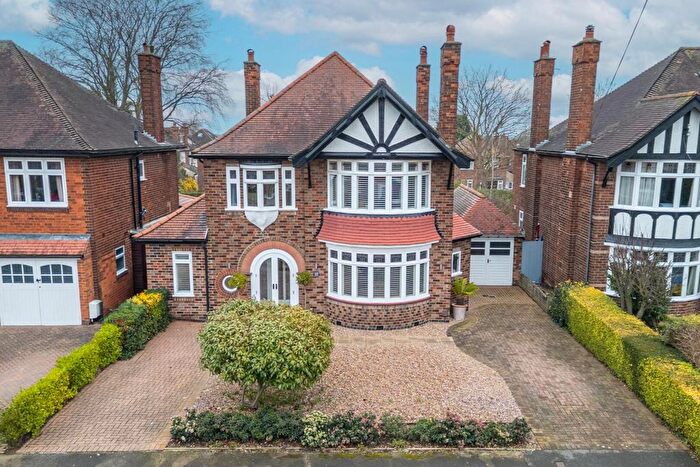
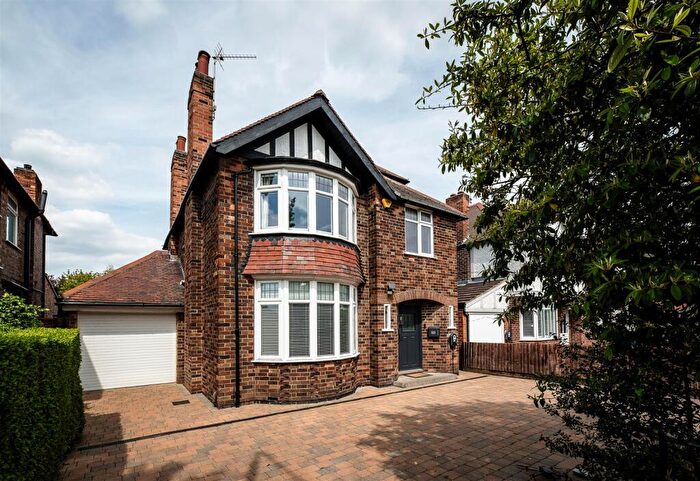
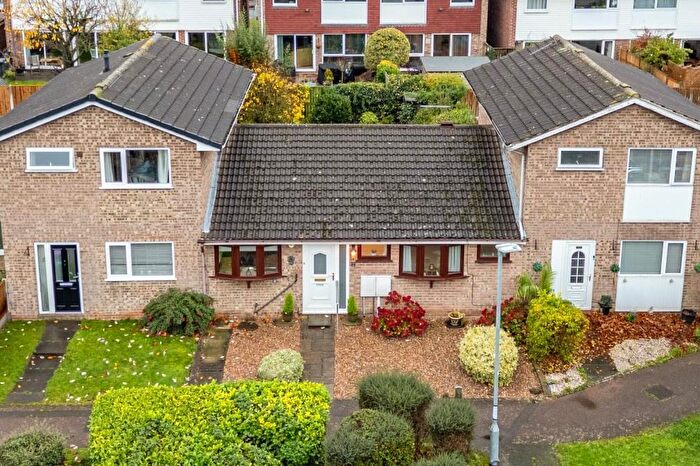
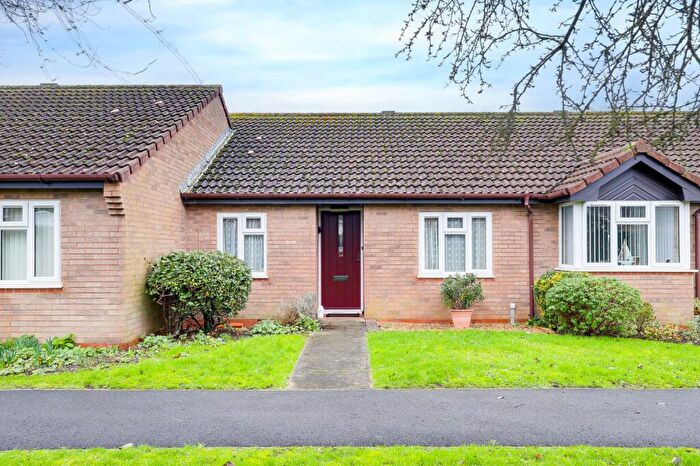
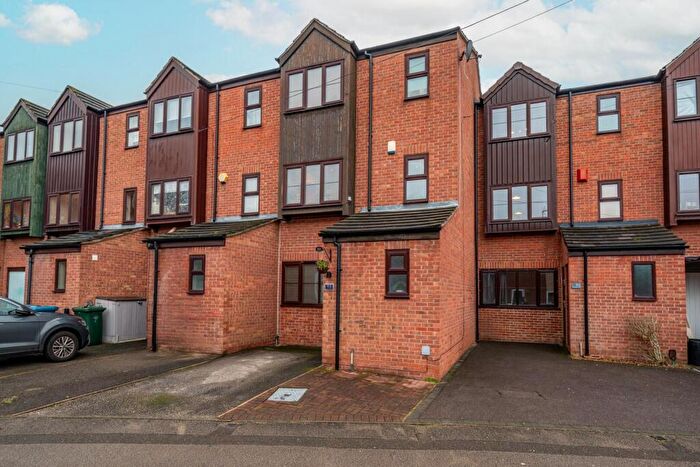
Properties for sale in Abbey
Roads and Postcodes in Abbey
Navigate through our locations to find the location of your next house in Abbey, Nottingham for sale or to rent.
| Streets | Postcodes |
|---|---|
| Abbey Circus | NG2 5LY |
| Abbey Road | NG2 5HB NG2 5NB NG2 5ND NG2 5NE NG2 5NF NG2 5NG |
| Abingdon Road | NG2 5JR |
| Albert Road | NG2 5GS |
| Bisham Drive | NG2 6LT |
| Blake Road | NG2 5JJ NG2 5JL NG2 5JZ NG2 5LA NG2 5LB NG2 5LD |
| Bolton Close | NG2 6LQ |
| Brockley Road | NG2 5JY |
| Buckfast Way | NG2 6LN |
| Burleigh Road | NG2 6FQ |
| Cambridge Road | NG2 5LZ NG2 5NA |
| Cyril Road | NG2 5HT NG2 5JW |
| Dale Close | NG2 6LH |
| Davies Road | NG2 5HY NG2 5HZ NG2 5JA NG2 5JB NG2 5JD NG2 5JE |
| Dunster Road | NG2 6JF |
| Eltham Road | NG2 5JN NG2 5JP NG2 5JS NG2 5JT NG2 5JU NG2 5JX |
| Florence Road | NG2 5HR NG2 5HS |
| Fountains Close | NG2 6LL |
| Furness Close | NG2 6LR |
| Gardens Court | NG2 5LF |
| Gordon Road | NG2 5LL NG2 5LQ NG2 5LX |
| Hexham Close | NG2 6LP |
| Mabel Grove | NG2 5GT |
| Mayflower Close | NG2 5LE |
| Mountsorrel Drive | NG2 6LJ |
| Nearsby Drive | NG2 6LA NG2 6LB |
| Newstead Drive | NG2 6LF NG2 6LG |
| Oxford Road | NG2 5JQ |
| Priory Road | NG2 5HU NG2 5HW NG2 5HX |
| Radcliffe Road | NG2 5HD NG2 5HE NG2 5HF |
| Rodney Road | NG2 6JJ |
| Rufford Way | NG2 6LS |
| Tewkesbury Close | NG2 5NH |
| Trevor Road | NG2 6FS |
| Violet Road | NG2 5HA |
| Waltham Close | NG2 6LD NG2 6LE |
Transport near Abbey
- FAQ
- Price Paid By Year
- Property Type Price
Frequently asked questions about Abbey
What is the average price for a property for sale in Abbey?
The average price for a property for sale in Abbey is £417,651. This amount is 48% higher than the average price in Nottingham. There are 915 property listings for sale in Abbey.
What streets have the most expensive properties for sale in Abbey?
The streets with the most expensive properties for sale in Abbey are Priory Road at an average of £925,111, Fountains Close at an average of £650,000 and Florence Road at an average of £647,200.
What streets have the most affordable properties for sale in Abbey?
The streets with the most affordable properties for sale in Abbey are Gardens Court at an average of £192,916, Radcliffe Road at an average of £195,090 and Mayflower Close at an average of £234,499.
Which train stations are available in or near Abbey?
Some of the train stations available in or near Abbey are Nottingham, Netherfield and Carlton.
Property Price Paid in Abbey by Year
The average sold property price by year was:
| Year | Average Sold Price | Price Change |
Sold Properties
|
|---|---|---|---|
| 2025 | £417,705 | -2% |
35 Properties |
| 2024 | £424,975 | 4% |
70 Properties |
| 2023 | £409,855 | 1% |
66 Properties |
| 2022 | £405,805 | 4% |
77 Properties |
| 2021 | £389,296 | 7% |
81 Properties |
| 2020 | £363,526 | 8% |
67 Properties |
| 2019 | £335,518 | 4% |
72 Properties |
| 2018 | £320,860 | -10% |
67 Properties |
| 2017 | £352,075 | 10% |
57 Properties |
| 2016 | £317,491 | 14% |
83 Properties |
| 2015 | £273,777 | 12% |
80 Properties |
| 2014 | £239,664 | -3% |
73 Properties |
| 2013 | £247,270 | 6% |
79 Properties |
| 2012 | £232,735 | 2% |
67 Properties |
| 2011 | £228,765 | -3% |
75 Properties |
| 2010 | £236,404 | 1% |
75 Properties |
| 2009 | £233,818 | 13% |
79 Properties |
| 2008 | £202,888 | -14% |
52 Properties |
| 2007 | £231,106 | 5% |
94 Properties |
| 2006 | £220,251 | 5% |
109 Properties |
| 2005 | £209,788 | 9% |
101 Properties |
| 2004 | £191,681 | 7% |
104 Properties |
| 2003 | £178,423 | 18% |
88 Properties |
| 2002 | £146,181 | 20% |
122 Properties |
| 2001 | £116,303 | 10% |
114 Properties |
| 2000 | £104,381 | 15% |
88 Properties |
| 1999 | £88,534 | 19% |
103 Properties |
| 1998 | £71,428 | 5% |
124 Properties |
| 1997 | £68,035 | 5% |
114 Properties |
| 1996 | £64,824 | 3% |
88 Properties |
| 1995 | £63,112 | - |
98 Properties |
Property Price per Property Type in Abbey
Here you can find historic sold price data in order to help with your property search.
The average Property Paid Price for specific property types in the last three years are:
| Property Type | Average Sold Price | Sold Properties |
|---|---|---|
| Semi Detached House | £382,544.00 | 95 Semi Detached Houses |
| Detached House | £621,960.00 | 43 Detached Houses |
| Terraced House | £272,665.00 | 27 Terraced Houses |
| Flat | £161,741.00 | 6 Flats |

