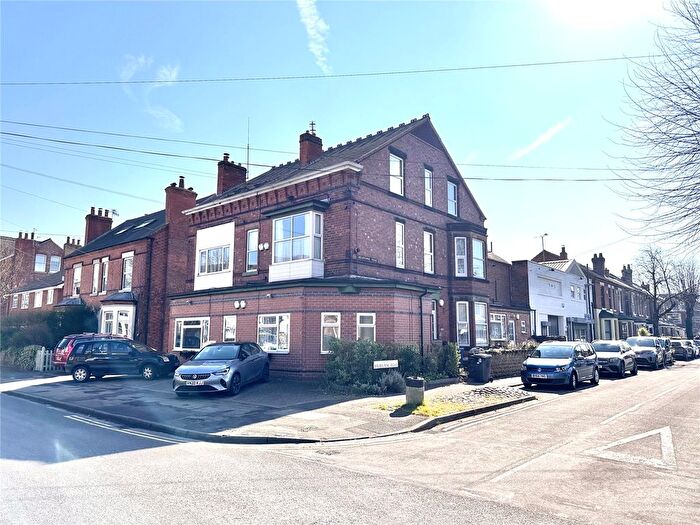
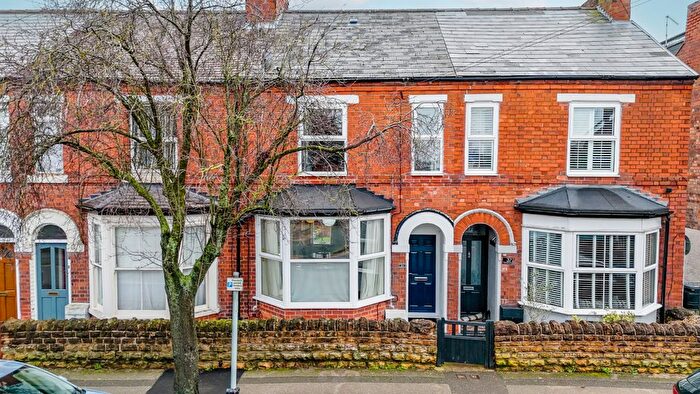
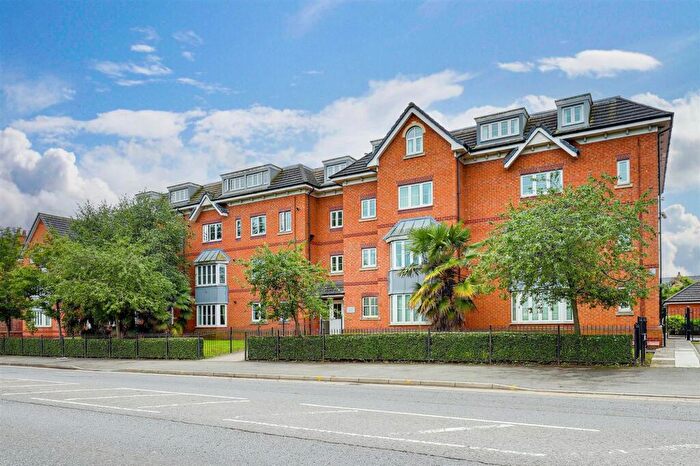
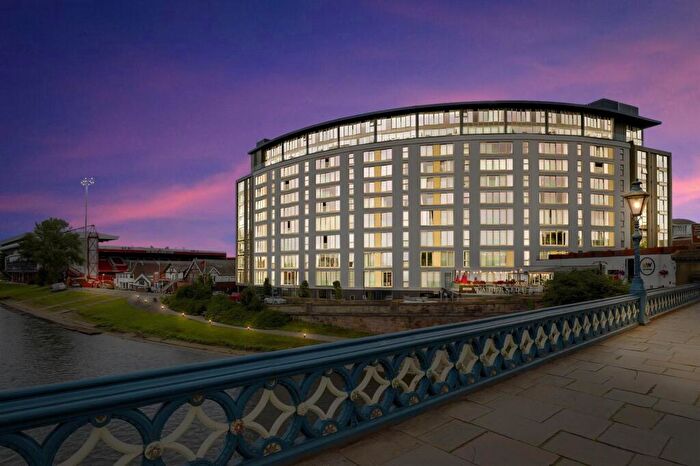
Houses for sale & to rent in Lady Bay, Nottingham
House Prices in Lady Bay
Properties in Lady Bay have an average house price of £405,576.00 and had 177 Property Transactions within the last 3 years¹.
Lady Bay is an area in Nottingham, Nottinghamshire with 1,973 households², where the most expensive property was sold for £1,250,000.00.
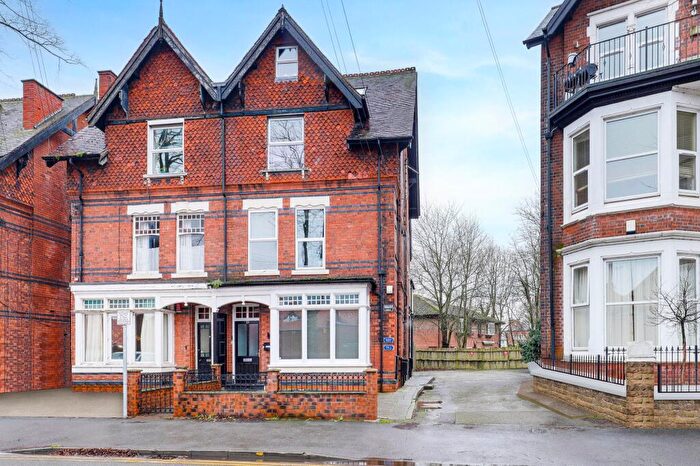
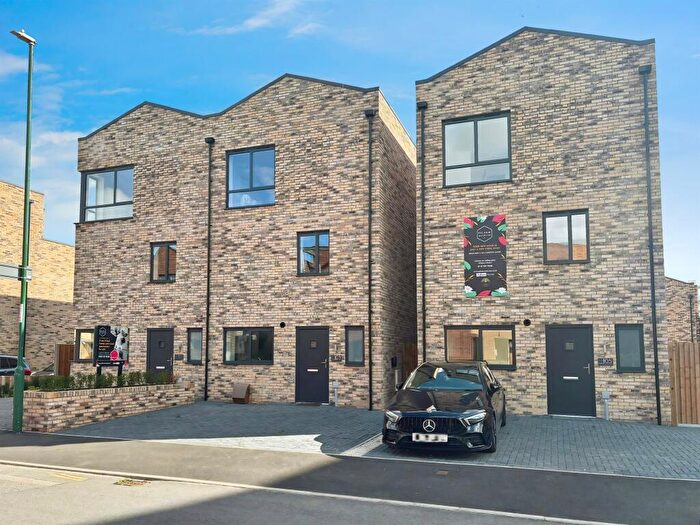
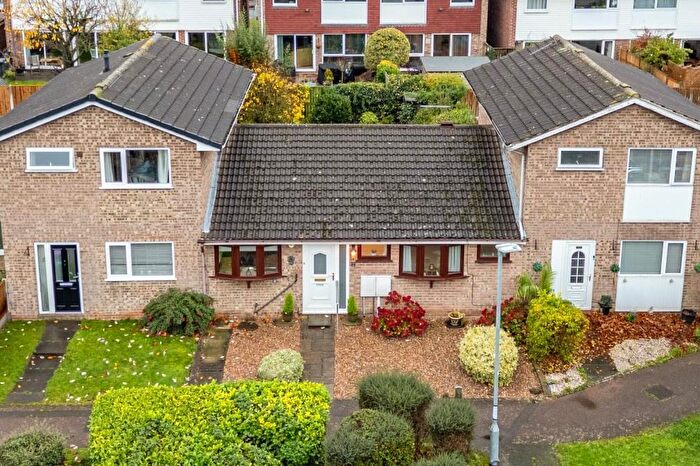
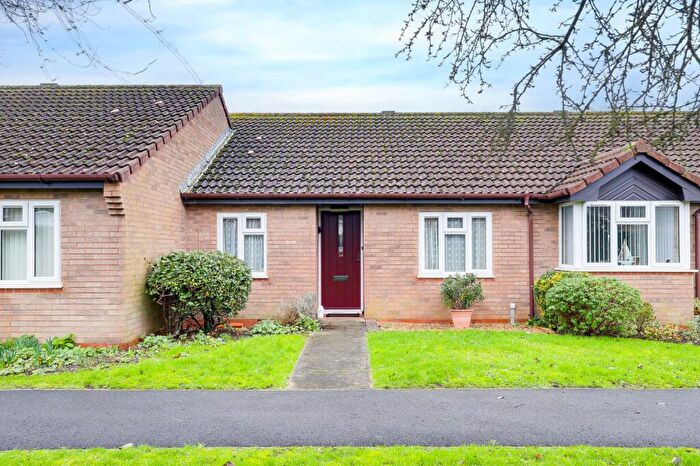
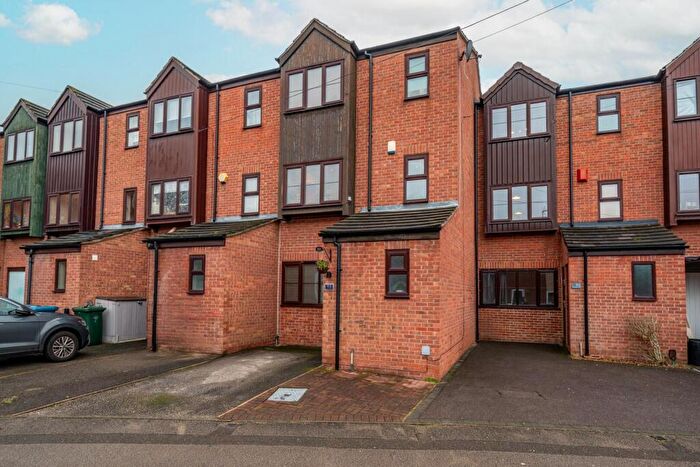
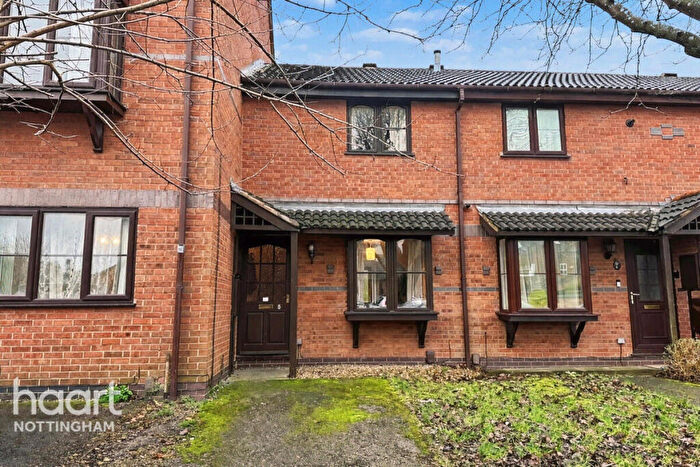
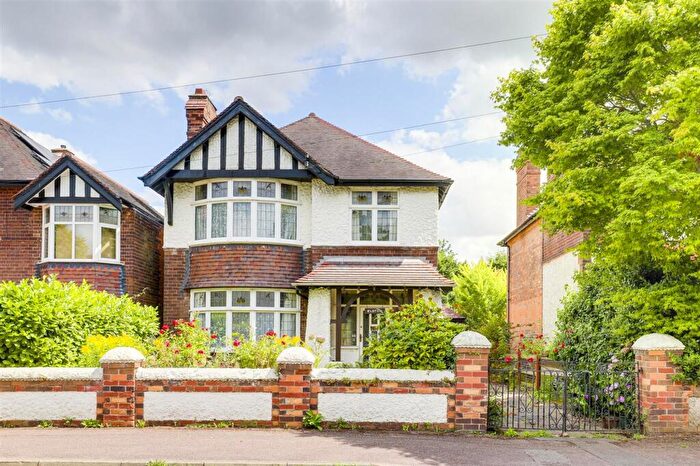
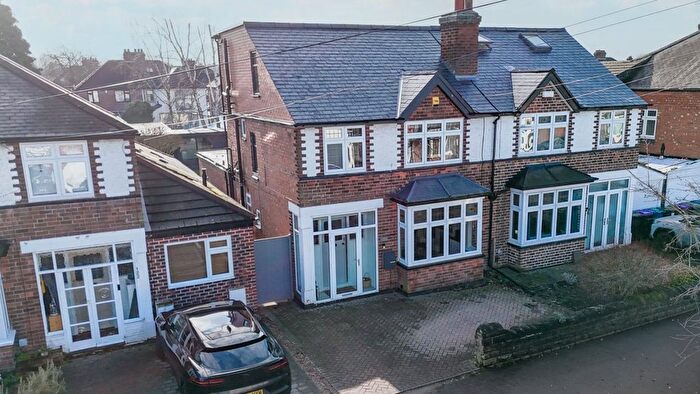
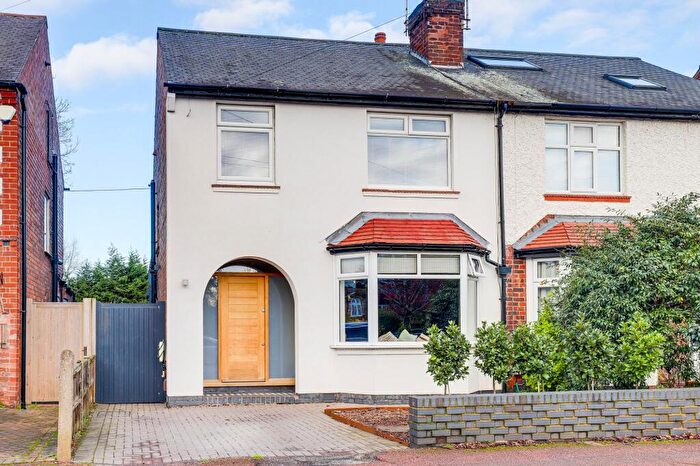
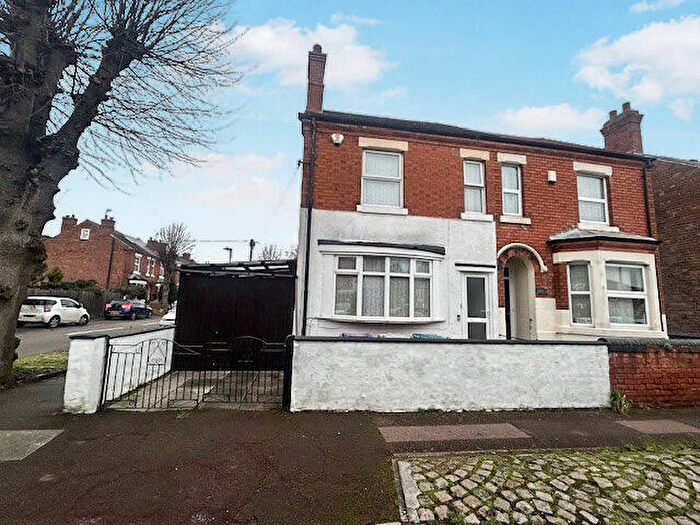
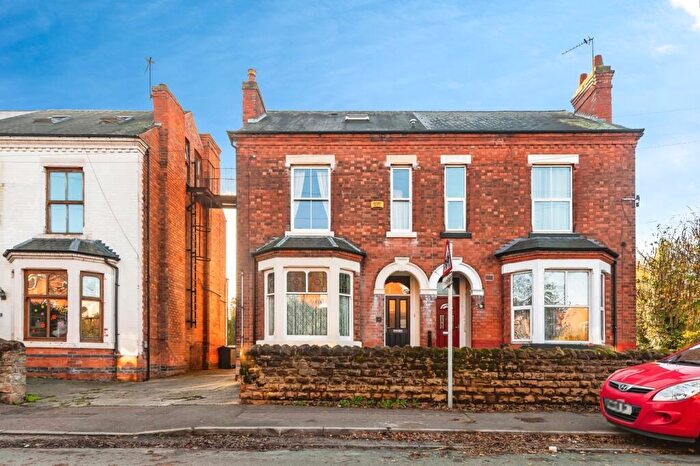
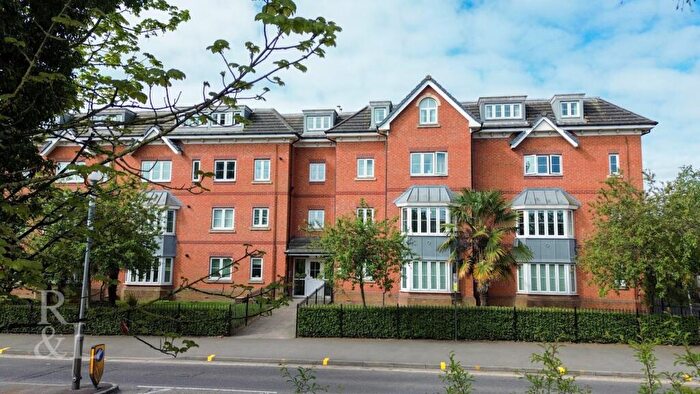
Properties for sale in Lady Bay
Roads and Postcodes in Lady Bay
Navigate through our locations to find the location of your next house in Lady Bay, Nottingham for sale or to rent.
| Streets | Postcodes |
|---|---|
| Belvoir Road | NG2 5DL |
| Carlight Gardens | NG2 5AZ |
| Chatsworth Road | NG2 5ED |
| Crosby Road | NG2 5GG NG2 5GH |
| Edward Road | NG2 5GB NG2 5GE NG2 5GF NG2 5GP |
| Ella Road | NG2 5GU NG2 5GW NG2 5GX NG2 5GZ |
| Fleeman Grove | NG2 5BH |
| Gertrude Road | NG2 5BY NG2 5BZ NG2 5DA NG2 5DB |
| Hardwick Grove | NG2 5HL |
| Holme Grove | NG2 5AH |
| Holme Road | NG2 5AA NG2 5AD NG2 5AE NG2 5AF NG2 5AG |
| Julian Road | NG2 5AJ NG2 5AL NG2 5AN NG2 5AP NG2 5AQ |
| Lady Bay Road | NG2 5DS |
| Ladybay Road | NG2 5BJ NG2 5DT |
| Melbourne Road | NG2 5BG NG2 5DJ |
| Mona Road | NG2 5BQ NG2 5BS NG2 5BT NG2 5BU |
| Newhall Grove | NG2 5HJ |
| Oak Tree Close | NG2 5DE |
| Oakfields Road | NG2 5DN |
| Pierrepont Road | NG2 5BP NG2 5DW NG2 5DX |
| Radcliffe Road | NG2 5FW NG2 5HG NG2 5HH NG2 5PG |
| Richmond Road | NG2 5GD |
| Ropsley Crescent | NG2 5DQ |
| Rutland Road | NG2 5DG NG2 5DH NG2 5DP NG2 5DR NG2 5DU NG2 5DY NG2 5DZ NG2 5EA NG2 5EB |
| Seymour Road | NG2 5EE NG2 5EF NG2 5EG |
| Trent Boulevard | NG2 5BA NG2 5BB NG2 5BD NG2 5BE NG2 5BL NG2 5BN NG2 5BW NG2 5BX |
| Trevelyan Road | NG2 5GY |
| Woodland Road | NG2 5AB |
Transport near Lady Bay
- FAQ
- Price Paid By Year
- Property Type Price
Frequently asked questions about Lady Bay
What is the average price for a property for sale in Lady Bay?
The average price for a property for sale in Lady Bay is £405,576. This amount is 44% higher than the average price in Nottingham. There are 966 property listings for sale in Lady Bay.
What streets have the most expensive properties for sale in Lady Bay?
The streets with the most expensive properties for sale in Lady Bay are Holme Road at an average of £555,150, Gertrude Road at an average of £534,575 and Ella Road at an average of £525,875.
What streets have the most affordable properties for sale in Lady Bay?
The streets with the most affordable properties for sale in Lady Bay are Oakfields Road at an average of £176,000, Oak Tree Close at an average of £245,750 and Ropsley Crescent at an average of £255,000.
Which train stations are available in or near Lady Bay?
Some of the train stations available in or near Lady Bay are Nottingham, Netherfield and Carlton.
Property Price Paid in Lady Bay by Year
The average sold property price by year was:
| Year | Average Sold Price | Price Change |
Sold Properties
|
|---|---|---|---|
| 2025 | £422,482 | 7% |
69 Properties |
| 2024 | £394,023 | -0,5% |
63 Properties |
| 2023 | £395,828 | -2% |
45 Properties |
| 2022 | £403,866 | 9% |
69 Properties |
| 2021 | £368,219 | 5% |
124 Properties |
| 2020 | £349,153 | 8% |
78 Properties |
| 2019 | £321,451 | 5% |
78 Properties |
| 2018 | £306,178 | -6% |
84 Properties |
| 2017 | £324,042 | 7% |
90 Properties |
| 2016 | £302,087 | 10% |
94 Properties |
| 2015 | £272,601 | 7% |
96 Properties |
| 2014 | £253,724 | 8% |
101 Properties |
| 2013 | £233,886 | -8% |
88 Properties |
| 2012 | £253,521 | 3% |
68 Properties |
| 2011 | £246,668 | 0,1% |
85 Properties |
| 2010 | £246,444 | 13% |
69 Properties |
| 2009 | £213,532 | 6% |
90 Properties |
| 2008 | £200,037 | -8% |
63 Properties |
| 2007 | £216,350 | -3% |
145 Properties |
| 2006 | £222,228 | 6% |
124 Properties |
| 2005 | £209,756 | 1% |
104 Properties |
| 2004 | £207,828 | 11% |
119 Properties |
| 2003 | £184,429 | 20% |
111 Properties |
| 2002 | £146,951 | 18% |
122 Properties |
| 2001 | £120,472 | 10% |
166 Properties |
| 2000 | £108,761 | 15% |
126 Properties |
| 1999 | £92,431 | 9% |
141 Properties |
| 1998 | £84,025 | 13% |
105 Properties |
| 1997 | £73,302 | 10% |
125 Properties |
| 1996 | £65,723 | 4% |
90 Properties |
| 1995 | £62,841 | - |
84 Properties |
Property Price per Property Type in Lady Bay
Here you can find historic sold price data in order to help with your property search.
The average Property Paid Price for specific property types in the last three years are:
| Property Type | Average Sold Price | Sold Properties |
|---|---|---|
| Semi Detached House | £472,166.00 | 101 Semi Detached Houses |
| Detached House | £539,150.00 | 23 Detached Houses |
| Terraced House | £323,960.00 | 17 Terraced Houses |
| Flat | £171,956.00 | 36 Flats |

