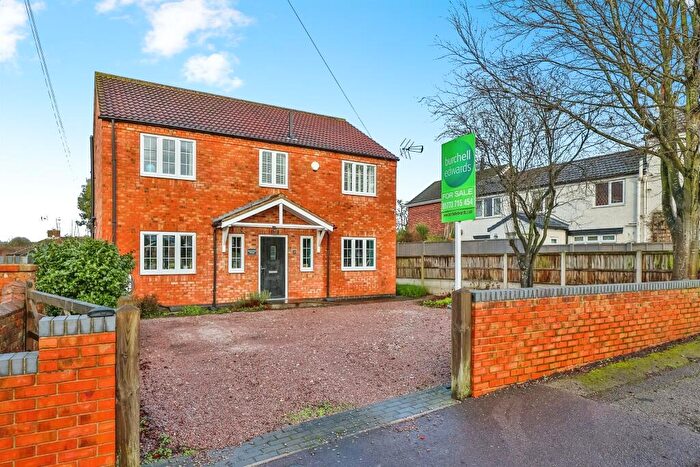
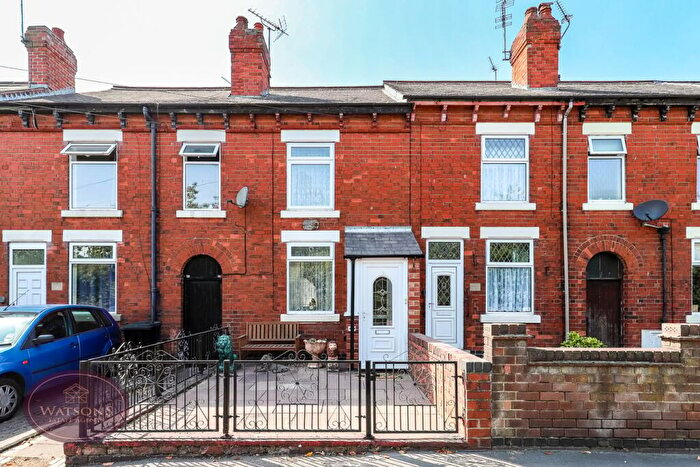
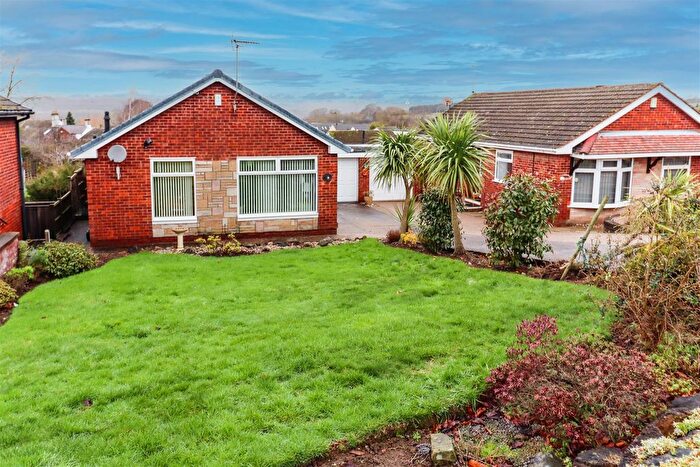
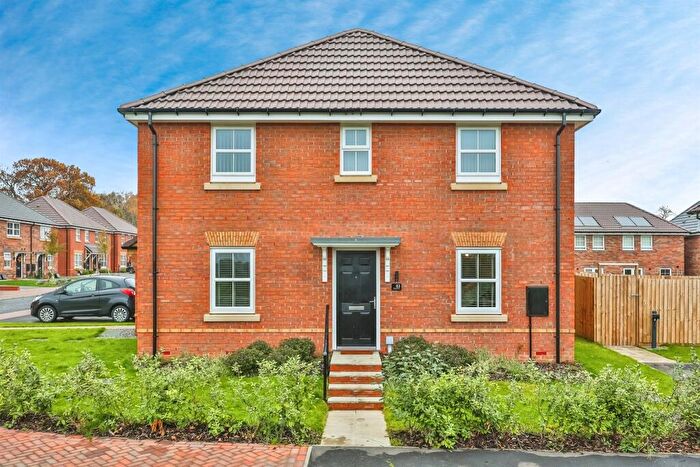
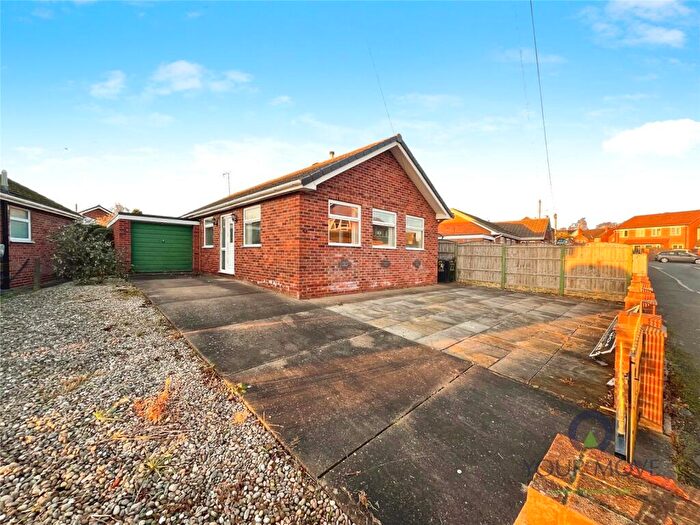
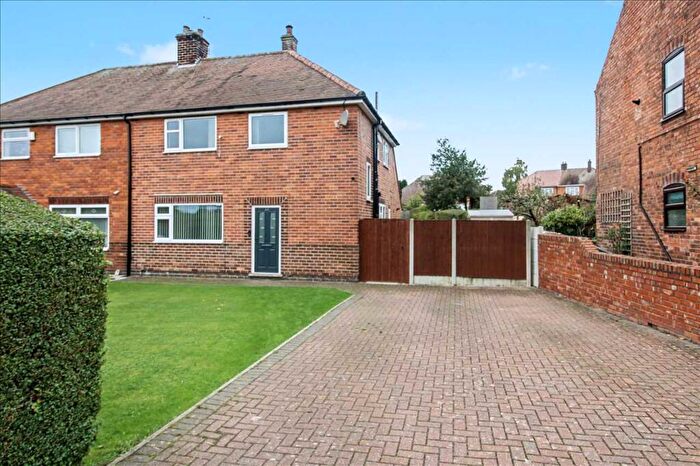
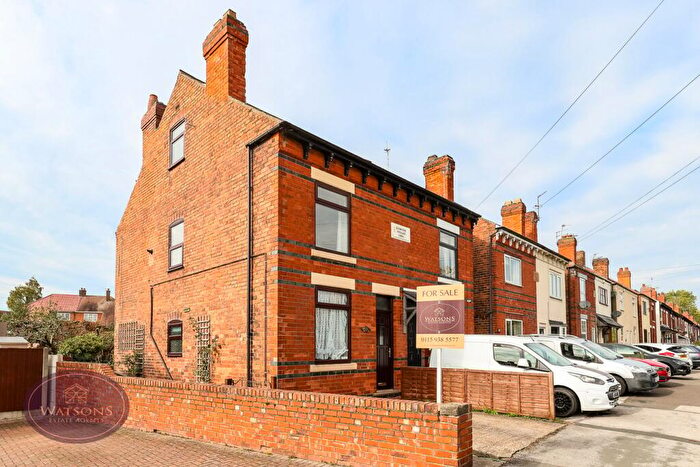
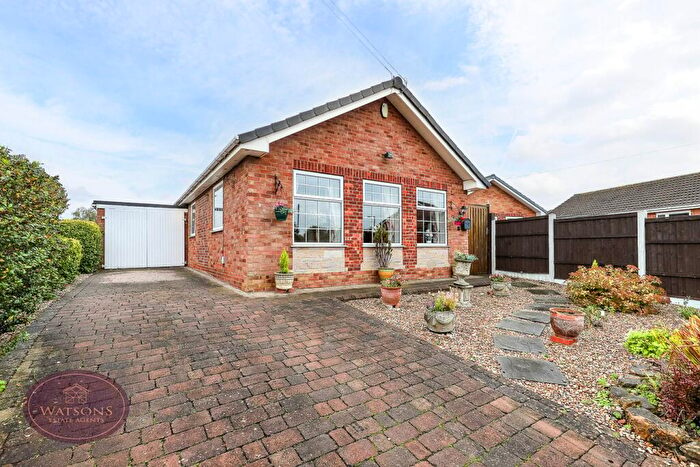
Houses for sale & to rent in Brinsley, Nottingham
House Prices in Brinsley
Properties in Brinsley have an average house price of £238,397.00 and had 82 Property Transactions within the last 3 years¹.
Brinsley is an area in Nottingham, Nottinghamshire with 983 households², where the most expensive property was sold for £520,000.00.
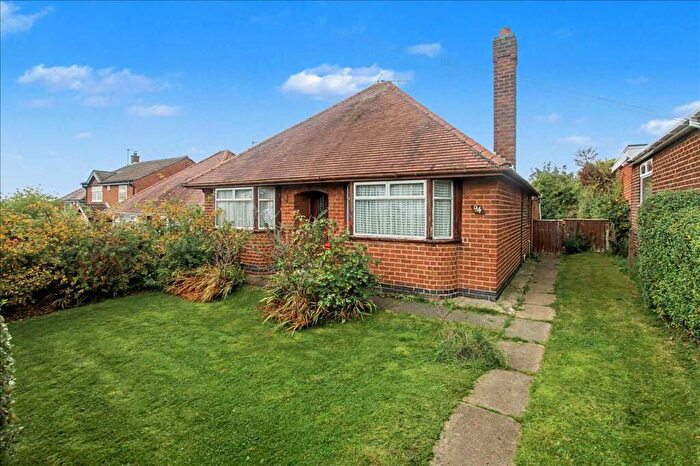
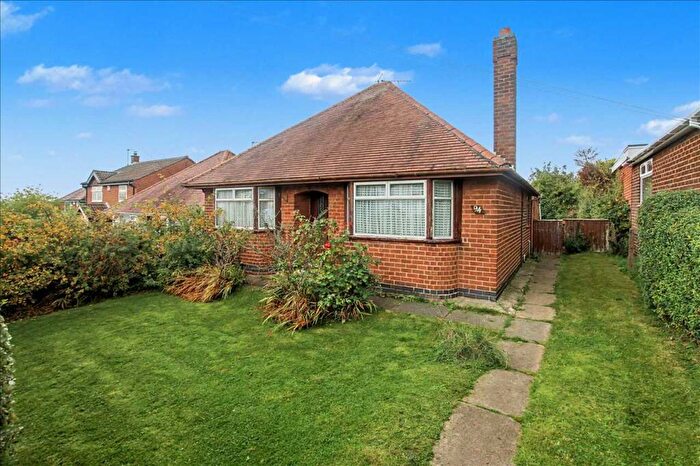
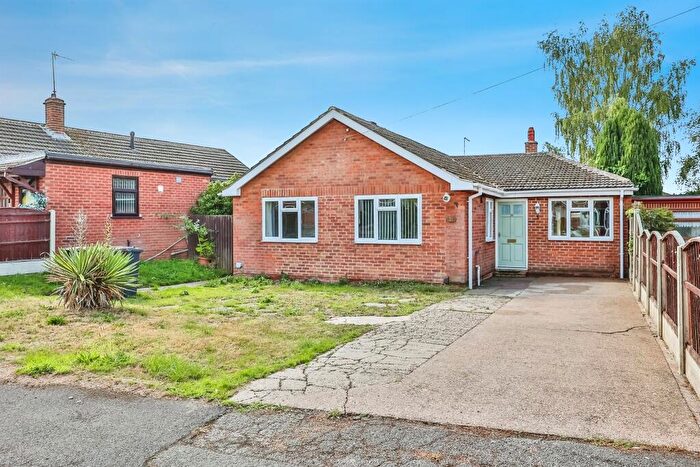
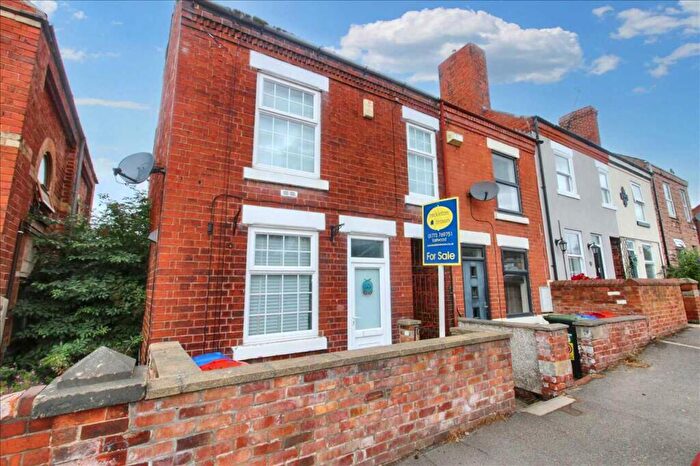
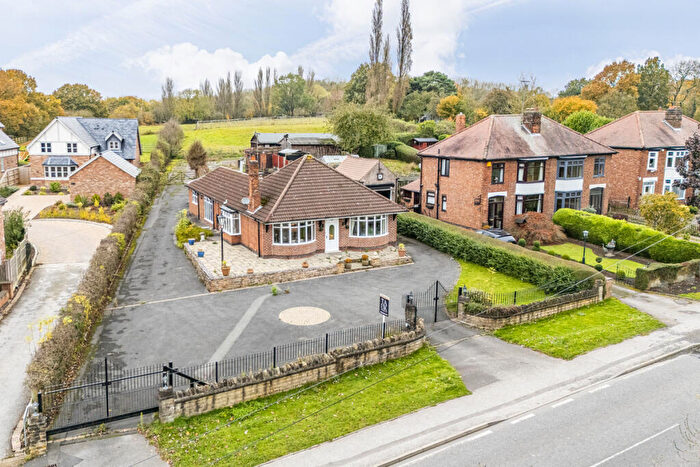
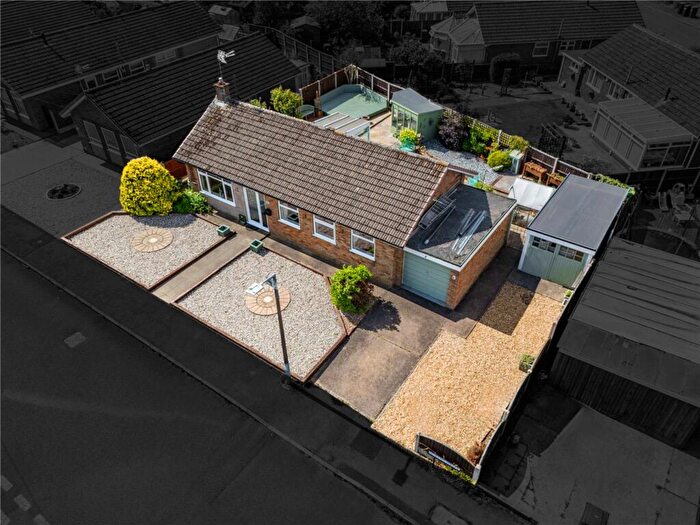
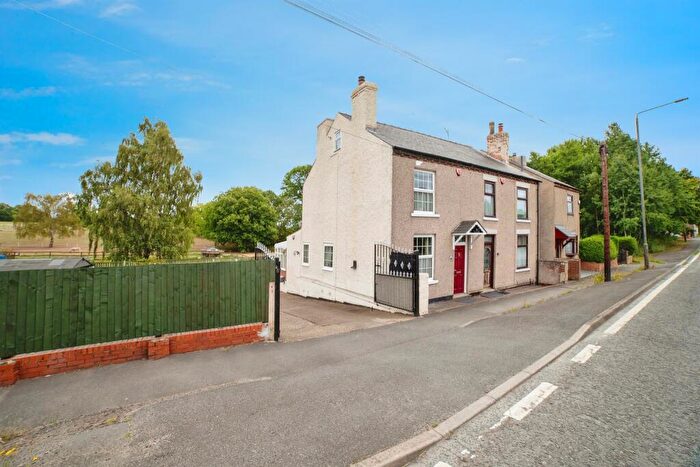
Properties for sale in Brinsley
Previously listed properties in Brinsley
Roads and Postcodes in Brinsley
Navigate through our locations to find the location of your next house in Brinsley, Nottingham for sale or to rent.
| Streets | Postcodes |
|---|---|
| Ash Grove | NG16 5DH |
| Broad Lane | NG16 5BD NG16 5BE NG16 5BU NG16 5BX |
| Broad Oak Drive | NG16 5DJ |
| Brynsmoor Road | NG16 5DD |
| Canary Gardens | NG16 5DS |
| Cherry Tree Close | NG16 5BA |
| Church Lane | NG16 5AB NG16 5AD NG16 5AY |
| Church Walk | NG16 5AR NG16 5AT |
| Clinton Avenue | NG16 5AQ |
| Clumber Avenue | NG16 5BT |
| Comice Gardens | NG16 5BL |
| Cordy Lane | NG16 5BY |
| Gladstone Drive | NG16 5DE |
| Hall Lane | NG16 5AG NG16 5AH NG16 5AN NG16 5AP |
| High Street | NG16 5BN |
| Hobsic Close | NG16 5AX |
| Holroyd Circle | NG16 5DR |
| Kings Drive | NG16 5DG |
| Lawrence Drive | NG16 5AU |
| Main Street | NG16 5BG |
| Mansfield Road | NG16 5AE NG16 5AF |
| Moor Road | NG16 5AZ |
| Perry Gardens | NG16 5BF |
| Queens Drive | NG16 5DF |
| Red Lane | NG16 5BW |
| St James Drive | NG16 5DB |
| St Johns Close | NG16 5BH |
| Stoney Lane | NG16 5AJ NG16 5AL |
| The Moor | NG16 5BB NG16 5DN |
| Walters Avenue | NG16 5AS |
| Whitehead Drive | NG16 5AW |
| Windsmoor Road | NG16 5DA |
| NG16 5BJ |
Transport near Brinsley
-
Langley Mill Station
-
Ilkeston Station
-
Newstead Station
-
Alfreton Station
-
Kirkby in Ashfield Station
-
Hucknall Station
- FAQ
- Price Paid By Year
- Property Type Price
Frequently asked questions about Brinsley
What is the average price for a property for sale in Brinsley?
The average price for a property for sale in Brinsley is £238,397. This amount is 16% lower than the average price in Nottingham. There are 258 property listings for sale in Brinsley.
What streets have the most expensive properties for sale in Brinsley?
The streets with the most expensive properties for sale in Brinsley are The Moor at an average of £420,000, Hall Lane at an average of £301,166 and Cordy Lane at an average of £278,500.
What streets have the most affordable properties for sale in Brinsley?
The streets with the most affordable properties for sale in Brinsley are Hobsic Close at an average of £136,000, St James Drive at an average of £136,000 and High Street at an average of £146,000.
Which train stations are available in or near Brinsley?
Some of the train stations available in or near Brinsley are Langley Mill, Ilkeston and Newstead.
Property Price Paid in Brinsley by Year
The average sold property price by year was:
| Year | Average Sold Price | Price Change |
Sold Properties
|
|---|---|---|---|
| 2025 | £236,460 | 4% |
25 Properties |
| 2024 | £228,077 | -9% |
27 Properties |
| 2023 | £249,300 | -2% |
30 Properties |
| 2022 | £253,419 | 5% |
31 Properties |
| 2021 | £239,748 | 6% |
38 Properties |
| 2020 | £225,222 | 29% |
27 Properties |
| 2019 | £160,596 | -16% |
31 Properties |
| 2018 | £185,771 | 7% |
33 Properties |
| 2017 | £173,611 | 4% |
36 Properties |
| 2016 | £166,509 | -6% |
33 Properties |
| 2015 | £177,001 | 13% |
39 Properties |
| 2014 | £154,130 | 12% |
30 Properties |
| 2013 | £135,451 | -7% |
27 Properties |
| 2012 | £144,917 | 4% |
28 Properties |
| 2011 | £139,637 | -3% |
29 Properties |
| 2010 | £144,408 | -16% |
25 Properties |
| 2009 | £168,039 | 11% |
33 Properties |
| 2008 | £149,178 | -12% |
23 Properties |
| 2007 | £166,925 | 14% |
49 Properties |
| 2006 | £142,936 | 15% |
41 Properties |
| 2005 | £122,036 | -20% |
26 Properties |
| 2004 | £146,510 | 13% |
46 Properties |
| 2003 | £127,246 | 34% |
33 Properties |
| 2002 | £83,981 | 18% |
48 Properties |
| 2001 | £68,964 | 17% |
48 Properties |
| 2000 | £57,430 | 2% |
43 Properties |
| 1999 | £56,057 | -5% |
41 Properties |
| 1998 | £59,025 | 16% |
34 Properties |
| 1997 | £49,637 | 7% |
33 Properties |
| 1996 | £46,301 | -10% |
23 Properties |
| 1995 | £50,780 | - |
31 Properties |
Property Price per Property Type in Brinsley
Here you can find historic sold price data in order to help with your property search.
The average Property Paid Price for specific property types in the last three years are:
| Property Type | Average Sold Price | Sold Properties |
|---|---|---|
| Semi Detached House | £216,191.00 | 47 Semi Detached Houses |
| Detached House | £264,775.00 | 33 Detached Houses |
| Terraced House | £325,000.00 | 2 Terraced Houses |

