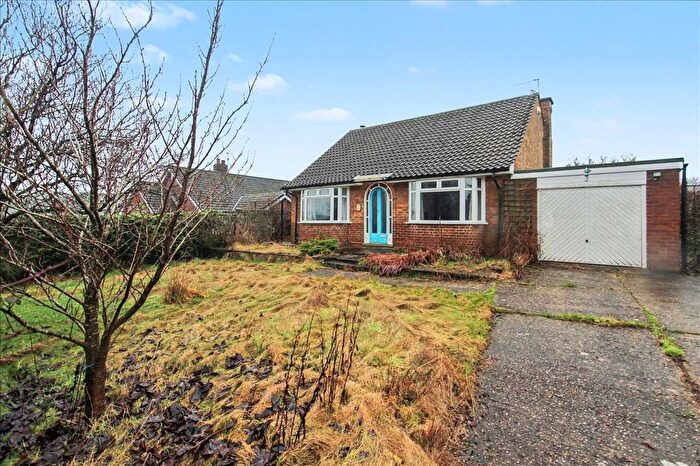
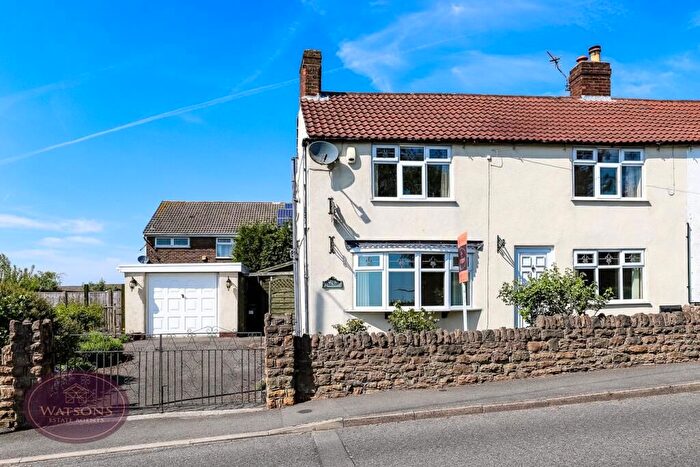
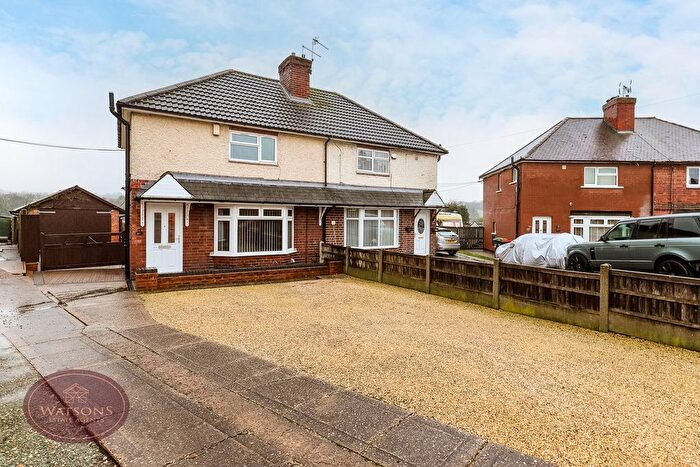
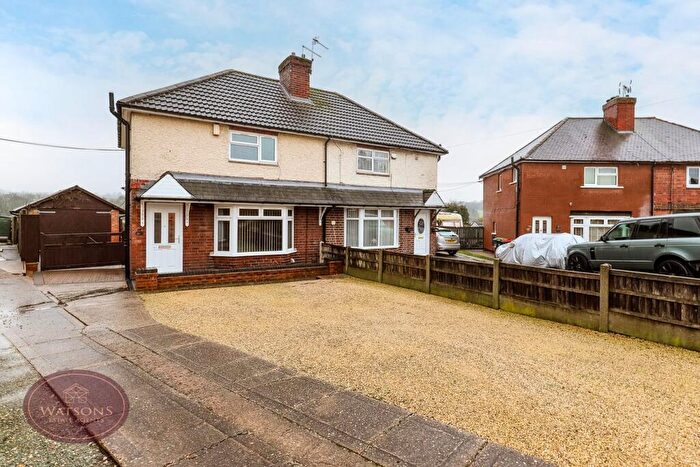
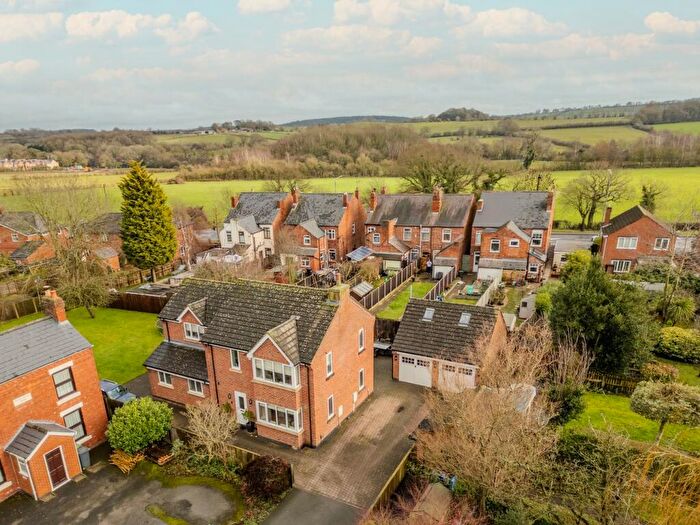
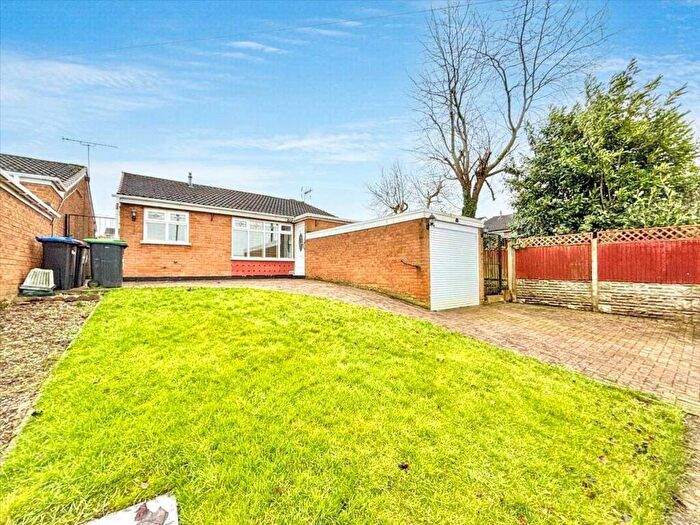
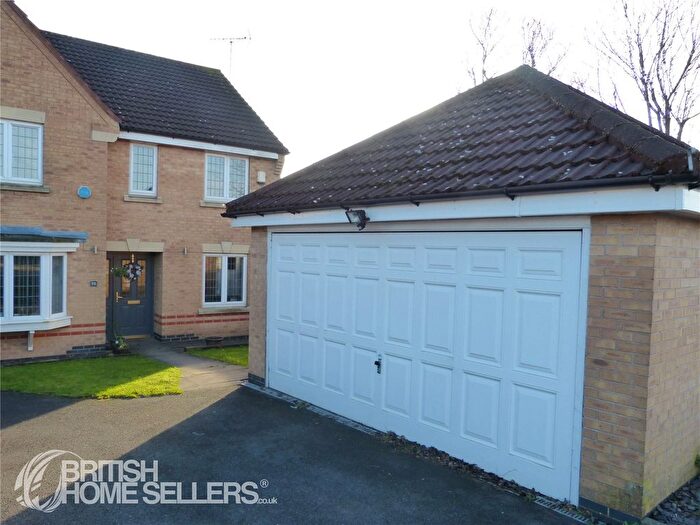
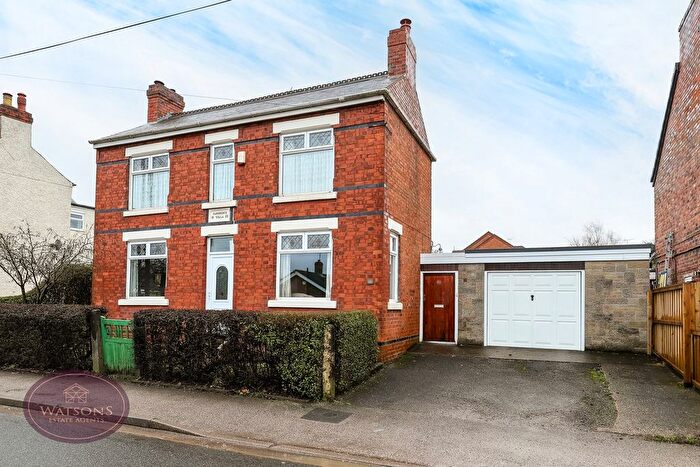
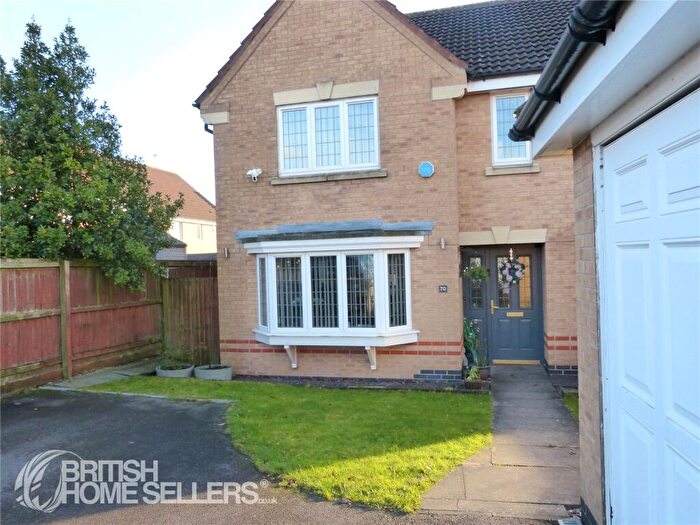
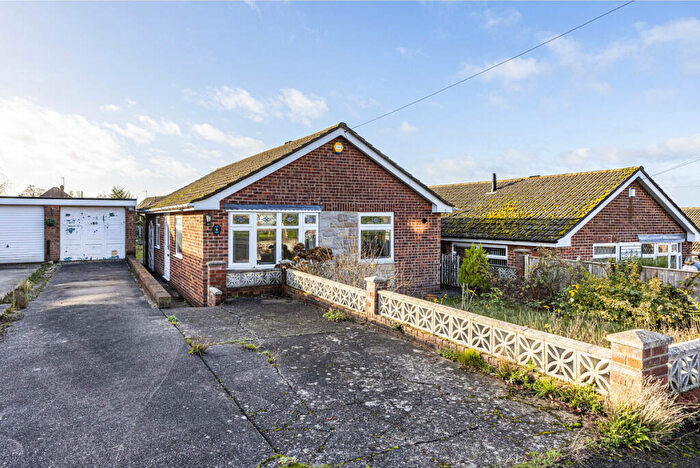
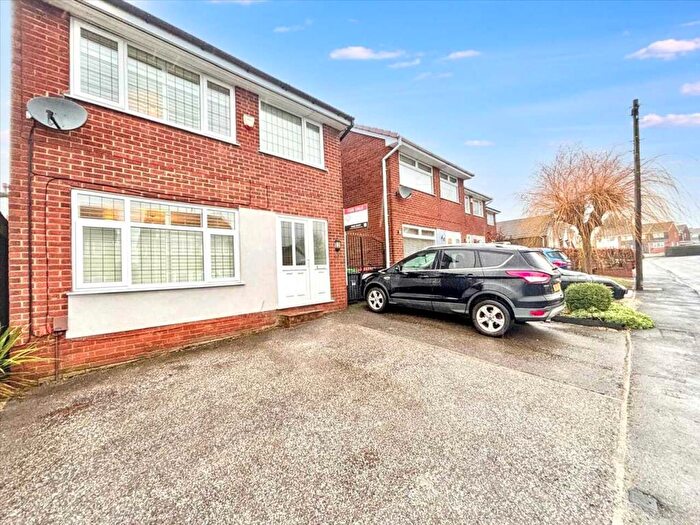
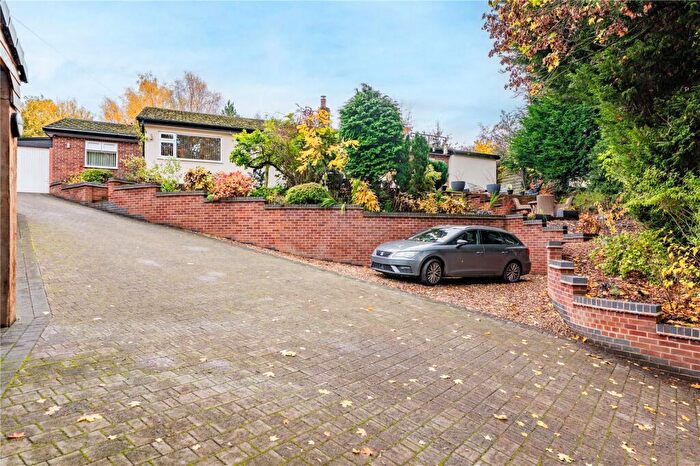
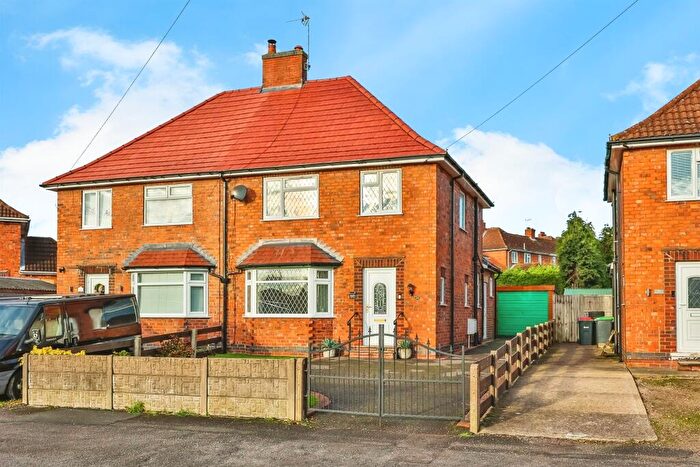
Houses for sale & to rent in Underwood, Nottingham
House Prices in Underwood
Properties in Underwood have an average house price of £271,190.00 and had 113 Property Transactions within the last 3 years¹.
Underwood is an area in Nottingham, Nottinghamshire with 1,303 households², where the most expensive property was sold for £720,000.00.
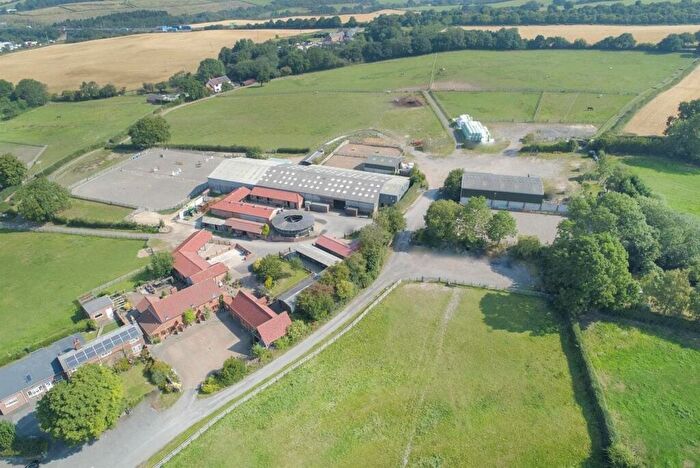
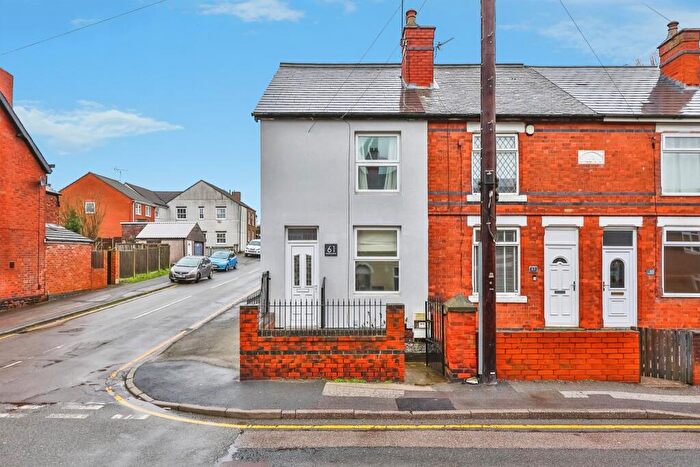
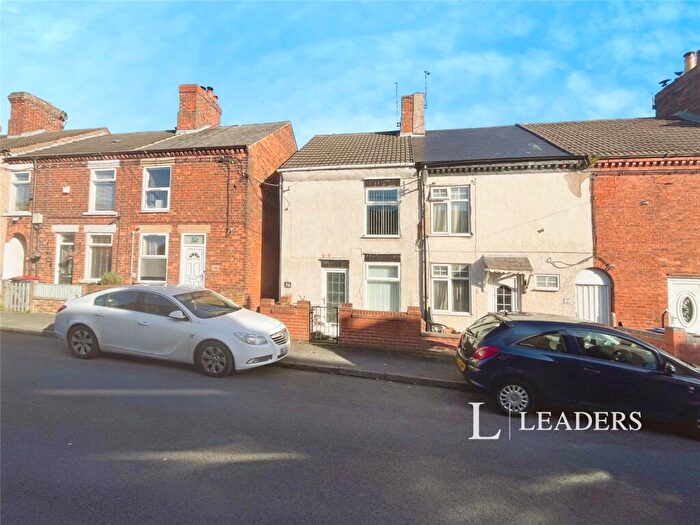
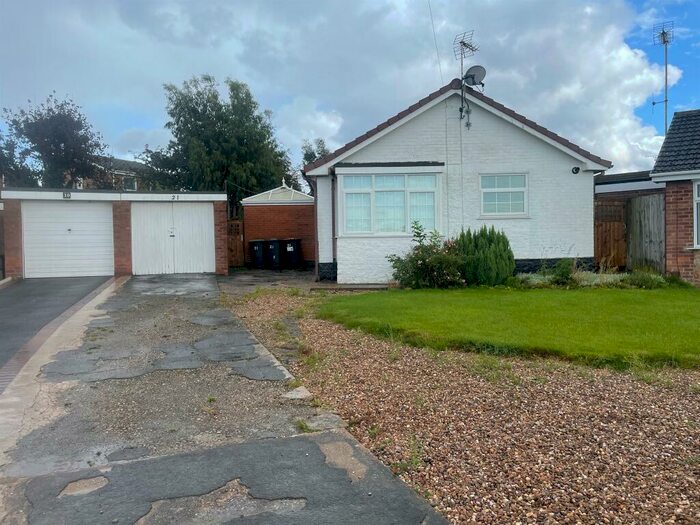
Properties for sale in Underwood
Roads and Postcodes in Underwood
Navigate through our locations to find the location of your next house in Underwood, Nottingham for sale or to rent.
| Streets | Postcodes |
|---|---|
| Albert Terrace | NG16 5GS |
| Alfreton Road | NG16 5FQ NG16 5GA NG16 5GB NG16 5GX |
| Annesley Lane | NG16 6AF |
| Ashbourne Road | NG16 5EH |
| Beech Court | NG16 5ES |
| Beech Road | NG16 5FZ |
| Blue Bell Close | NG16 5FN |
| Church Lane | NG16 5FR NG16 5FS NG16 5HD NG16 5HE |
| Cordy Lane | NG16 5BZ NG16 5FD |
| De Morgan Close | NG16 5EU |
| Desmond Court | NG16 5EY |
| Fairview Avenue | NG16 5GD |
| Felley Mill Lane North | NG16 5FG |
| Felley Mill Lane South | NG16 5DQ |
| Frances Street | NG16 5BP |
| Hankin Avenue | NG16 5FU |
| Larch Close | NG16 5FA |
| Lawrence Park | NG16 5QZ |
| Lower Bagthorpe | NG16 5HF |
| Main Road | NG16 5GF NG16 5GN NG16 5GP NG16 5GQ NG16 5HG |
| Mainside Crescent | NG16 5FP |
| Mansfield Road | NG16 5FE NG16 5FF NG16 5FH |
| Melbourne Street | NG16 6AH |
| Middlebrook Road | NG16 5HA |
| Nottingham Road | NG16 5GZ NG16 6AD NG16 6AE |
| Old Chapel Lane | NG16 5ET |
| Palmerston Street | NG16 5GJ NG16 5GL |
| Plainspot Road | NG16 5BQ NG16 5BS NG16 5HP |
| Poppy Grange | NG16 5DW |
| Primrose Avenue | NG16 5FY |
| Recreation Street | NG16 6AG |
| Sandhill Road | NG16 5FX |
| School Road | NG16 5HB |
| Sharrard Close | NG16 5EQ |
| Smalley Close | NG16 5GE |
| Smeath Road | NG16 5GG NG16 5GU |
| Westbourne Road | NG16 5EG |
| Wheeler Gate | NG16 5GH |
| Wilcox Drive | NG16 5GW |
| Wilhallow Lane | NG16 5HH |
| Winter Closes | NG16 5GR |
| NG16 5FJ |
Transport near Underwood
-
Langley Mill Station
-
Newstead Station
-
Kirkby in Ashfield Station
-
Hucknall Station
-
Alfreton Station
-
Sutton Parkway Station
- FAQ
- Price Paid By Year
- Property Type Price
Frequently asked questions about Underwood
What is the average price for a property for sale in Underwood?
The average price for a property for sale in Underwood is £271,190. This amount is 4% lower than the average price in Nottingham. There are 1,139 property listings for sale in Underwood.
What streets have the most expensive properties for sale in Underwood?
The streets with the most expensive properties for sale in Underwood are Beech Road at an average of £610,000, Larch Close at an average of £480,000 and Cordy Lane at an average of £475,500.
What streets have the most affordable properties for sale in Underwood?
The streets with the most affordable properties for sale in Underwood are Wheeler Gate at an average of £95,000, Palmerston Street at an average of £180,454 and Alfreton Road at an average of £192,714.
Which train stations are available in or near Underwood?
Some of the train stations available in or near Underwood are Langley Mill, Newstead and Kirkby in Ashfield.
Property Price Paid in Underwood by Year
The average sold property price by year was:
| Year | Average Sold Price | Price Change |
Sold Properties
|
|---|---|---|---|
| 2025 | £290,460 | 11% |
35 Properties |
| 2024 | £257,103 | -5% |
45 Properties |
| 2023 | £269,962 | -0,5% |
33 Properties |
| 2022 | £271,239 | 3% |
48 Properties |
| 2021 | £263,847 | 14% |
72 Properties |
| 2020 | £227,168 | 2% |
46 Properties |
| 2019 | £221,658 | 13% |
49 Properties |
| 2018 | £192,926 | 1% |
41 Properties |
| 2017 | £190,203 | -2% |
47 Properties |
| 2016 | £193,524 | 8% |
59 Properties |
| 2015 | £177,265 | 11% |
65 Properties |
| 2014 | £157,825 | 26% |
65 Properties |
| 2013 | £116,705 | -24% |
36 Properties |
| 2012 | £144,260 | -3% |
39 Properties |
| 2011 | £148,724 | -12% |
33 Properties |
| 2010 | £166,019 | -10% |
33 Properties |
| 2009 | £182,848 | 24% |
29 Properties |
| 2008 | £139,182 | -24% |
31 Properties |
| 2007 | £173,184 | 19% |
55 Properties |
| 2006 | £140,016 | -2% |
55 Properties |
| 2005 | £142,391 | -10% |
47 Properties |
| 2004 | £156,957 | 31% |
65 Properties |
| 2003 | £107,751 | 10% |
60 Properties |
| 2002 | £96,539 | 33% |
78 Properties |
| 2001 | £64,923 | -8% |
74 Properties |
| 2000 | £70,264 | -10% |
79 Properties |
| 1999 | £77,321 | 23% |
72 Properties |
| 1998 | £59,747 | 13% |
60 Properties |
| 1997 | £51,818 | -14% |
52 Properties |
| 1996 | £59,290 | 8% |
47 Properties |
| 1995 | £54,639 | - |
43 Properties |
Property Price per Property Type in Underwood
Here you can find historic sold price data in order to help with your property search.
The average Property Paid Price for specific property types in the last three years are:
| Property Type | Average Sold Price | Sold Properties |
|---|---|---|
| Semi Detached House | £213,568.00 | 29 Semi Detached Houses |
| Detached House | £335,719.00 | 64 Detached Houses |
| Terraced House | £148,250.00 | 20 Terraced Houses |

