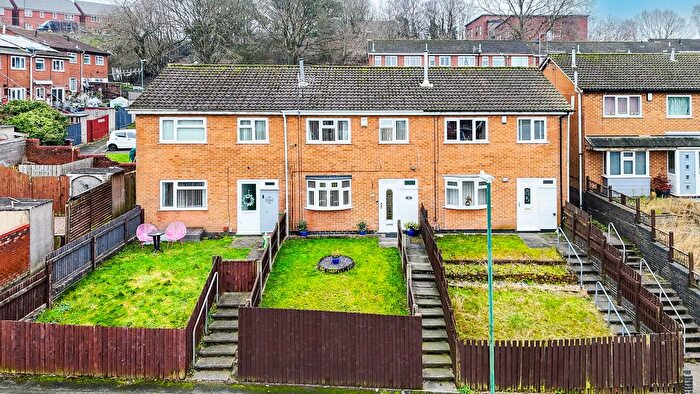
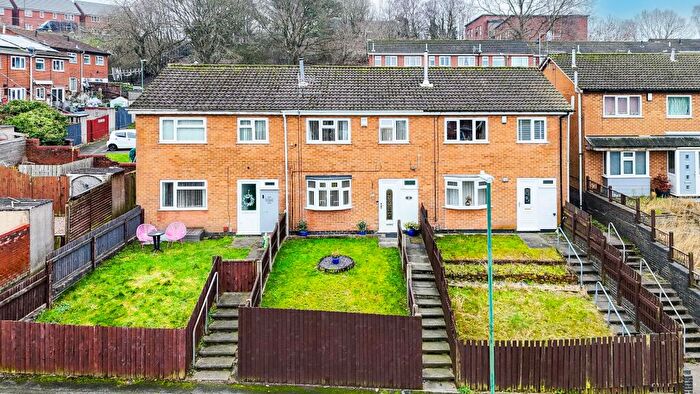
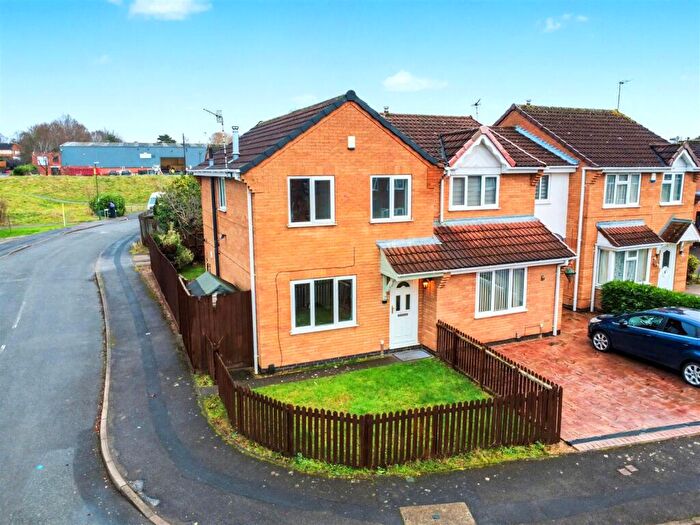
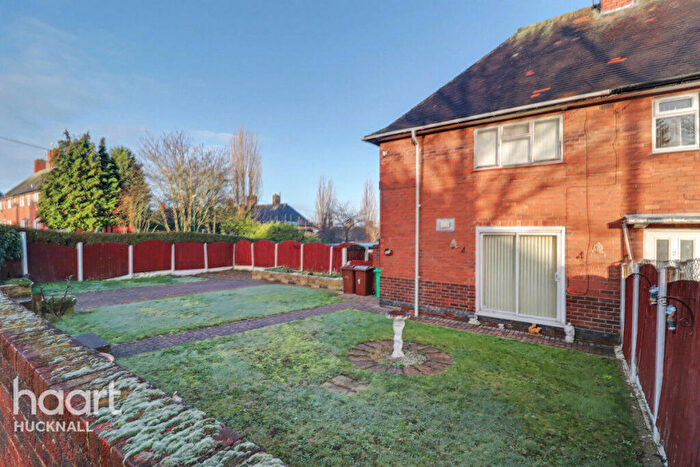
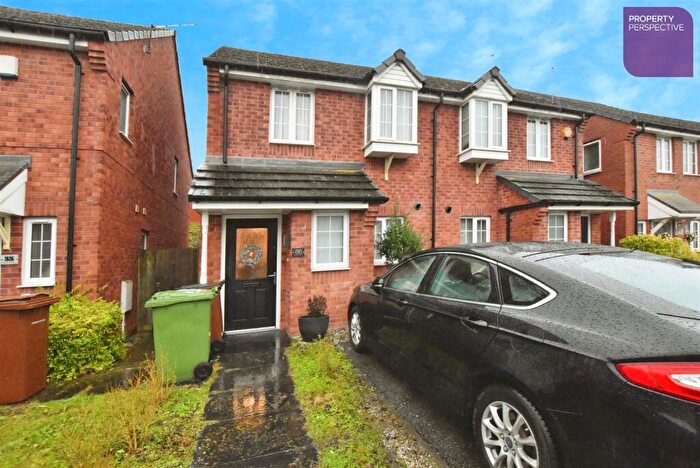
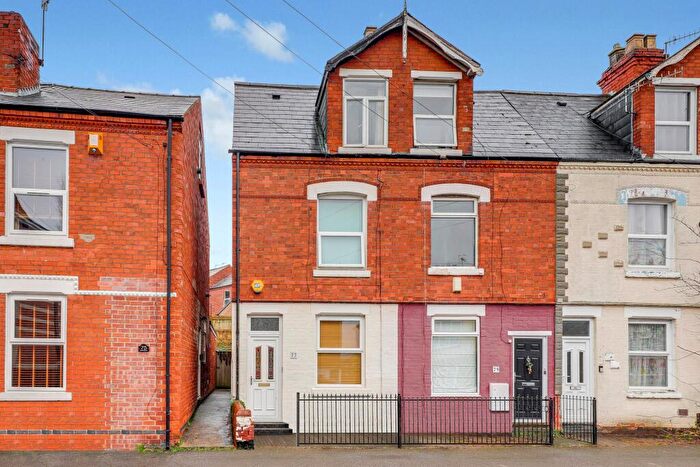
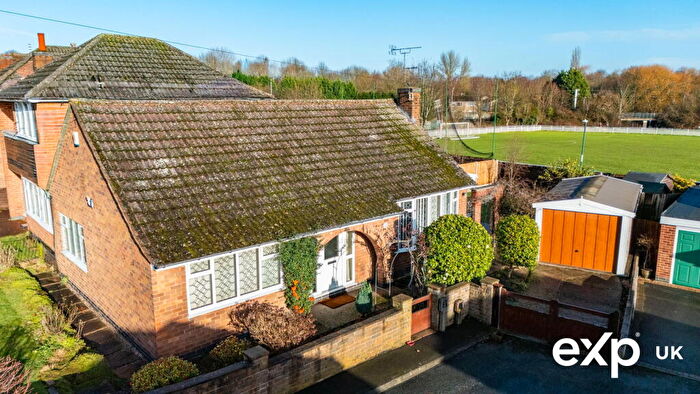
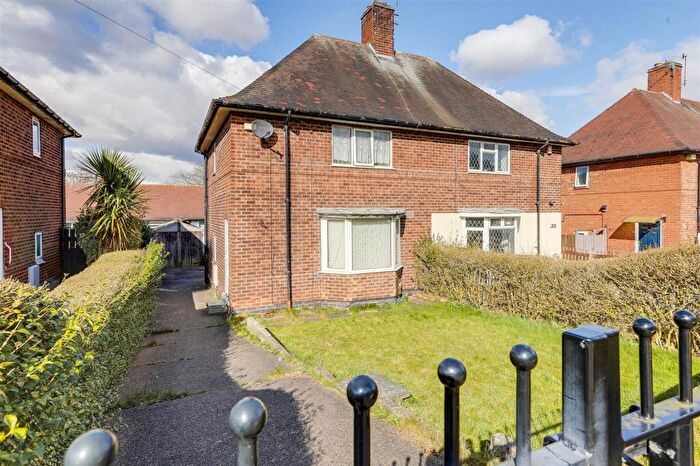
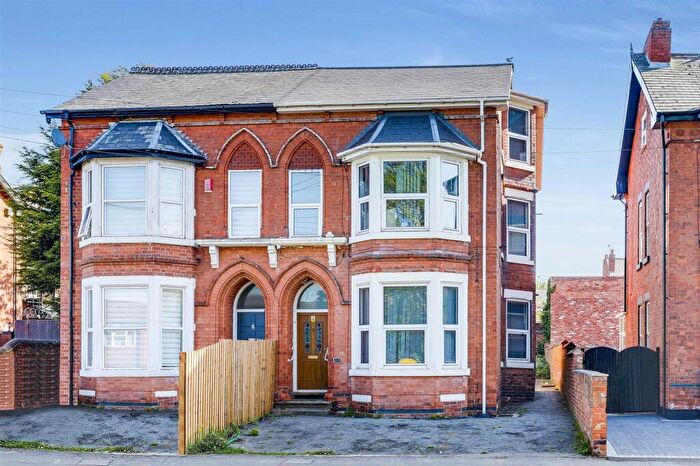
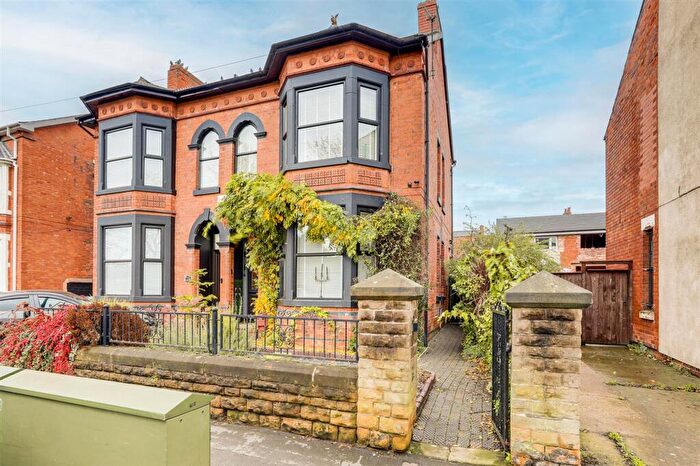
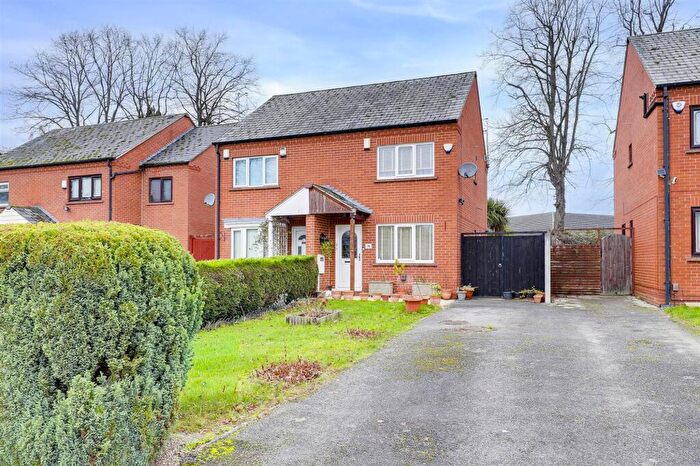
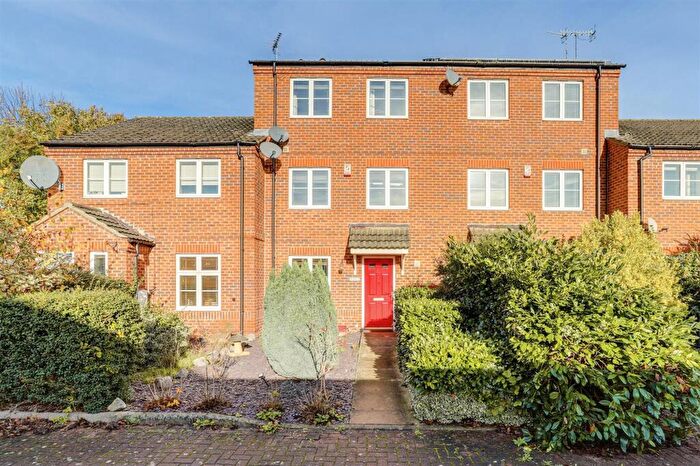
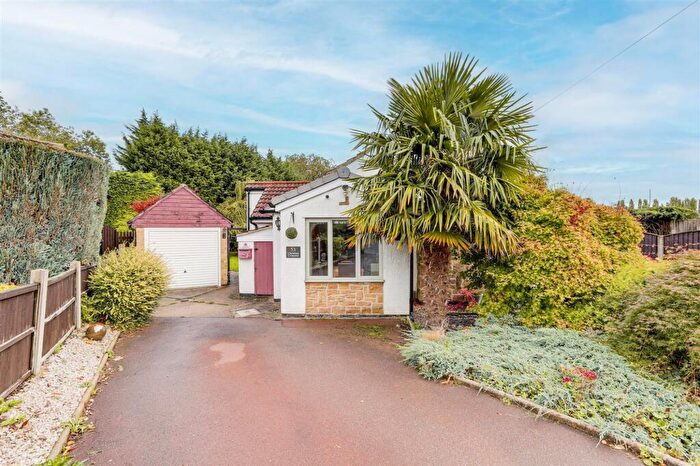
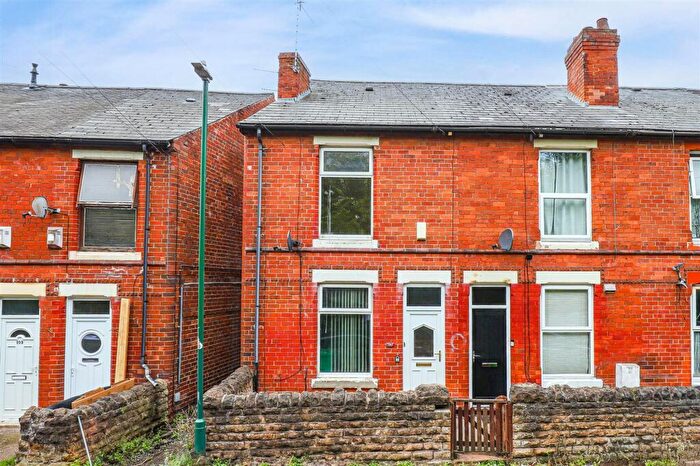
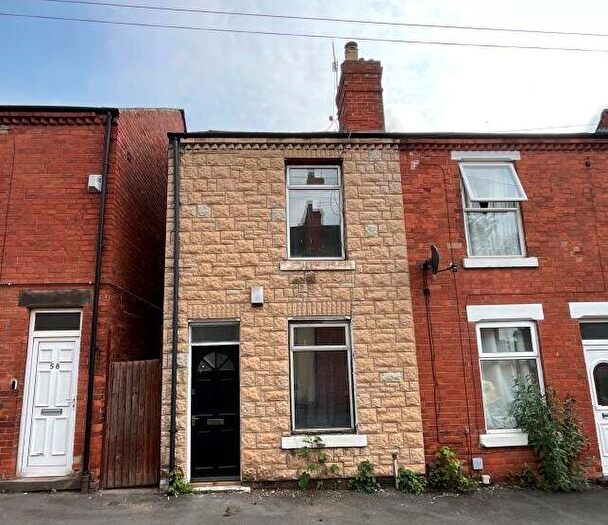
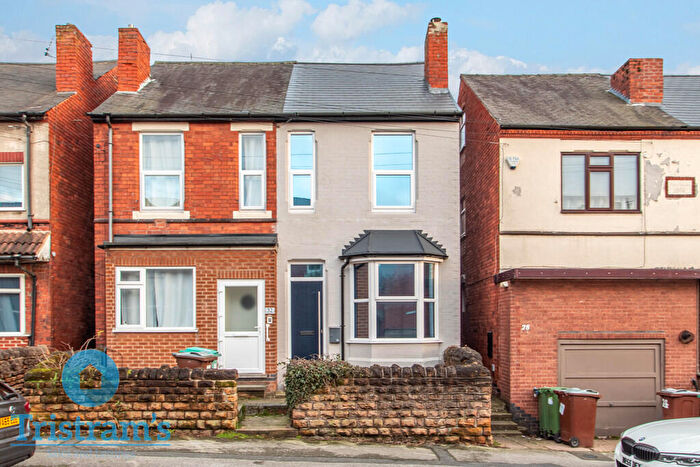
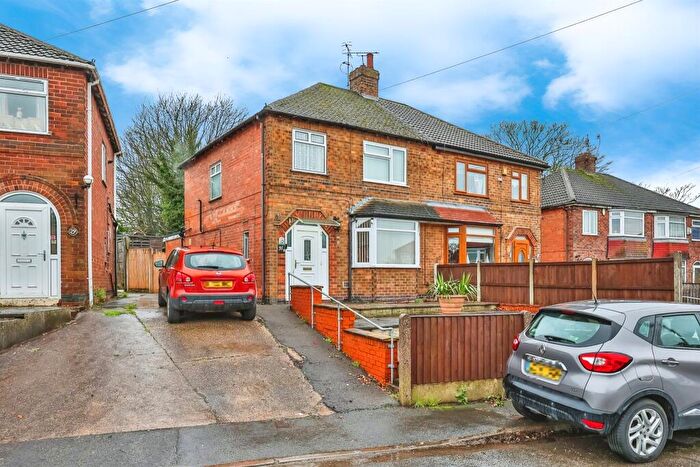
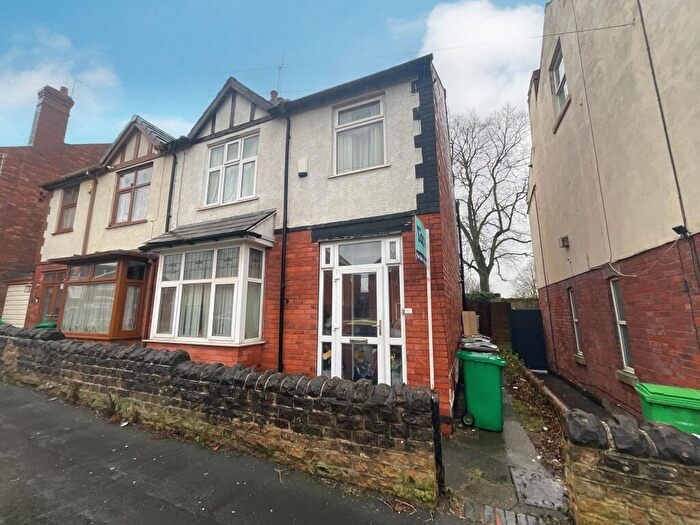
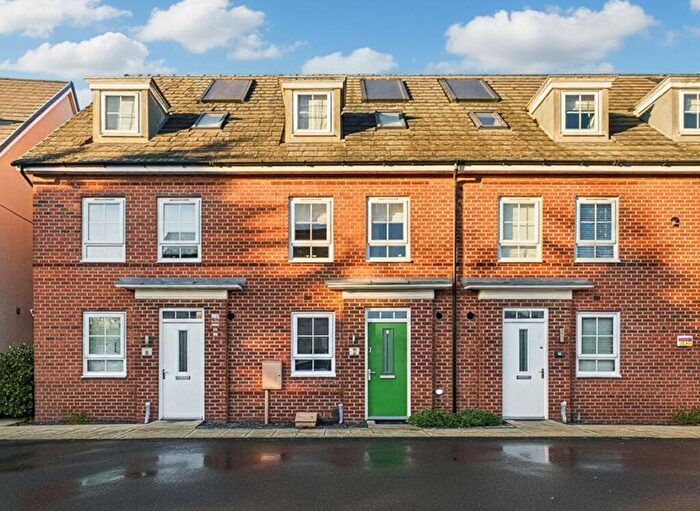
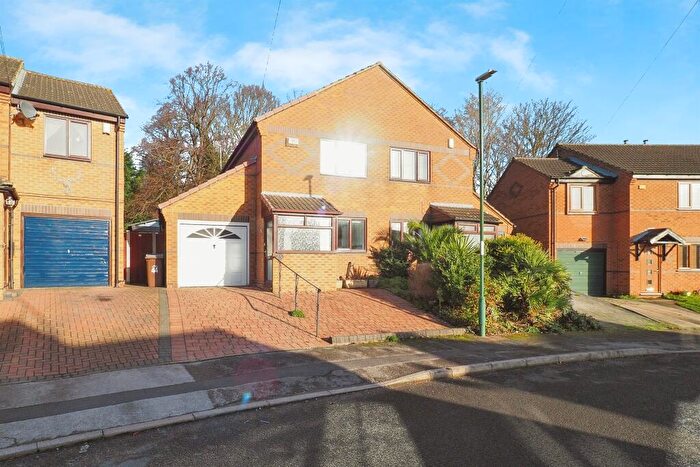
Houses for sale & to rent in Bulwell Forest, Nottingham
House Prices in Bulwell Forest
Properties in Bulwell Forest have an average house price of £80,782.00 and had 2 Property Transactions within the last 3 years¹.
Bulwell Forest is an area in Nottingham, Nottinghamshire with 231 households², where the most expensive property was sold for £86,564.00.
Properties for sale in Bulwell Forest
Roads and Postcodes in Bulwell Forest
Navigate through our locations to find the location of your next house in Bulwell Forest, Nottingham for sale or to rent.
| Streets | Postcodes |
|---|---|
| Alan Clark Grove | NG5 9DE |
| Bestwood Park Drive West | NG5 5EL |
| Bestwood Road | NG6 8UA |
| Brooklyn Road | NG6 9ES NG6 9ET |
| Celandine Close | NG5 9RX |
| Charlock Close | NG5 9RY |
| Chatham Court | NG6 9NA |
| Colin Broughton Court | NG6 9JL |
| Colston Road | NG6 9JN |
| Comfrey Close | NG5 9RR |
| Connelly Court | NG6 9HA |
| Duffield Crescent | NG5 9AY |
| Gala Way | NG5 9RG NG5 9RU |
| Highbury Road | NG6 8DZ NG6 9AX NG6 9BB NG6 9DA NG6 9DR |
| Hucknall Road | NG6 9GD NG6 9LQ |
| Kemmel Road | NG6 9FH |
| Mccracken Close | NG5 5ES |
| Palmwood Court | NG6 9BZ |
| Ridge Way | NG5 9LQ |
| Southglade Road | NG5 5GU |
| Swale Close | NG6 9LZ |
| Syke Road | NG5 9BG |
| The Glade Business Centre | NG5 9RW |
| Top Valley Drive | NG5 9AZ |
| Top Valley Way | NG5 9DD |
| NG6 6DZ NG6 6ED NG6 6EF NG6 6EG NG6 6DB NG6 6DN NG6 6DP NG6 6DQ NG6 6DT NG6 6DU NG6 6DW NG6 6DX NG6 6DY NG6 8ER NG6 8XR NG6 6EJ NG6 6EN NG6 6EY NG6 6EZ |
Transport near Bulwell Forest
- FAQ
- Price Paid By Year
- Property Type Price
Frequently asked questions about Bulwell Forest
What is the average price for a property for sale in Bulwell Forest?
The average price for a property for sale in Bulwell Forest is £80,782. This amount is 71% lower than the average price in Nottingham. There are 1,189 property listings for sale in Bulwell Forest.
What streets have the most expensive properties for sale in Bulwell Forest?
The street with the most expensive properties for sale in Bulwell Forest is Highbury Road at an average of £86,564.
What streets have the most affordable properties for sale in Bulwell Forest?
The street with the most affordable properties for sale in Bulwell Forest is Colston Road at an average of £75,000.
Which train stations are available in or near Bulwell Forest?
Some of the train stations available in or near Bulwell Forest are Bulwell, Hucknall and Nottingham.
Property Price Paid in Bulwell Forest by Year
The average sold property price by year was:
| Year | Average Sold Price | Price Change |
Sold Properties
|
|---|---|---|---|
| 2025 | £75,000 | -15% |
1 Property |
| 2024 | £86,564 | 2% |
1 Property |
| 2022 | £85,000 | 18% |
1 Property |
| 2019 | £69,500 | -10% |
2 Properties |
| 2018 | £76,500 | 7% |
2 Properties |
| 2017 | £71,000 | 23% |
1 Property |
| 2016 | £54,500 | 41% |
2 Properties |
| 2015 | £32,000 | - |
1 Property |
Property Price per Property Type in Bulwell Forest
Here you can find historic sold price data in order to help with your property search.
The average Property Paid Price for specific property types in the last three years are:
| Property Type | Average Sold Price | Sold Properties |
|---|---|---|
| Semi Detached House | £86,564.00 | 1 Semi Detached House |
| Flat | £75,000.00 | 1 Flat |

