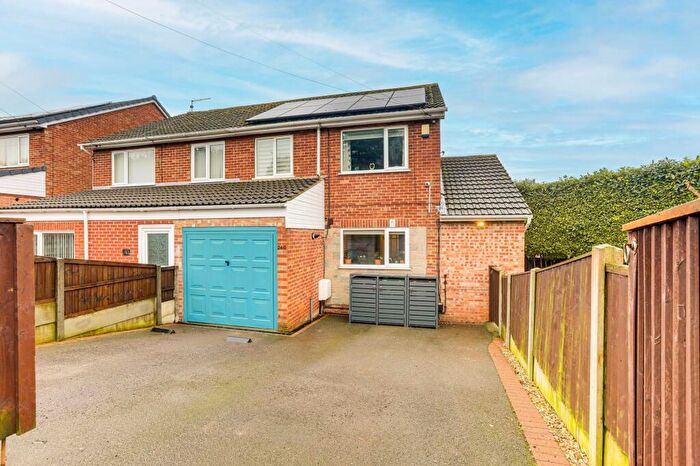
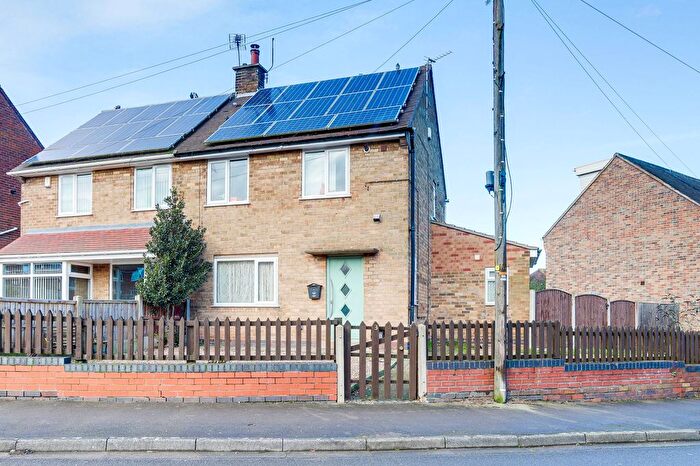
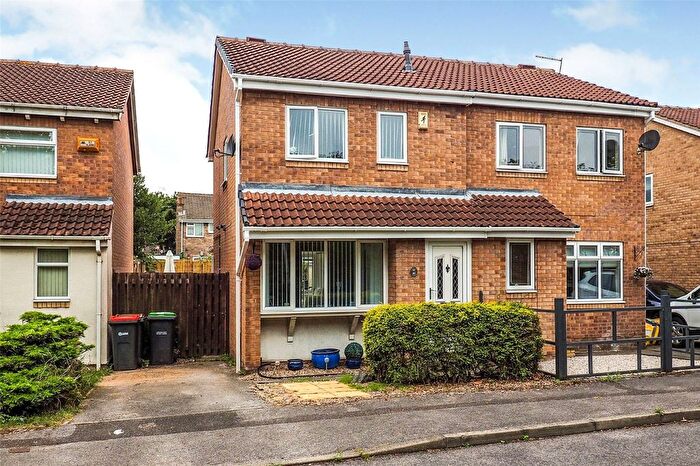
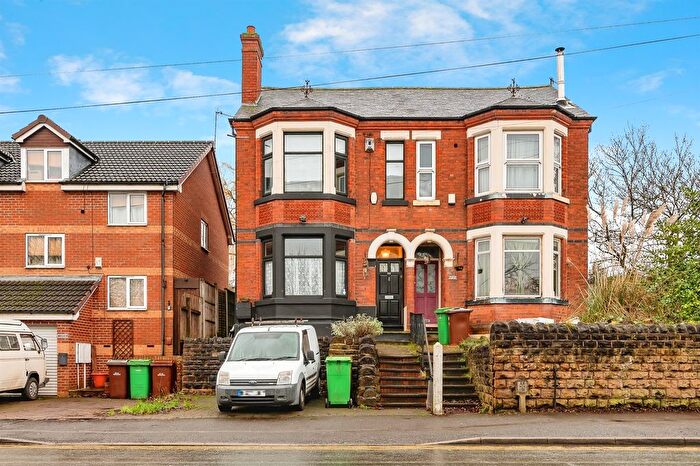
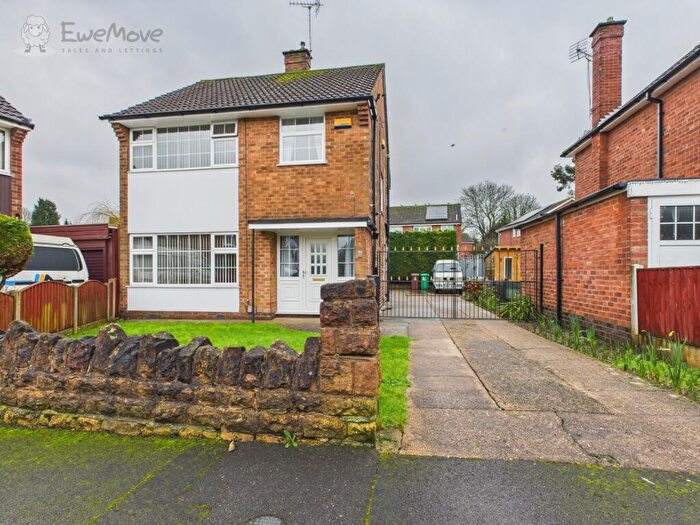
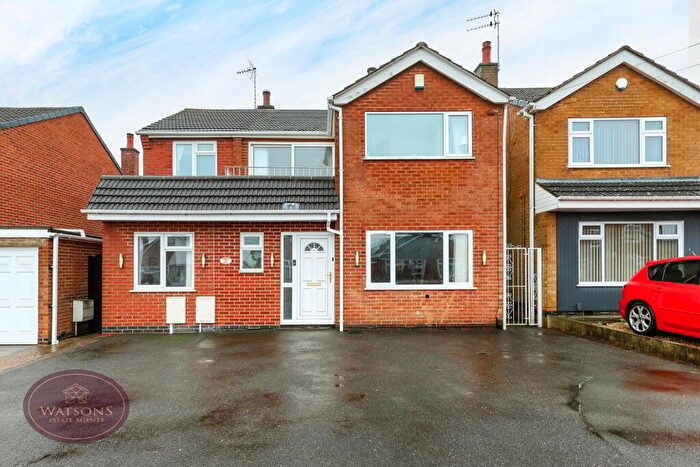
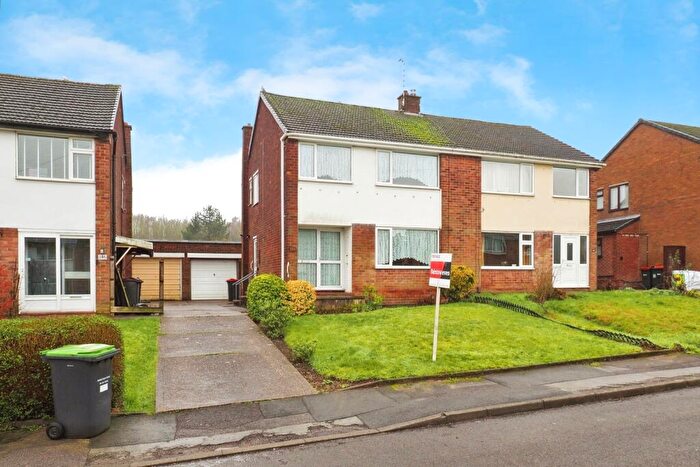
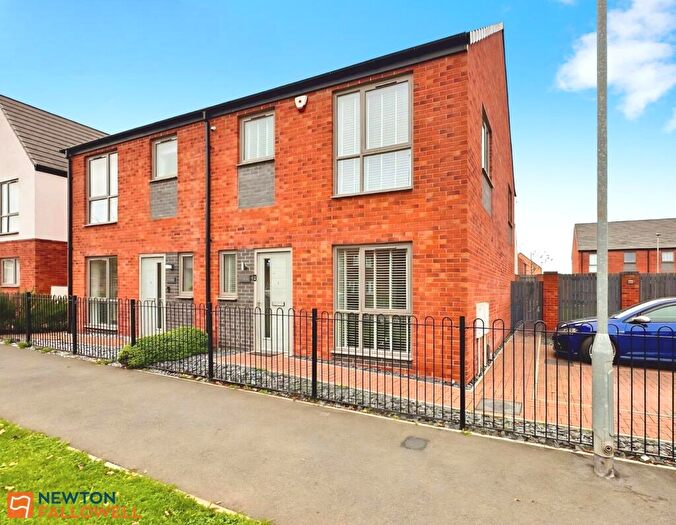
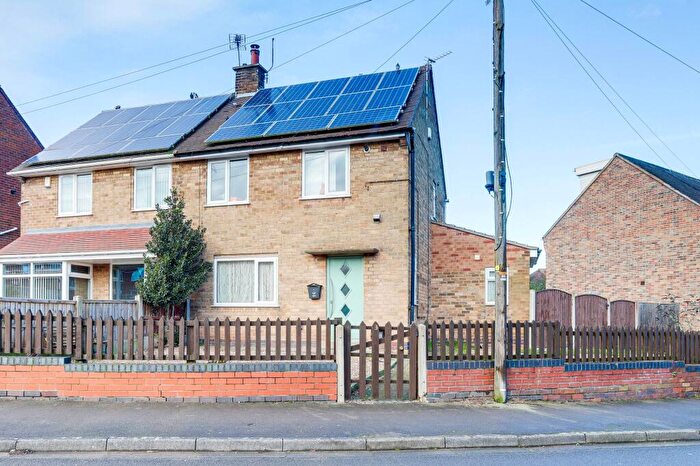
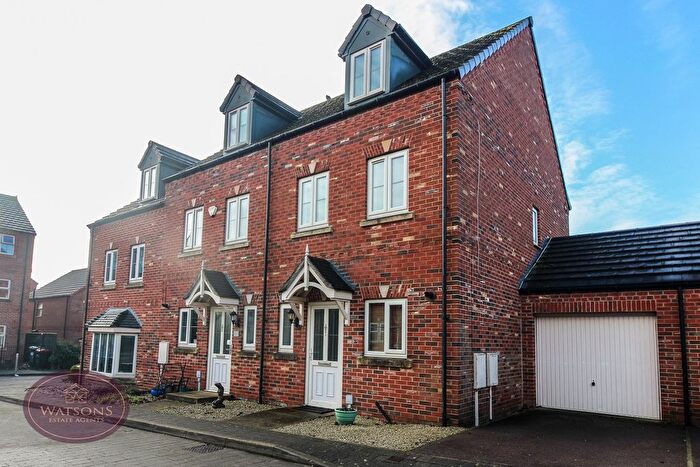
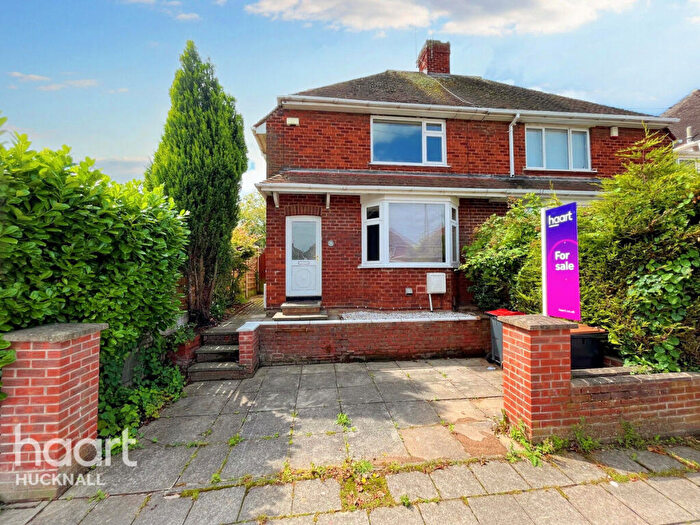
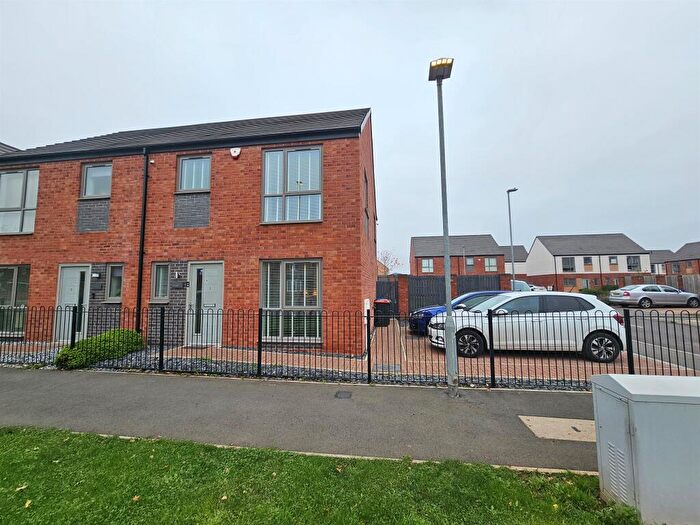
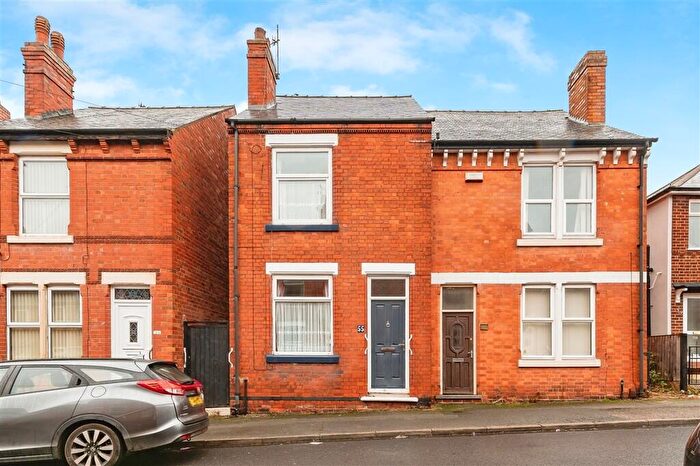
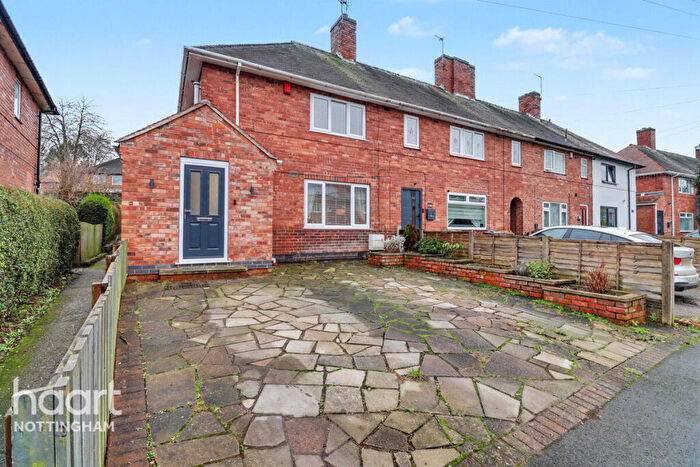
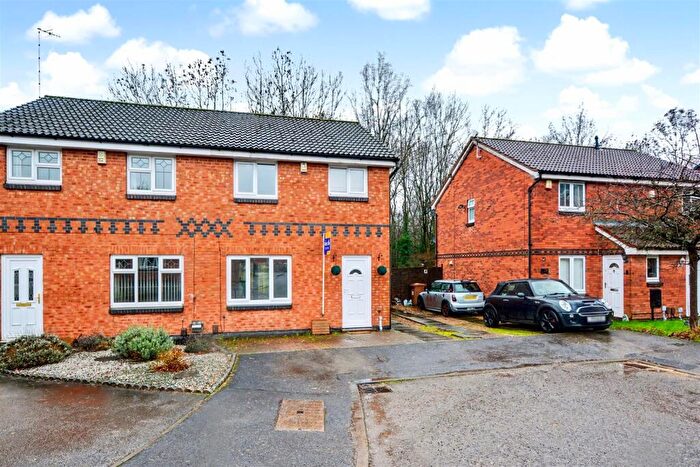
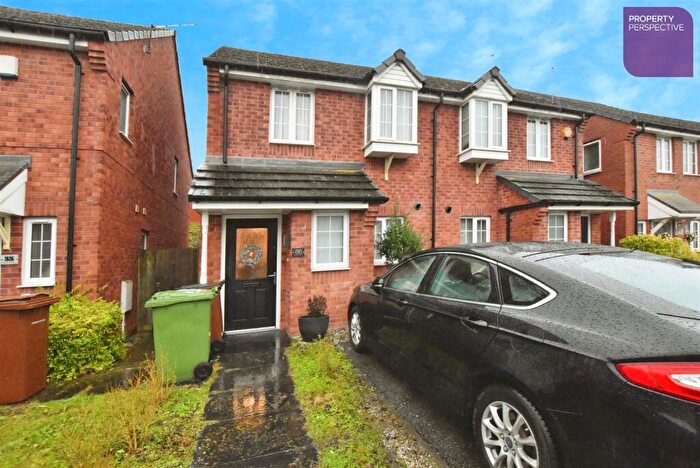
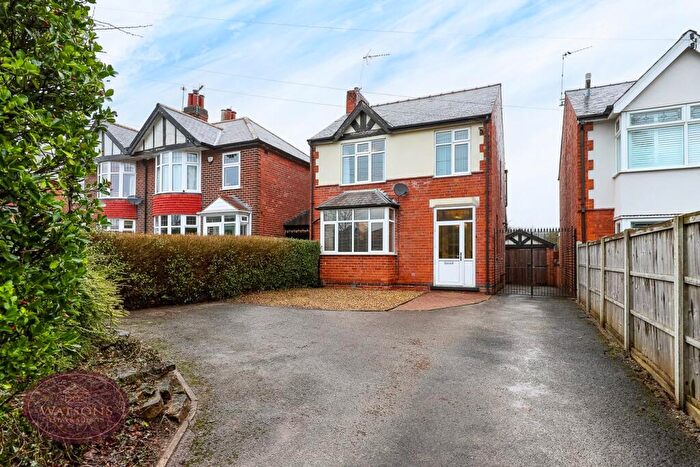
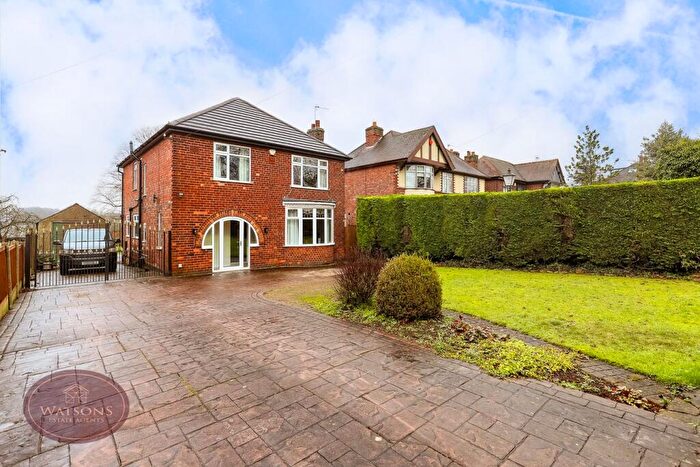
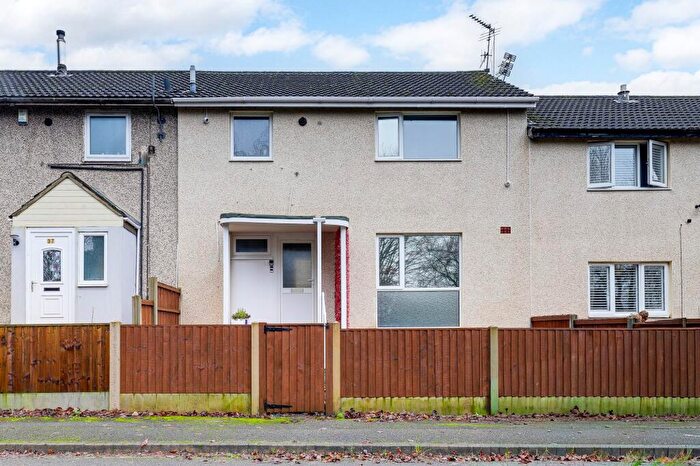
Houses for sale & to rent in Bulwell, Nottingham
House Prices in Bulwell
Properties in Bulwell have an average house price of £234,192.00 and had 13 Property Transactions within the last 3 years¹.
Bulwell is an area in Nottingham, Nottinghamshire with 549 households², where the most expensive property was sold for £277,000.00.
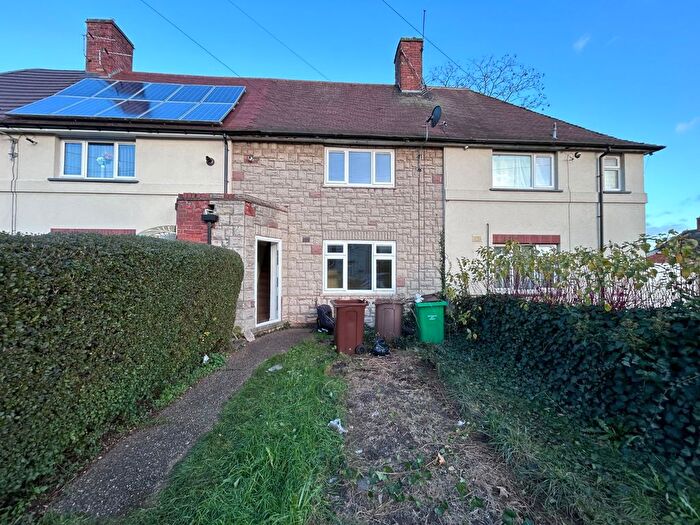
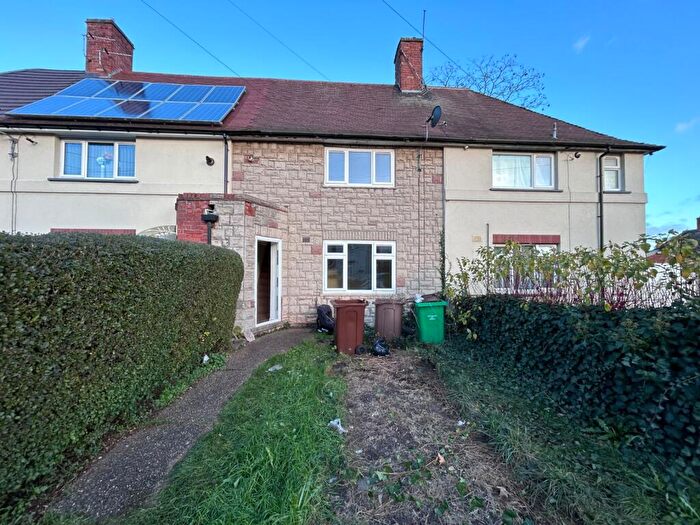
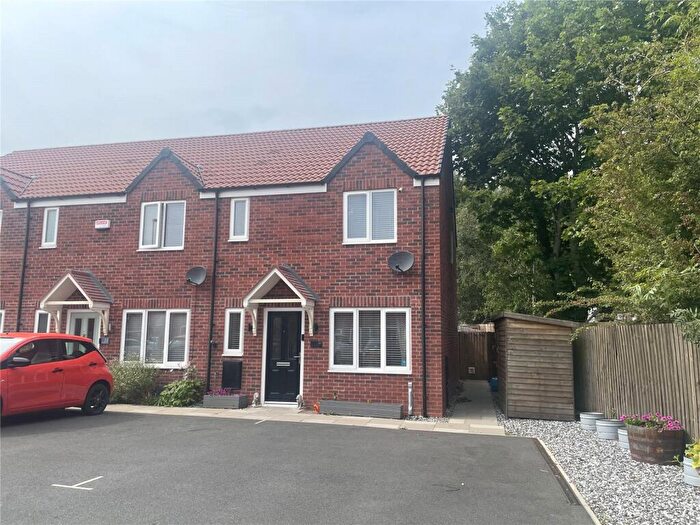
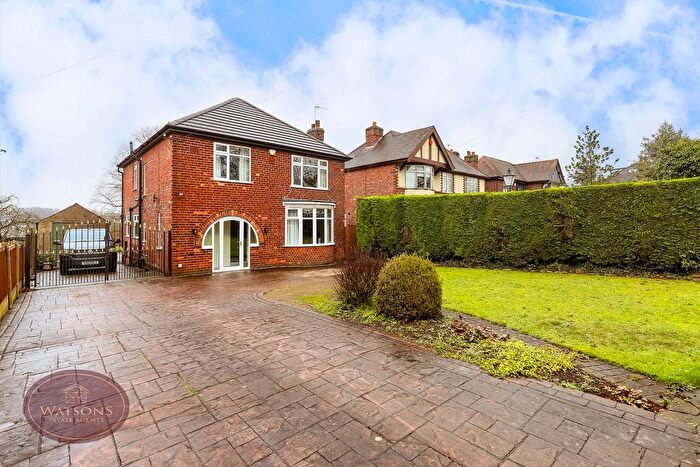
Properties for sale in Bulwell
Roads and Postcodes in Bulwell
Navigate through our locations to find the location of your next house in Bulwell, Nottingham for sale or to rent.
| Streets | Postcodes |
|---|---|
| Abercarn Mews | NG6 8YJ |
| Aldgate Close | NG6 8UQ |
| Alexander Gardens | NG6 8UX |
| Aspect Business Park | NG6 8WR |
| Aspen Road | NG6 7DS |
| Banks Yard | NG6 8FE |
| Belgrave Road | NG6 8HN NG6 8LY |
| Bennerley Court | NG6 8UT |
| Bennerley Road | NG6 8UY |
| Bestwood Road | NG6 8QS NG6 8SS NG6 8ZW |
| Bulwell High Road | NG6 8HX NG6 8NU NG6 8ZJ |
| Centenary Close | NG6 8ZP |
| Centurion Business Park | NG6 8WN |
| Colliers Way | NG8 6AL |
| Commercial Road | NG6 8HA NG6 8HD |
| Conrad Court | NG6 7BR |
| Country Crescent | NG6 8ZX |
| Coventry Road | NG6 8LU NG6 8PR NG6 8QN |
| Crabtree Road | NG6 8ZB |
| Dabell Avenue | NG6 8WA |
| Drysdale Close | NG6 8RJ |
| Duchess Gardens | NG6 8JS |
| Dursley Close | NG6 8RN |
| First Avenue | NG6 8NF |
| Firth Way | NG6 8XF |
| Freeston Drive | NG6 8UZ |
| Greasley Street | NG6 8NH |
| Harwich Close | NG6 8LD |
| Hazelhurst Gardens | NG6 8HB |
| Headstocks Close | NG6 8ZY |
| Hoewood Road | NG6 8LE |
| Holborn Place | NG6 8FB |
| Holwood Court | NG6 8LJ |
| Hucknall Lane | NG6 8AB NG6 8AJ NG6 8AQ |
| John Wright Close | NG6 8NB |
| Kett Street | NG6 8NX |
| Kiln Place | NG6 8ZD |
| Leen Drive | NG6 8EP |
| Lido Close | NG6 8AP |
| Lilian Hind Court | NG6 7FX |
| Lillington Road | NG6 8HJ NG6 8NW NG6 8UP |
| Lynam Court | NG6 8JQ |
| Main Street | NG6 8ET NG6 8EW NG6 8QD NG6 8QG NG6 8QH NG6 8QJ NG6 8QL NG6 8QP |
| Mariner Court | NG6 7BW |
| Market Place | NG6 8QA |
| Martin Close | NG6 8UW |
| Martin Court | NG6 8US |
| Millennium Way East | NG8 6AR |
| Naomi Court | NG6 8EG |
| Newcastle Street | NG6 8AW |
| Occupation Road | NG6 8RD NG6 8RX |
| Odesa Drive | NG6 8QT |
| Phoenix Place | NG8 6BA |
| Pottery Court | NG6 8YN |
| Pottery Way | NG6 8GN |
| Ragdale Place | NG6 8PA |
| Rowan Gardens | NG6 7GQ |
| Sandstone Court | NG6 8NN |
| Second Avenue | NG6 8NE |
| Sellers Wood Drive | NG6 8ZE |
| Severn Industrial Estate | NG6 8LZ |
| Sketchley Court | NG6 7DL |
| Snape Nook Court | NG6 7GB |
| Snape Wood Road | NG6 7GH |
| Springhead Court | NG6 8DX |
| Springhill Close | NG6 8EB |
| Squires Avenue | NG6 8GG NG6 8GH NG6 8HG |
| Third Avenue | NG6 8ND |
| Totley Close | NG6 8DD |
| Vere Street | NG6 8YL |
| Vision Business Park | NG6 8GF |
| Widdowson Close | NG6 8WB |
| NG6 8GJ |
Transport near Bulwell
- FAQ
- Price Paid By Year
- Property Type Price
Frequently asked questions about Bulwell
What is the average price for a property for sale in Bulwell?
The average price for a property for sale in Bulwell is £234,192. This amount is 17% lower than the average price in Nottingham. There are 3,904 property listings for sale in Bulwell.
What streets have the most expensive properties for sale in Bulwell?
The streets with the most expensive properties for sale in Bulwell are Country Crescent at an average of £252,500 and Headstocks Close at an average of £245,000.
What streets have the most affordable properties for sale in Bulwell?
The street with the most affordable properties for sale in Bulwell is Bestwood Road at an average of £225,562.
Which train stations are available in or near Bulwell?
Some of the train stations available in or near Bulwell are Bulwell, Hucknall and Ilkeston.
Property Price Paid in Bulwell by Year
The average sold property price by year was:
| Year | Average Sold Price | Price Change |
Sold Properties
|
|---|---|---|---|
| 2024 | £225,937 | -9% |
8 Properties |
| 2023 | £247,400 | 13% |
5 Properties |
| 2022 | £215,900 | 16% |
5 Properties |
| 2021 | £181,250 | -9% |
4 Properties |
| 2020 | £196,875 | 2% |
12 Properties |
| 2019 | £192,564 | 24% |
39 Properties |
| 2018 | £146,000 | 61% |
2 Properties |
| 2017 | £57,000 | -777% |
1 Property |
| 2016 | £500,000 | 73% |
1 Property |
| 2015 | £133,000 | -50% |
1 Property |
| 2010 | £200,000 | - |
1 Property |
| 2004 | £200,000 | 41% |
2 Properties |
| 2002 | £117,500 | 66% |
1 Property |
| 2001 | £40,000 | 14% |
1 Property |
| 2000 | £34,250 | -250% |
2 Properties |
| 1999 | £120,000 | - |
1 Property |
Property Price per Property Type in Bulwell
Here you can find historic sold price data in order to help with your property search.
The average Property Paid Price for specific property types in the last three years are:
| Property Type | Average Sold Price | Sold Properties |
|---|---|---|
| Semi Detached House | £230,409.00 | 11 Semi Detached Houses |
| Detached House | £275,000.00 | 1 Detached House |
| Terraced House | £235,000.00 | 1 Terraced House |

