
Houses for sale & to rent in Central & New Cross, Nottingham
House Prices in Central & New Cross
Properties in Central & New Cross have no sales history available within the last 3 years.
Central & New Cross is an area in Nottingham, Nottinghamshire with 33 households².
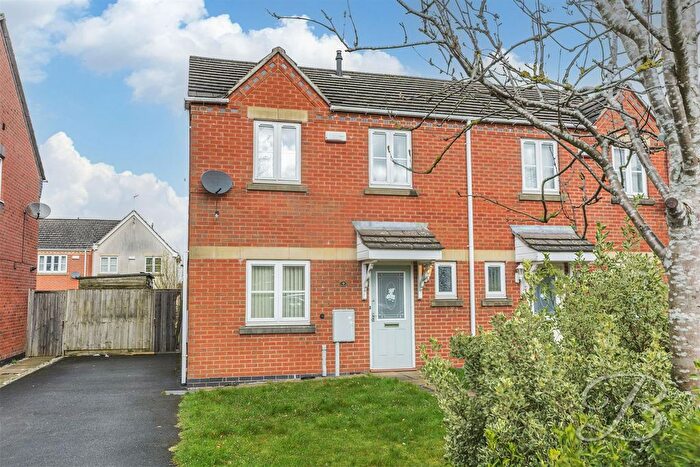
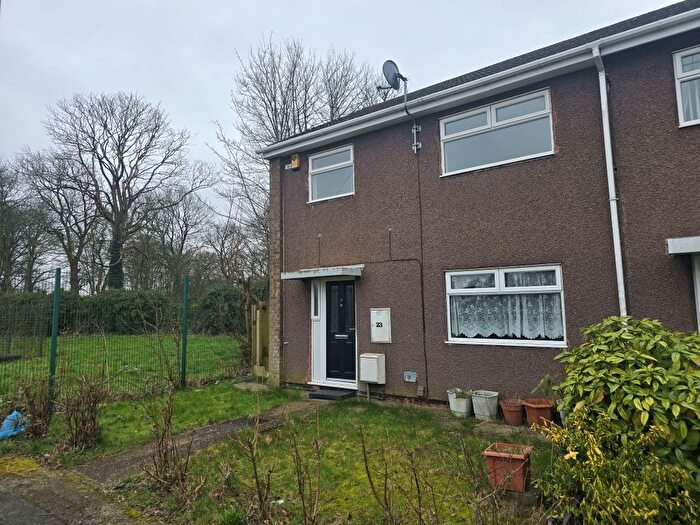
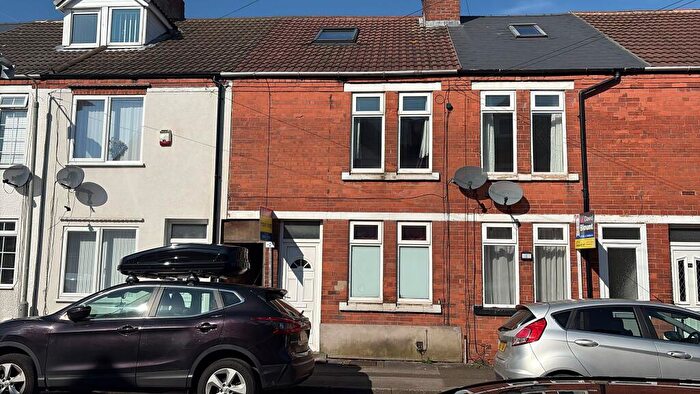
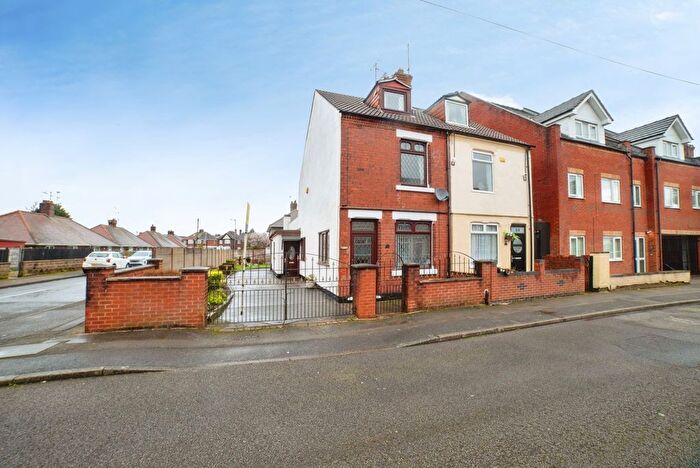
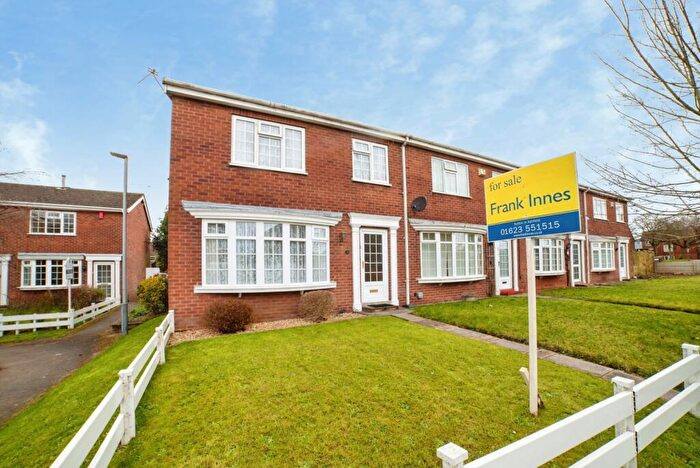
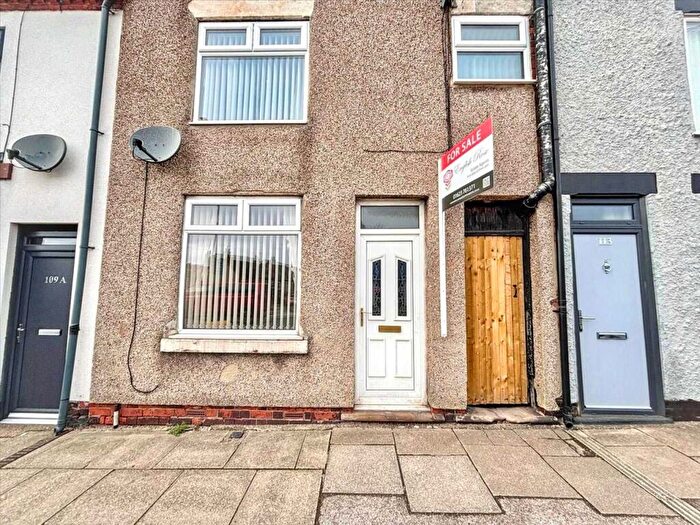
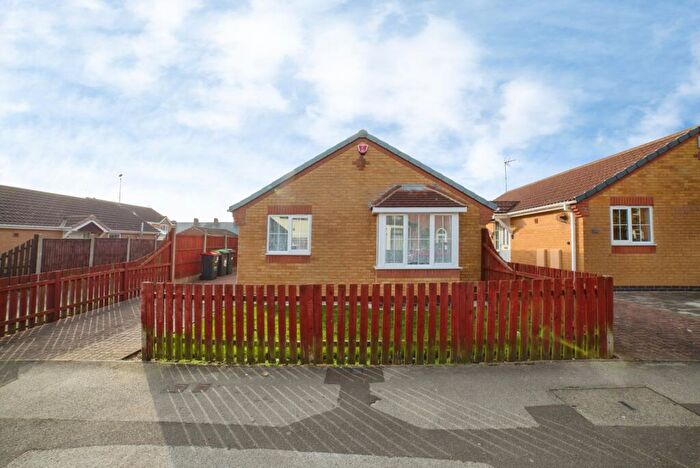
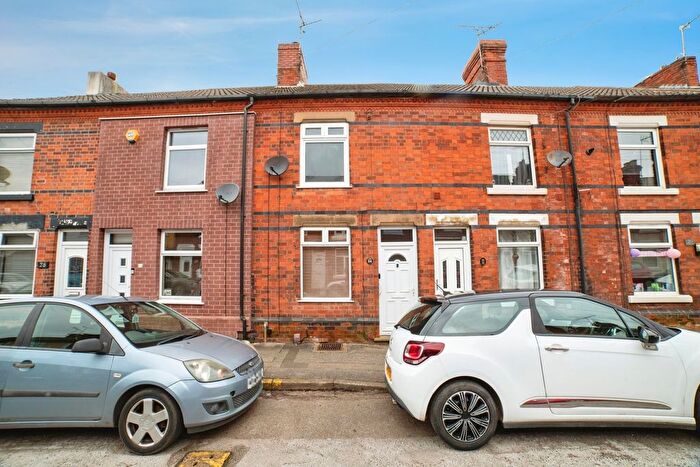
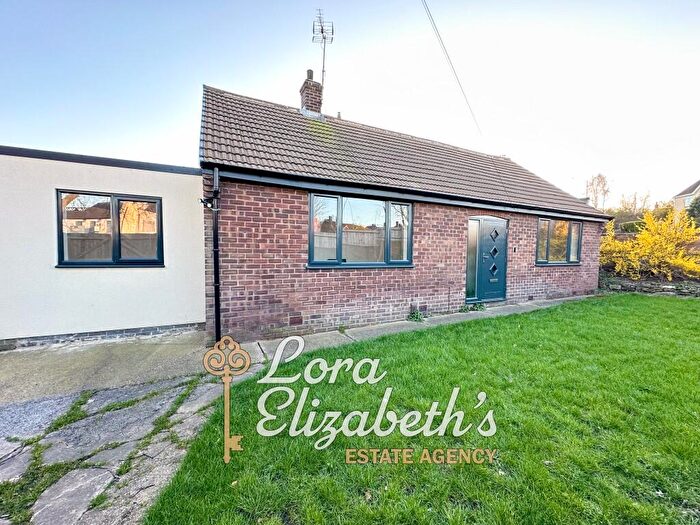
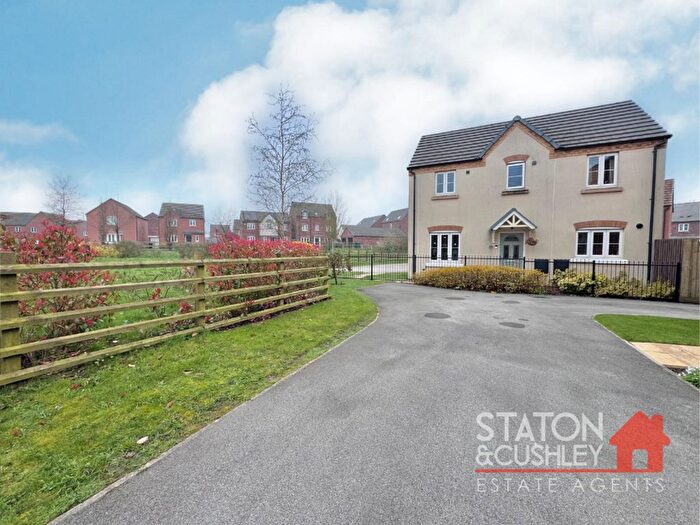
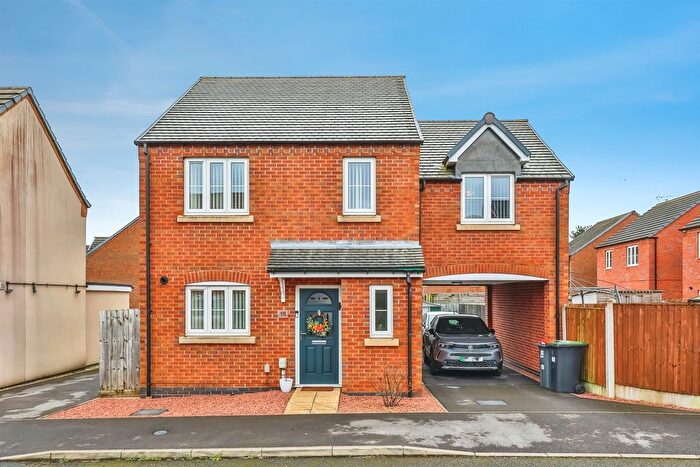
Properties for sale in Central & New Cross
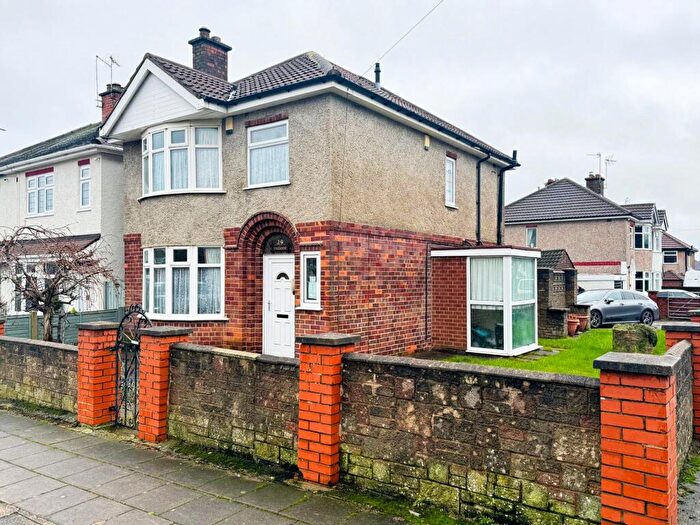
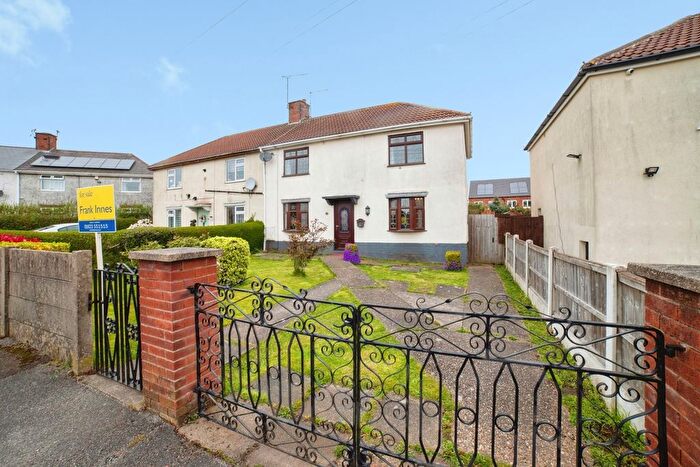
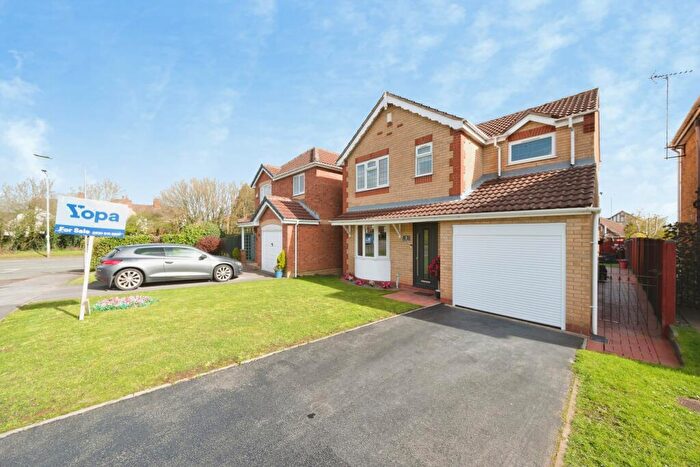
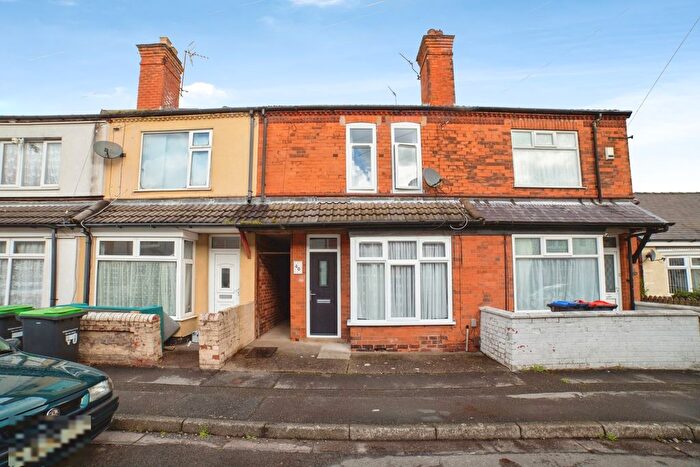
![]()
If you are looking to sell your house, let it out, or receive a property valuation, an expert can help you.
Click the button below to get started.


Roads and Postcodes in Central & New Cross
Navigate through our locations to find the location of your next house in Central & New Cross, Nottingham for sale or to rent.
| Streets | Postcodes |
|---|---|
| Bridge Close | NG17 5GP |
| Cursham Street | NG17 5FD |
| Forest Street | NG17 1BE NG17 1DA |
| Hardwick Street | NG17 1EN |
| High Pavement | NG17 1EB |
| King Street | NG17 1AT |
| Langton Road | NG17 1AA NG17 1ER |
| Low Street | NG17 1DG NG17 1DH NG17 1EL |
| Market Street | NG17 1AG |
| New Street | NG17 1BW |
| Parliament Street | NG17 1DB |
| Portland Square | NG17 1AZ NG17 1BA |
| Station Road | NG17 5FH NG17 5FJ NG17 5JA |
| Sutton Centre | NG17 1EE |
| The Homelands | NG17 5EN |
| The Idlewells | NG17 1BJ NG17 1BL NG17 1BN NG17 1BP |
| NG17 0AZ NG17 0DR NG17 0DX NG17 0EA NG17 0EE NG17 0EF NG17 0EG NG17 7QU NG17 7QX NG17 7WS NG17 7WZ NG17 7XA |
Transport near Central & New Cross

- FAQ
- Price Paid By Year
Frequently asked questions about Central & New Cross
Which train stations are available in or near Central & New Cross?
Some of the train stations available in or near Central & New Cross are Sutton Parkway, Kirkby in Ashfield and Mansfield Town.
Property Price Paid in Central & New Cross by Year
The average sold property price by year was:
| Year | Average Sold Price | Price Change |
Sold Properties
|
|---|---|---|---|
| 2022 | £220,000 | 27% |
1 Property |
| 2021 | £160,000 | 38% |
1 Property |
| 2020 | £100,000 | 60% |
1 Property |
| 2018 | £39,950 | -32% |
1 Property |
| 2017 | £52,712 | -128% |
4 Properties |
| 2016 | £120,000 | -5% |
1 Property |
| 2015 | £126,000 | 9% |
2 Properties |
| 2014 | £114,950 | -0,5% |
1 Property |
| 2013 | £115,475 | -91% |
2 Properties |
| 2007 | £220,000 | 84% |
1 Property |
| 2005 | £35,000 | -671% |
1 Property |
| 2000 | £270,000 | 67% |
2 Properties |
| 1998 | £90,100 | - |
1 Property |