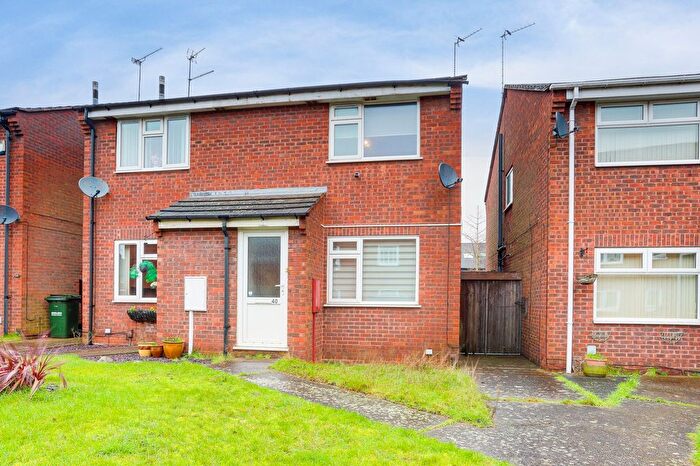
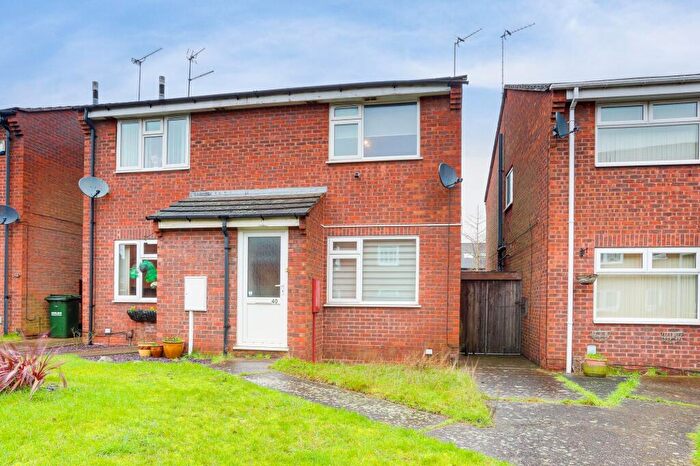
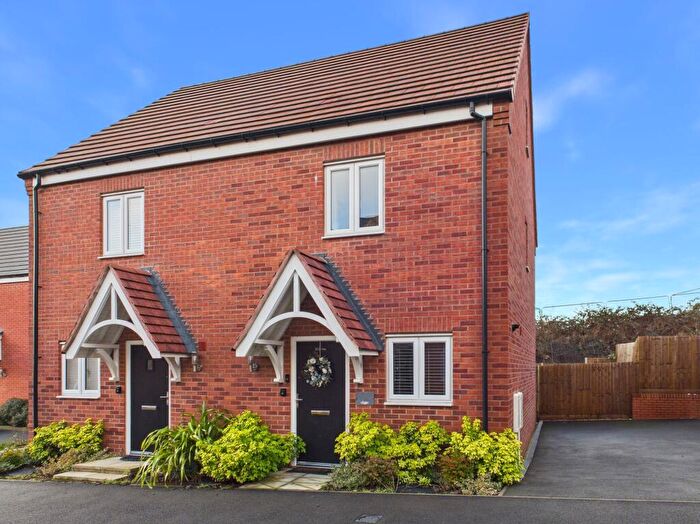
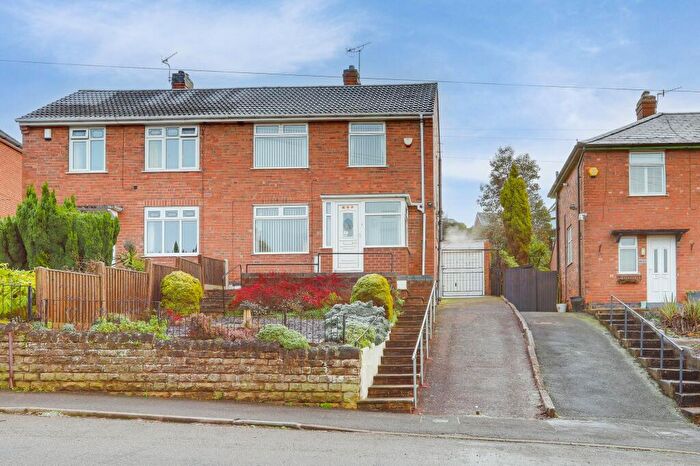
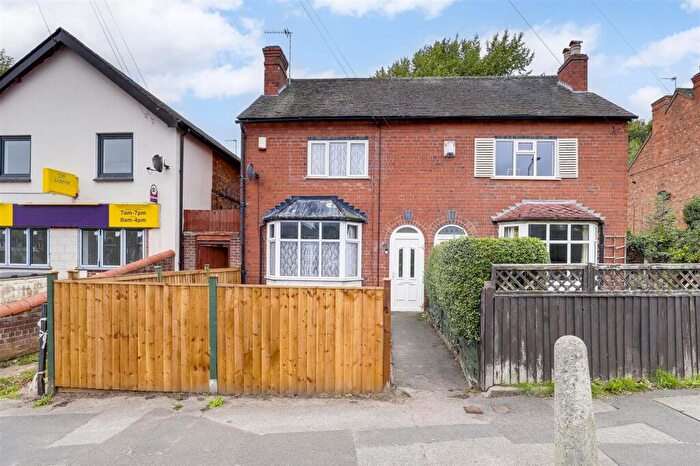
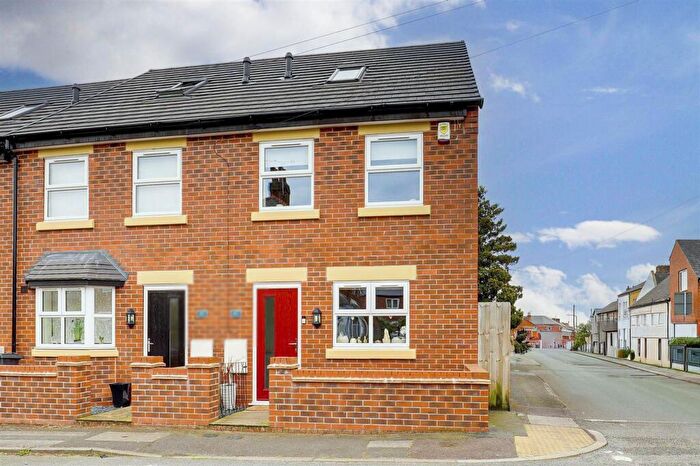
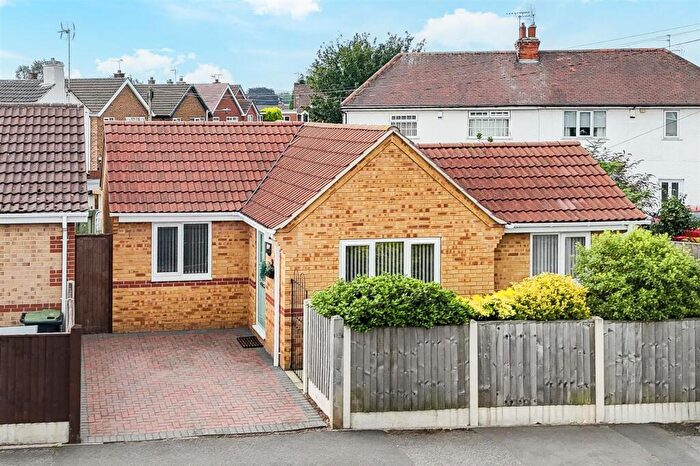
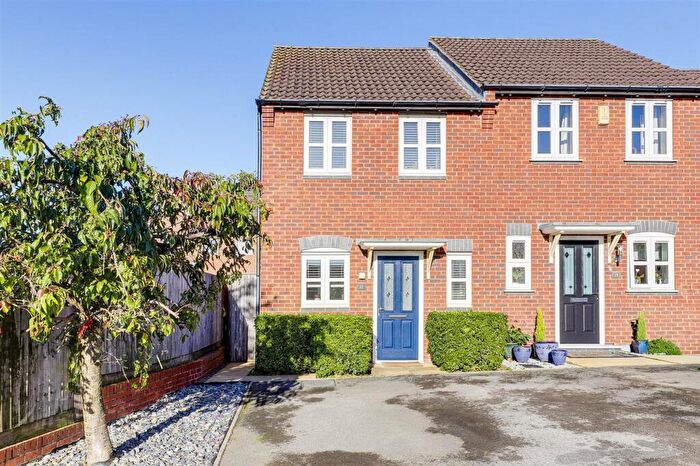
Houses for sale & to rent in St Marys, Nottingham
House Prices in St Marys
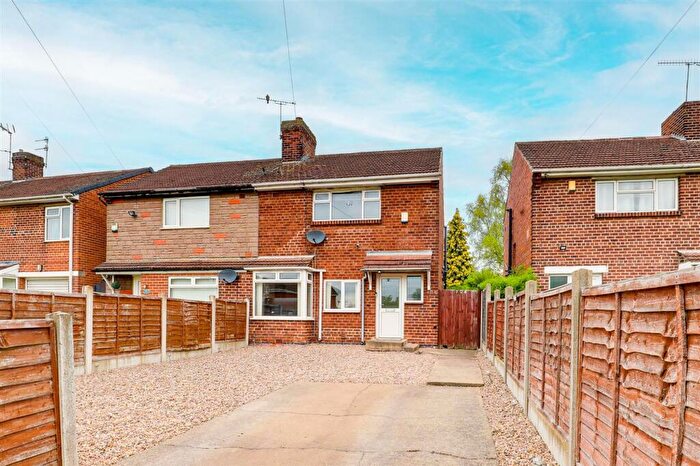
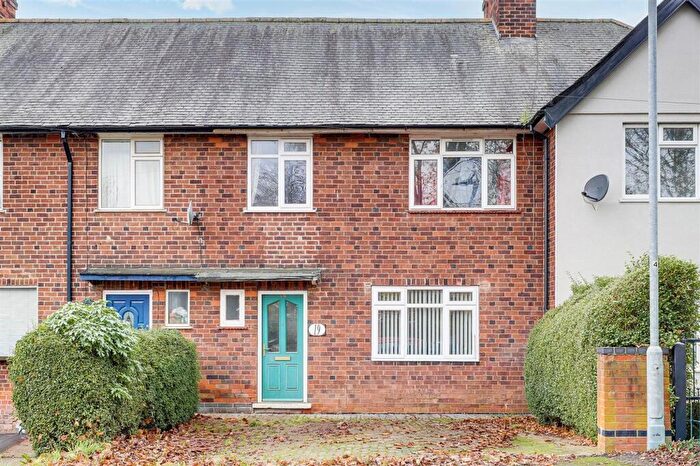
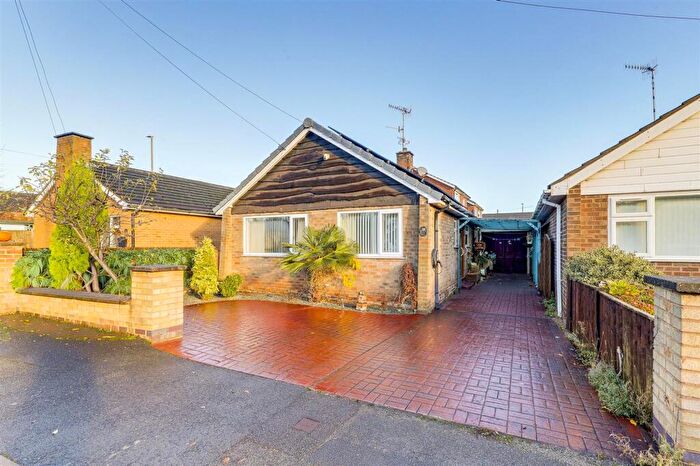
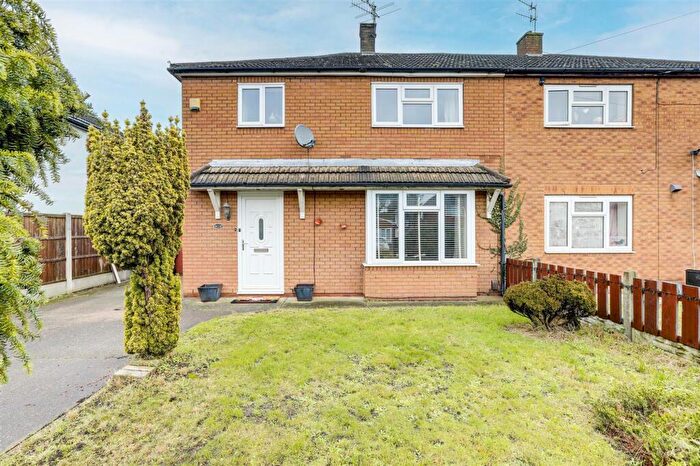
Properties in St Marys have an average house price of £247,459.52 and had 296 Property Transactions within the last 3 years¹.
St Marys is an area in Nottingham, Nottinghamshire with 2,839 households², where the most expensive property was sold for £770,000.00.
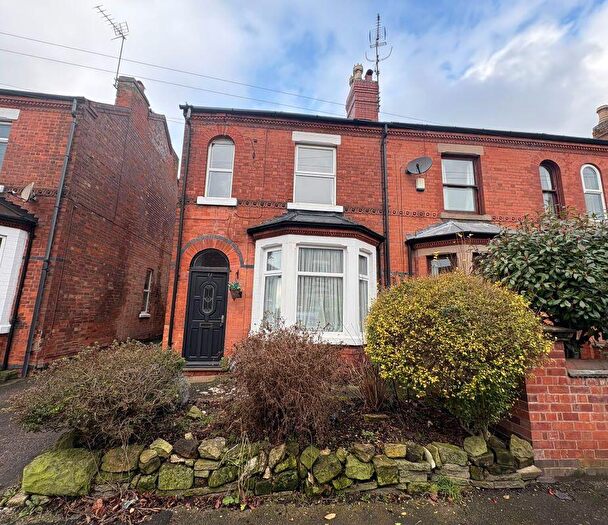
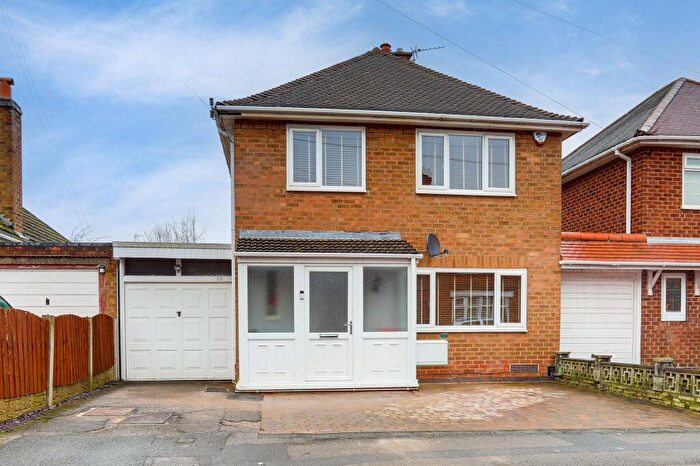
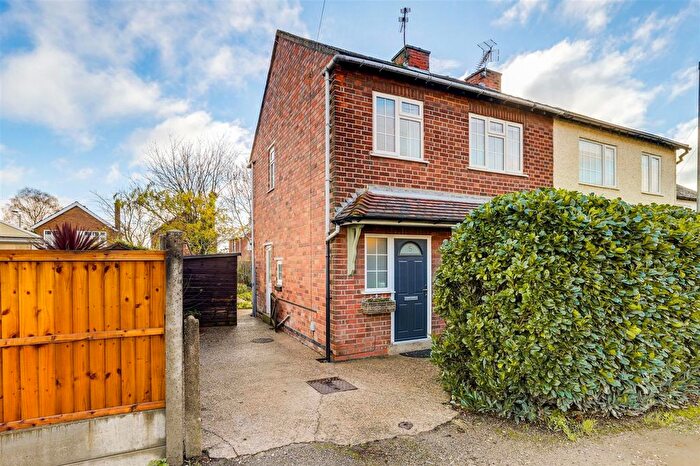
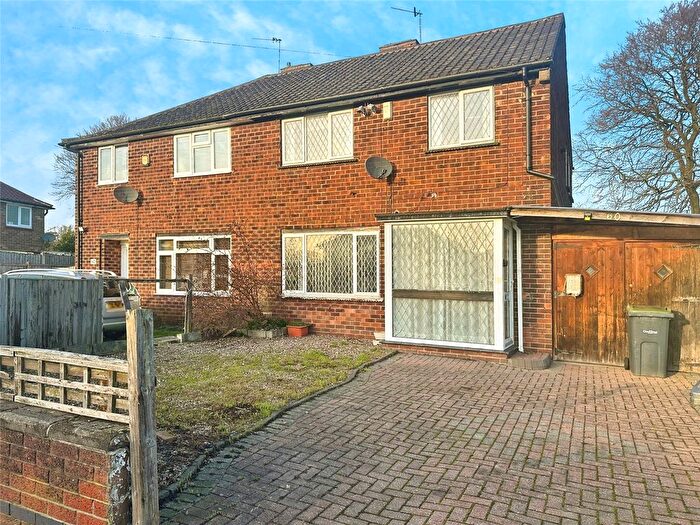
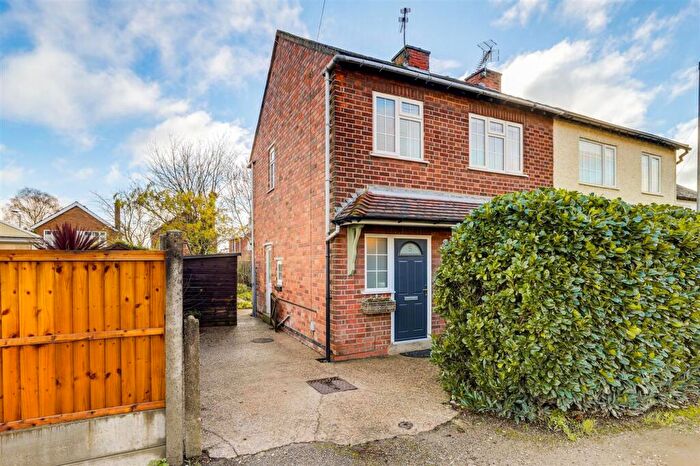
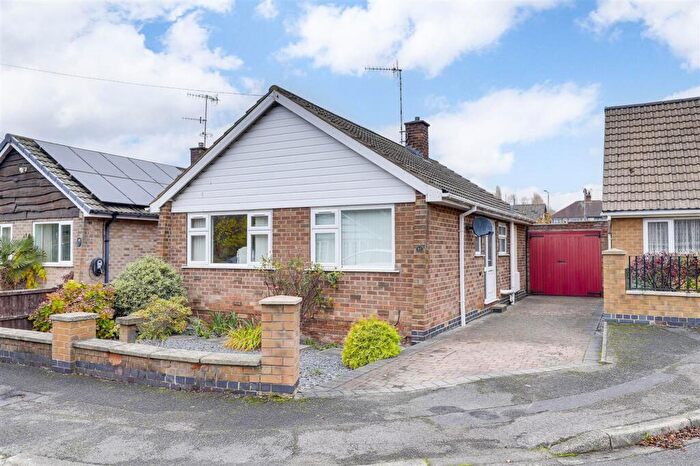
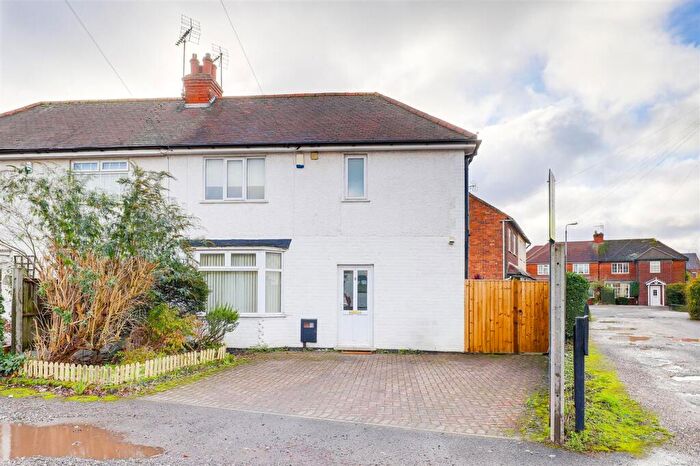
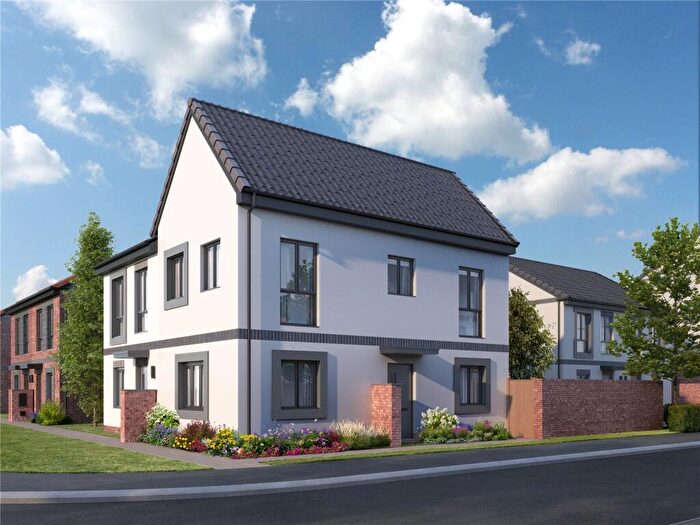
Properties for sale in St Marys
Roads and Postcodes in St Marys
Navigate through our locations to find the location of your next house in St Marys, Nottingham for sale or to rent.
| Streets | Postcodes |
|---|---|
| Albion Rise | NG5 8EX |
| Allens Walk | NG5 8HF |
| Angela Close | NG5 8HW |
| Arch Hill | NG5 8PF |
| Ashington Drive | NG5 8GH NG5 8UA |
| Ashton Avenue | NG5 8LL |
| Baker Avenue | NG5 8FU NG5 8FW |
| Bonington Drive | NG5 7EX |
| Brackendale Avenue | NG5 8DQ |
| Brook Street | NG17 1NZ |
| Calverton Road | NG5 8FF NG5 8FH NG5 8FN NG5 8FQ NG5 8FR NG5 8FS NG5 8GG |
| Catriona Crescent | NG5 8EN |
| Charlotte Close | NG5 8JR |
| Church Lane | NG5 8HG NG5 8HH NG5 8HJ |
| Church Street | NG5 8FB NG5 8FE |
| Churchmoor Court | NG5 8JA |
| Churchmoor Lane | NG5 8HL NG5 8HN |
| Clarke Avenue | NG5 8DL |
| Cogenhoe Walk | NG5 8LF |
| Coppice Gate | NG5 7GH |
| Coppice Road | NG5 7GD NG5 7GE NG5 7GQ NG5 7GR NG5 7HU |
| Cranmore Close | NG5 8GJ |
| Cranston Avenue | NG5 8DP |
| Craster Drive | NG5 8SL |
| Croft Road | NG5 7DX |
| Derby Street | NG5 7EQ |
| Derry Drive | NG5 8RT |
| Derry Hill Road | NG5 8HP NG5 8HQ |
| Devonshire Square | NG17 1AJ |
| Dorket Close | NG5 8ET |
| Elder Close | NG5 8GF |
| Ellington Road | NG5 8SJ |
| Gedling Road | NG5 6NQ |
| Georgia Drive | NG5 8HX |
| Glanton Way | NG5 8SN |
| Grenville Rise | NG5 8EW |
| Harpole Walk | NG5 8LJ |
| High Street | NG5 7DZ |
| Hirst Close | NG5 8RL |
| Homefield Avenue | NG5 8FZ NG5 8GA |
| Houldsworth Rise | NG5 8HZ |
| Huthwaite Road | NG17 2EL |
| Islay Close | NG5 8FL |
| Jenned Road | NG5 8FT |
| Karen Rise | NG5 8GE |
| Kempton Drive | NG5 8EU |
| Kenneth Road | NG5 8HY |
| Kirkley Gardens | NG5 7GF |
| Lammas Close | NG17 1AX |
| Lawdon Road | NG5 8EF |
| Leivers Avenue | NG5 7FU NG5 7FW |
| Lilleker Rise | NG5 8HS |
| Litchfield Rise | NG5 8HU |
| Lodge Farm Lane | NG5 8HR |
| Longhirst Drive | NG5 8TU |
| Longthorpe Court | NG5 7LY |
| Lynemouth Court | NG5 8TY |
| Mellors Road | NG5 8HD NG5 8HE |
| Mitford Drive | NG5 8BR |
| Morven Avenue | NG17 1AN NG17 1BF |
| Mowbray Rise | NG5 8DW |
| Norbett Road | NG5 8DN NG5 8EA NG5 8EB |
| Northside Walk | NG5 8LG |
| Patricia Drive | NG5 8EH NG5 8EJ |
| Pegswood Drive | NG5 8TX |
| Pentwood Avenue | NG5 8RR |
| Pond Hills Lane | NG5 8DR NG5 8DS NG5 8DX NG5 8DY |
| Rannoch Rise | NG5 8FJ |
| Ravenswood Road | NG5 7FP NG5 7FQ NG5 7FR NG5 7FY NG5 7GB |
| Redhill Road | NG5 8HA NG5 8HB |
| Rookery Gardens | NG5 7FX |
| Roscoe Avenue | NG5 8JZ |
| Rosegrove Avenue | NG5 8DU |
| Runswick Court | NG5 7GW |
| Runswick Drive | NG5 7FZ NG5 7GA |
| Ruth Drive | NG5 8EZ |
| Shotton Drive | NG5 8SW |
| Sibson Walk | NG5 8LE |
| Smithy Crescent | NG5 7FS NG5 7FT |
| St Marys Close | NG5 8FG |
| Stakeford Court | NG5 8SR |
| Sunbury Gardens | NG5 8EL |
| Sunninghill Rise | NG5 8ES |
| Surgeys Lane | NG5 8EP NG5 8ER NG5 8EY NG5 8FX NG5 8FY NG5 8GB NG5 8GD |
| Sutton Road | NG5 8LB |
| Tene Close | NG5 8RS |
| Thrapston Avenue | NG5 8LH |
| Ulgham Close | NG5 8UF |
| Upminster Drive | NG5 8DT |
| Victoria Close | NG5 8FP |
| Walton Road | NG5 8EG |
| Wansbeck Close | NG5 8SS |
| Wansford Avenue | NG5 8LD |
| West End Court | NG17 1FD |
| Widdington Close | NG5 8TZ |
| Willbert Road | NG5 8ED NG5 8EE |
| Willowbridge Court | NG17 1FY |
| Willowbridge Lane | NG17 1EH |
| Worrall Avenue | NG5 7GJ NG5 7GL NG5 7GN NG5 7GP |
Transport near St Marys
-
Bulwell Station
-
Hucknall Station
-
Carlton Station
-
Netherfield Station
-
Burton Joyce Station
-
Nottingham Station
- FAQ
- Price Paid By Year
- Property Type Price
Frequently asked questions about St Marys
What is the average price for a property for sale in St Marys?
The average price for a property for sale in St Marys is £247,460. This amount is 12% lower than the average price in Nottingham. There are 369 property listings for sale in St Marys.
What streets have the most expensive properties for sale in St Marys?
The streets with the most expensive properties for sale in St Marys are Arch Hill at an average of £612,500, Craster Drive at an average of £422,500 and Longhirst Drive at an average of £418,500.
What streets have the most affordable properties for sale in St Marys?
The streets with the most affordable properties for sale in St Marys are Longthorpe Court at an average of £78,000, High Street at an average of £105,000 and Smithy Crescent at an average of £140,666.
Which train stations are available in or near St Marys?
Some of the train stations available in or near St Marys are Bulwell, Hucknall and Carlton.
Property Price Paid in St Marys by Year
The average sold property price by year was:
| Year | Average Sold Price | Price Change |
Sold Properties
|
|---|---|---|---|
| 2025 | £256,683 | 4% |
97 Properties |
| 2024 | £247,102 | 4% |
120 Properties |
| 2023 | £236,676 | 1% |
79 Properties |
| 2022 | £234,717 | 5% |
113 Properties |
| 2021 | £222,765 | 8% |
118 Properties |
| 2020 | £204,877 | 6% |
98 Properties |
| 2019 | £192,426 | 9% |
129 Properties |
| 2018 | £174,876 | 5% |
121 Properties |
| 2017 | £166,093.77 | 8% |
129 Properties |
| 2016 | £152,843 | -4% |
115 Properties |
| 2015 | £158,262 | -2% |
147 Properties |
| 2014 | £160,642 | 6% |
184 Properties |
| 2013 | £150,825 | 1% |
132 Properties |
| 2012 | £149,955 | 14% |
130 Properties |
| 2011 | £129,666 | 5% |
77 Properties |
| 2010 | £123,626 | -2% |
63 Properties |
| 2009 | £125,736 | 4% |
75 Properties |
| 2008 | £121,144 | -14% |
56 Properties |
| 2007 | £138,678 | -0,5% |
117 Properties |
| 2006 | £139,327 | 1% |
109 Properties |
| 2005 | £137,330 | 6% |
95 Properties |
| 2004 | £129,470 | 6% |
114 Properties |
| 2003 | £122,052 | 28% |
122 Properties |
| 2002 | £88,364 | 16% |
117 Properties |
| 2001 | £74,308.48 | 12% |
128 Properties |
| 2000 | £65,716 | 11% |
113 Properties |
| 1999 | £58,328 | -7% |
173 Properties |
| 1998 | £62,233 | 12% |
116 Properties |
| 1997 | £54,838 | 3% |
128 Properties |
| 1996 | £53,282 | -1% |
108 Properties |
| 1995 | £53,874 | - |
104 Properties |
Property Price per Property Type in St Marys
Here you can find historic sold price data in order to help with your property search.
The average Property Paid Price for specific property types in the last three years are:
| Property Type | Average Sold Price | Sold Properties |
|---|---|---|
| Semi Detached House | £218,025.00 | 130 Semi Detached Houses |
| Detached House | £314,272.00 | 114 Detached Houses |
| Terraced House | £181,932.00 | 44 Terraced Houses |
| Flat | £134,075.00 | 8 Flats |

