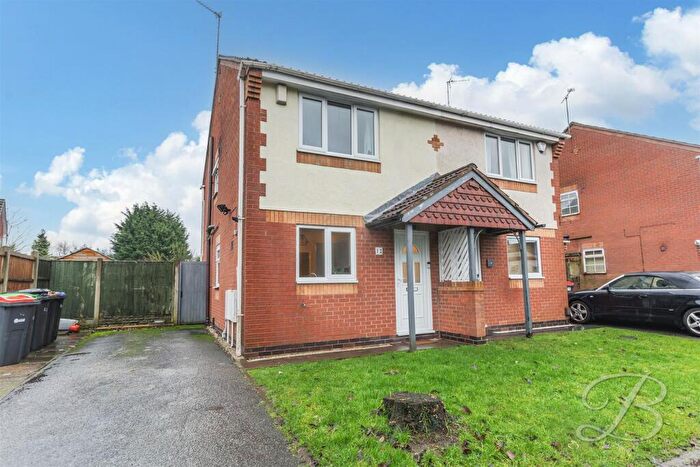
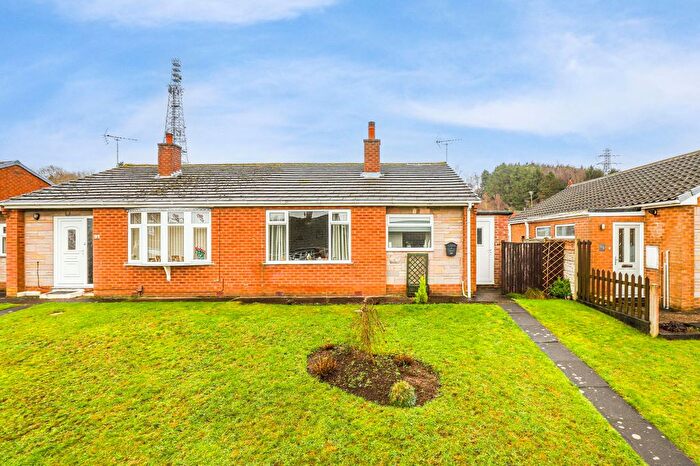
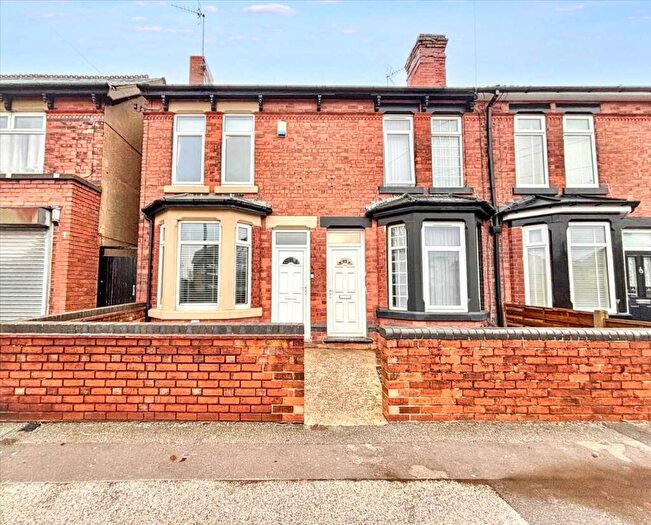
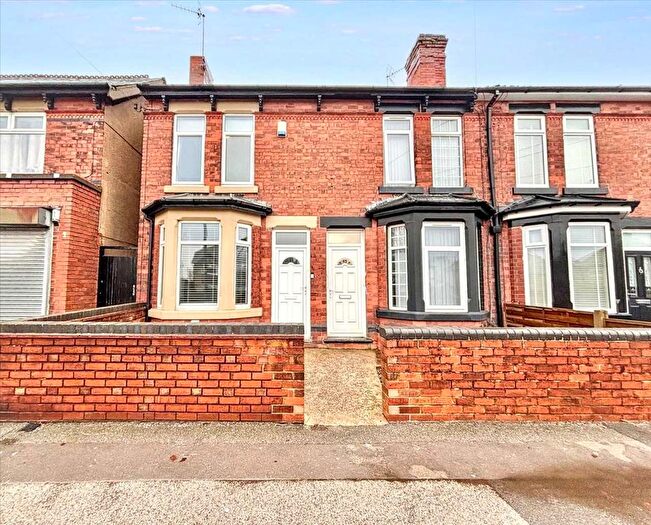
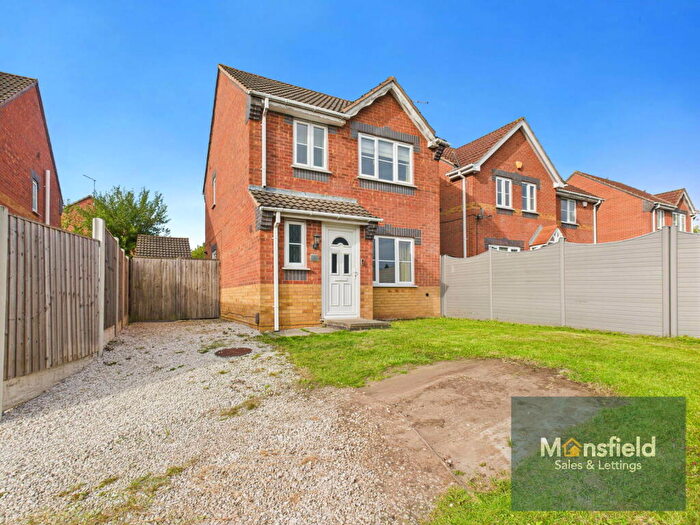
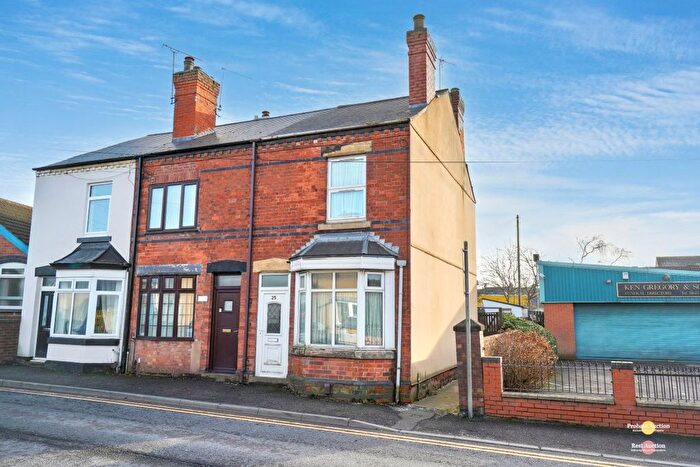
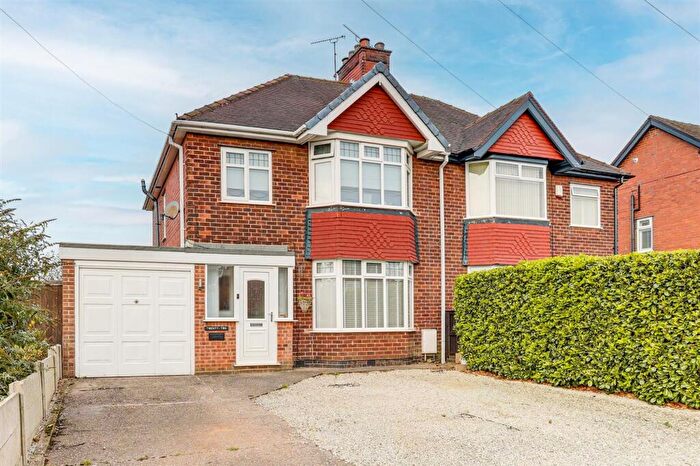
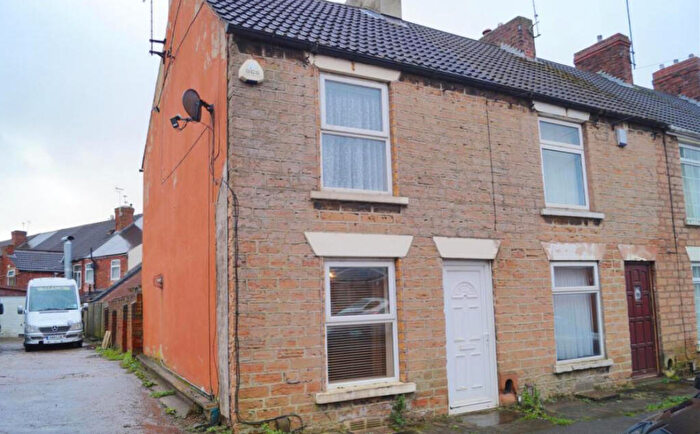
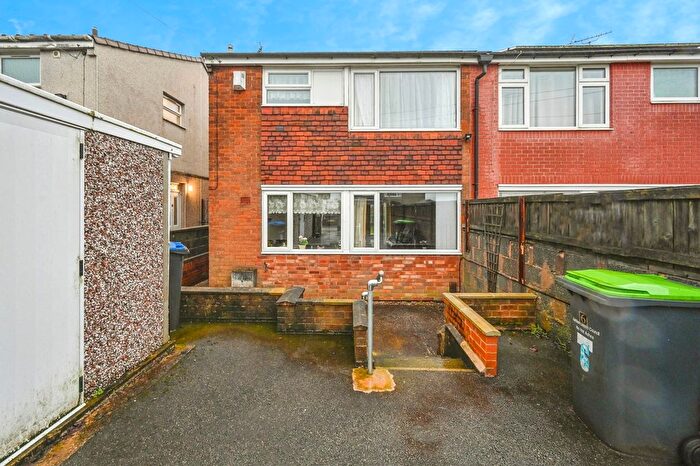
Houses for sale & to rent in Kirkby In Ashfield Central, Nottingham
House Prices in Kirkby In Ashfield Central
Properties in Kirkby In Ashfield Central have an average house price of £188,764.00 and had 331 Property Transactions within the last 3 years¹.
Kirkby In Ashfield Central is an area in Nottingham, Nottinghamshire with 2,983 households², where the most expensive property was sold for £645,000.00.
Properties for sale in Kirkby In Ashfield Central
Roads and Postcodes in Kirkby In Ashfield Central
Navigate through our locations to find the location of your next house in Kirkby In Ashfield Central, Nottingham for sale or to rent.
| Streets | Postcodes |
|---|---|
| Alfred Street | NG17 7DL |
| Amarella Lane | NG17 8SB |
| Ascot Close | NG17 7FG |
| Austen Grove | NG17 8RX |
| Balfour Street | NG17 7EA |
| Barn Court | NG17 8JN |
| Batemans Yard | NG17 8LG |
| Beech Avenue | NG17 8BP |
| Bellamy Drive | NG17 8SL |
| Bennet Drive | NG17 8AW |
| Betony Grove | NG17 8RN |
| Beulah Road | NG17 7EJ NG17 7EL |
| Beverley Drive | NG17 7FF |
| Bingley Crescent | NG17 8SH |
| Birch Tree Crescent | NG17 8BE |
| Boundary Close | NG17 8RS |
| Bourne Avenue | NG17 7FB NG17 7FD |
| Burrow Walk | NG17 8BU |
| Campion Gardens | NG17 8RQ |
| Carr Grove | NG17 8QL |
| Castle Hill Close | NG17 8QJ |
| Cedar Avenue | NG17 8BD |
| Central Avenue | NG17 7FQ NG17 7FS NG17 7FU |
| Chapel Street | NG17 8JY NG17 8JZ |
| Chestnut Avenue | NG17 8BA NG17 8BB |
| Chestnut Grove | NG17 8BL |
| Church Hill | NG17 8LJ NG17 8LN NG17 9LF |
| Church Mews | NG17 8PL |
| Church Street | NG17 8LA NG17 8LE |
| Cliff Lane | NG16 6HY |
| Cliff Lane Cottages | NG16 6HZ |
| Cobden Street | NG17 7DN |
| Corncrake Mews | NG17 8RP |
| Cowpasture Lane | NG17 8LZ |
| Crees Yard | NG17 8LF |
| Crocus Street | NG17 7DW NG17 7DY |
| Derby Road | NG17 7QQ NG17 9AT |
| Diamond Avenue | NG17 7GR NG17 7LQ NG17 7LR NG17 7LS NG17 7NA |
| Erewash Street | NG17 8AN |
| Fairhaven | NG17 7FW |
| Festus Street | NG17 7DP |
| Forest Street | NG17 7DT NG17 7DU |
| Foxbridge Close | NG17 8PB |
| Franderground Drive | NG17 8QE |
| George Street | NG17 8GT |
| Greenacres | NG17 7GE NG17 7GF |
| Greenholme Close | NG17 8AE |
| Grey Street | NG17 8GW |
| Halfmoon Drive | NG17 7FY |
| Hammond Grove | NG17 7EQ |
| Harebell Close | NG17 8RR |
| Hodgkinson Road | NG17 7DJ |
| Hornbeam Way | NG17 8RL |
| Hunters Court | NG17 8JH |
| Keepers Avenue | NG17 8RT |
| King Street | NG17 8AG |
| Kingsley Street | NG17 7BA |
| Kingsway | NG17 7BD NG17 7DR NG17 7EF NG17 7EH NG17 7EN NG17 7EP NG17 7FH NG17 7FJ NG17 7FN NG17 7GD |
| Kirkby Lane | NG16 6HW NG16 6JA |
| Kirkby Mill View | NG17 8QF |
| Laburnum Avenue | NG17 8LQ |
| Lilac Grove | NG17 8PT |
| Lime Street | NG17 8AJ |
| Lime Tree Avenue | NG17 8BJ |
| Lindleys Court | NG17 8BW |
| Lindleys Lane | NG17 8AA NG17 8AB NG17 8AD |
| Linnet Close | NG17 8RJ |
| Manor Crescent | NG17 7FZ NG17 7GA |
| Manor House Court | NG17 8LH |
| Marion Avenue | NG17 7GJ |
| Marshall Avenue | NG17 7EB |
| Mayfield Street | NG17 8LU NG17 8LW |
| Meadow Farm View | NG17 8QH |
| Meryton Grove | NG17 8SJ |
| Mill Lane | NG17 8LP |
| Nest Avenue | NG17 7LU |
| Nest Crescent | NG17 7LW |
| New Street | NG17 7DQ |
| North Street | NG17 9AN |
| Nottingham Road | NG17 9AA |
| Orchard Road | NG17 8JX |
| Orchard Walk | NG17 8LY |
| Oxford Street | NG17 7ED NG17 7EE |
| Park Lane | NG17 9LB |
| Pearl Avenue | NG17 7FE |
| Pennine Drive | NG17 8LL |
| Pennyroyal Way | NG17 8SE |
| Philip Avenue | NG17 7GH |
| Pinxton Lane | NG17 8LT |
| Pinxton Road | NG17 8LX |
| Primula Grove | NG17 8SD |
| Princess Street | NG17 8LS |
| Quarries Way | NG17 8BH |
| Quarry Drive | NG17 7FR |
| Queen Street | NG17 8AF |
| Queensway | NG17 7GG |
| Rectory Lane | NG17 8PZ |
| Regent Street | NG17 8AY |
| Robin Down Court | NG17 8RH |
| Ronchin Gardens | NG17 8RZ |
| Roseberry Street | NG17 7DZ |
| Sorrel Drive | NG17 8RW |
| Spring Close | NG17 8RU |
| Springmeadow | NG17 9LH |
| St Johns Avenue | NG17 7EG |
| St Thomas Avenue | NG17 7DX |
| St Wilfreds Park | NG17 8LB |
| St Wilfrids Drive | NG17 8NJ |
| Station Street | NG17 7AP NG17 7AR NG17 7AS |
| Sutton Road | NG17 8GR NG17 8GS NG17 8GU |
| Sylvan Avenue | NG17 8RG |
| The Acre | NG17 7FX |
| The Hill | NG17 8JS |
| The Paddock | NG17 8BT |
| The Ropeway | NG17 8QN |
| Urban Road | NG17 8AH NG17 8AP |
| Victoria Road | NG17 8AQ NG17 8AU NG17 8AX |
| Western Avenue | NG17 7FL NG17 7FT |
| Wheatley Avenue | NG17 8BG NG17 8BN |
| Wicket Close | NG17 8RY |
| Wilson Avenue | NG17 8AZ |
| Woodlot Cottages | NG17 8QG |
| NG15 0AD |
Transport near Kirkby In Ashfield Central
- FAQ
- Price Paid By Year
- Property Type Price
Frequently asked questions about Kirkby In Ashfield Central
What is the average price for a property for sale in Kirkby In Ashfield Central?
The average price for a property for sale in Kirkby In Ashfield Central is £188,764. This amount is 33% lower than the average price in Nottingham. There are 2,303 property listings for sale in Kirkby In Ashfield Central.
What streets have the most expensive properties for sale in Kirkby In Ashfield Central?
The streets with the most expensive properties for sale in Kirkby In Ashfield Central are Cedar Avenue at an average of £367,500, Batemans Yard at an average of £360,000 and Church Street at an average of £352,700.
What streets have the most affordable properties for sale in Kirkby In Ashfield Central?
The streets with the most affordable properties for sale in Kirkby In Ashfield Central are Station Street at an average of £66,666, Kingsley Street at an average of £83,687 and The Hill at an average of £95,333.
Which train stations are available in or near Kirkby In Ashfield Central?
Some of the train stations available in or near Kirkby In Ashfield Central are Kirkby in Ashfield, Sutton Parkway and Newstead.
Property Price Paid in Kirkby In Ashfield Central by Year
The average sold property price by year was:
| Year | Average Sold Price | Price Change |
Sold Properties
|
|---|---|---|---|
| 2025 | £201,027 | 5% |
83 Properties |
| 2024 | £190,454 | 8% |
149 Properties |
| 2023 | £175,940 | -12% |
99 Properties |
| 2022 | £196,282 | 13% |
143 Properties |
| 2021 | £169,836 | 13% |
146 Properties |
| 2020 | £148,285 | 1% |
139 Properties |
| 2019 | £147,367 | -2% |
137 Properties |
| 2018 | £149,592 | 2% |
123 Properties |
| 2017 | £145,986 | 2% |
172 Properties |
| 2016 | £143,495 | 9% |
179 Properties |
| 2015 | £131,271 | 4% |
159 Properties |
| 2014 | £125,942 | 5% |
153 Properties |
| 2013 | £119,168 | 2% |
127 Properties |
| 2012 | £117,165 | -15% |
111 Properties |
| 2011 | £134,729 | -4% |
90 Properties |
| 2010 | £139,874 | 12% |
134 Properties |
| 2009 | £123,017 | -8% |
106 Properties |
| 2008 | £132,592 | -3% |
117 Properties |
| 2007 | £136,229 | 16% |
189 Properties |
| 2006 | £114,171 | 16% |
145 Properties |
| 2005 | £95,567 | -1% |
126 Properties |
| 2004 | £96,781 | 21% |
156 Properties |
| 2003 | £76,839 | 20% |
174 Properties |
| 2002 | £61,196 | 13% |
177 Properties |
| 2001 | £53,195 | -6% |
154 Properties |
| 2000 | £56,511 | -6% |
133 Properties |
| 1999 | £60,066 | 15% |
152 Properties |
| 1998 | £50,945 | 11% |
142 Properties |
| 1997 | £45,167 | 20% |
130 Properties |
| 1996 | £35,987 | -4% |
98 Properties |
| 1995 | £37,425 | - |
82 Properties |
Property Price per Property Type in Kirkby In Ashfield Central
Here you can find historic sold price data in order to help with your property search.
The average Property Paid Price for specific property types in the last three years are:
| Property Type | Average Sold Price | Sold Properties |
|---|---|---|
| Flat | £102,611.00 | 9 Flats |
| Semi Detached House | £172,291.00 | 113 Semi Detached Houses |
| Detached House | £263,149.00 | 100 Detached Houses |
| Terraced House | £144,712.00 | 109 Terraced Houses |

