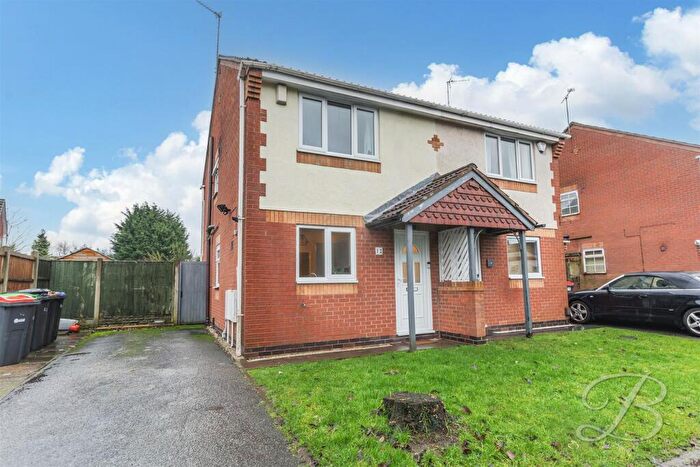
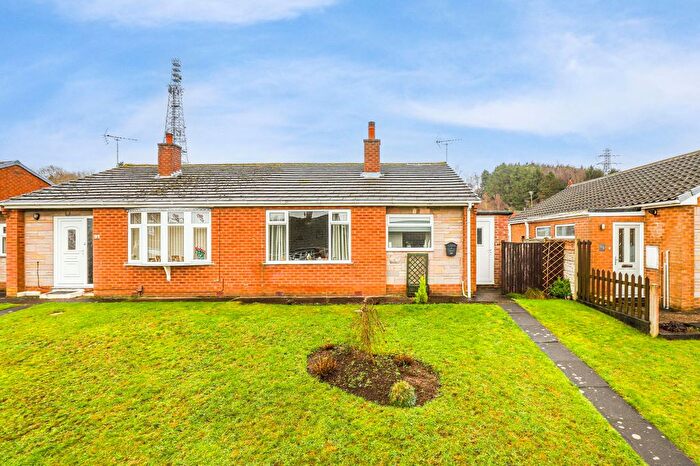
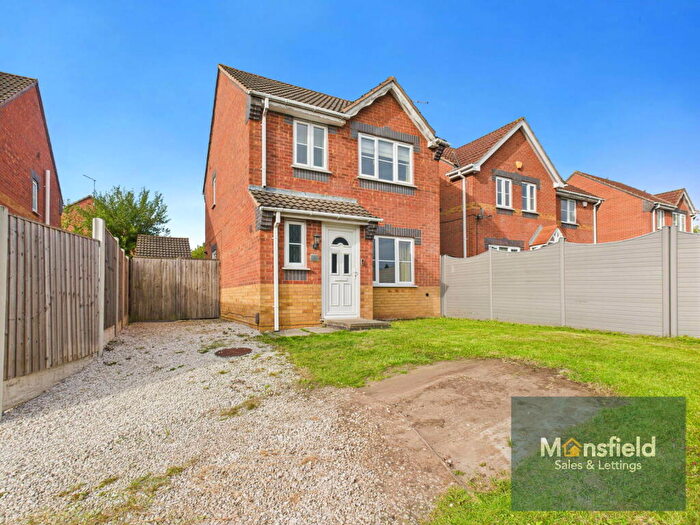
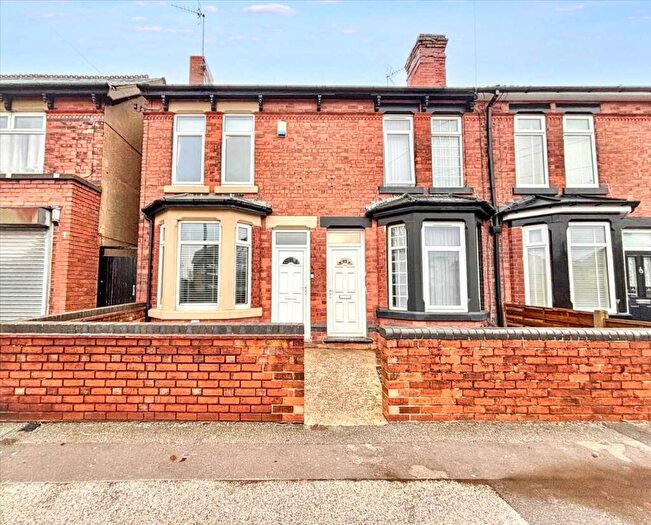
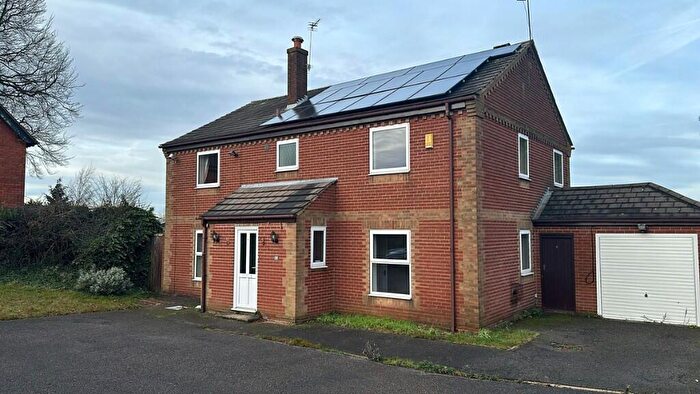
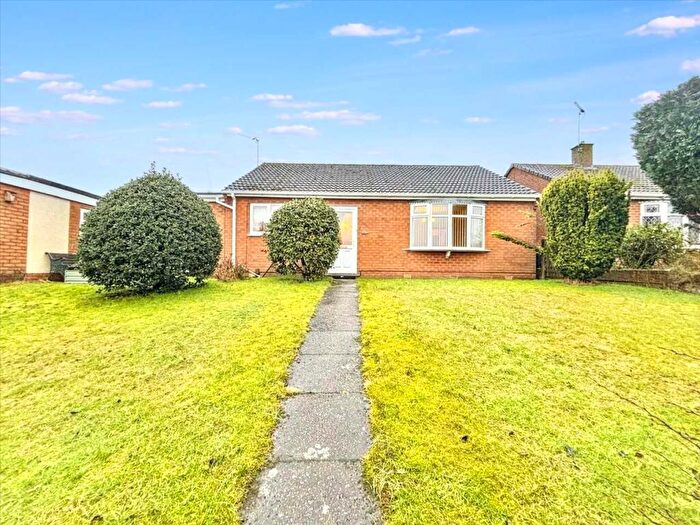
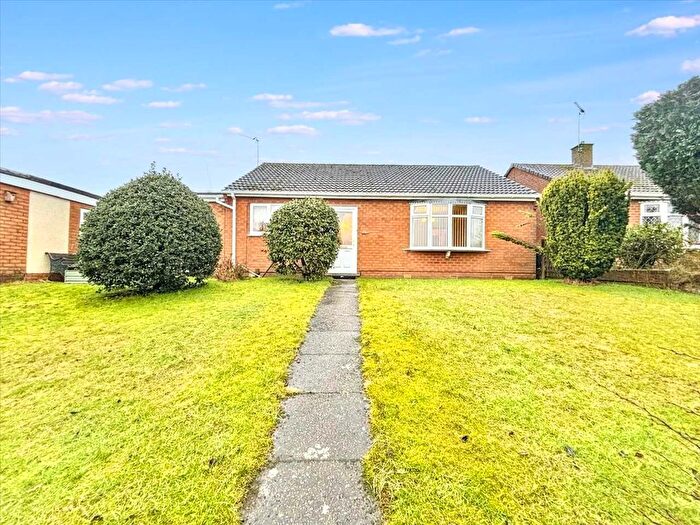
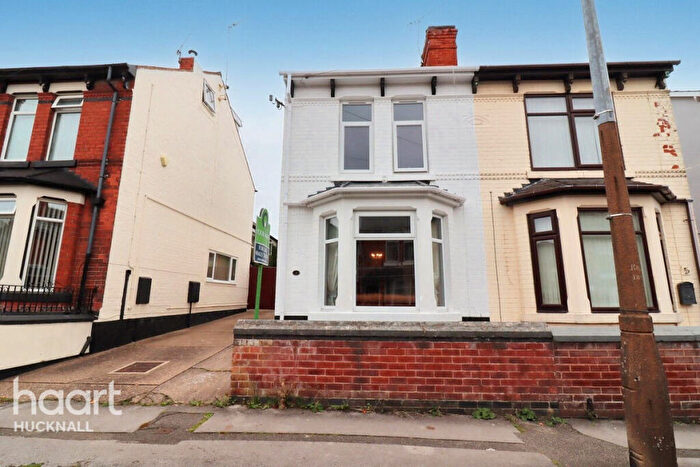
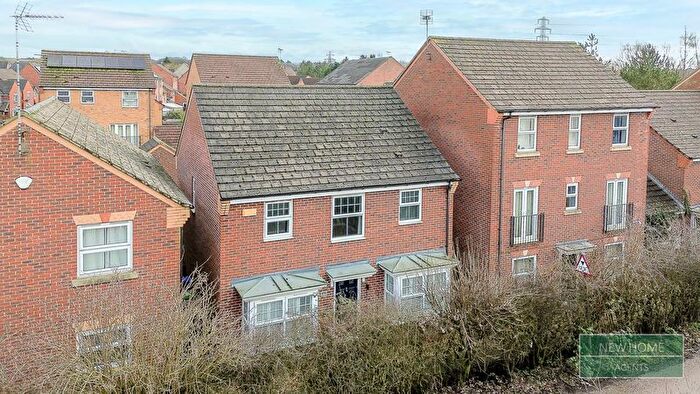
Houses for sale & to rent in Kirkby In Ashfield East, Nottingham
House Prices in Kirkby In Ashfield East
Properties in Kirkby In Ashfield East have an average house price of £173,313.00 and had 196 Property Transactions within the last 3 years¹.
Kirkby In Ashfield East is an area in Nottingham, Nottinghamshire with 2,640 households², where the most expensive property was sold for £645,000.00.
Properties for sale in Kirkby In Ashfield East
Roads and Postcodes in Kirkby In Ashfield East
Navigate through our locations to find the location of your next house in Kirkby In Ashfield East, Nottingham for sale or to rent.
| Streets | Postcodes |
|---|---|
| Abbey Road | NG17 7NH NG17 7NR NG17 7NS NG17 7NT NG17 7NW NG17 7NX NG17 7PA NG17 7PB |
| Acorn View | NG17 7RE |
| Alexandra Street | NG17 7JH NG17 7JJ NG17 7JL |
| Ashwood Avenue | NG17 7QA |
| Beacon Drive | NG17 7NJ NG17 7NL NG17 7PX |
| Blidworth Road | NG17 7ND |
| Blossom Court | NG17 7BL |
| Carburton Way | NG17 7PS |
| Carisbrooke Close | NG17 7RH |
| Chartwell Road | NG17 7HB NG17 7HZ |
| Clumber Street | NG17 7NE NG17 7NF NG17 7NG |
| Coniston Road | NG17 7PH |
| Darley Avenue | NG17 7HG |
| David Street | NG17 7JW NG17 7JX |
| Derby Road | NG17 7NB NG17 7QN NG17 7RF |
| Diamond Avenue | NG17 7GN NG17 7GQ NG17 7LP NG17 7LX NG17 7LZ |
| Edward Street | NG17 7JP NG17 7JQ |
| Emerald Grove | NG17 7QJ |
| Farm View Road | NG17 7HF |
| Fountains Close | NG17 7HX |
| Gladstone Street | NG17 7HS NG17 7HT |
| Glenside | NG17 7GZ NG17 7HA NG17 7HD NG17 7HE |
| Grange Court | NG17 7PT |
| Hazel Grove | NG17 7GW |
| Hillview Road | NG17 7NN |
| Hosiery Street | NG17 7AJ |
| Kingswood Drive | NG17 8PY |
| Lindrick Road | NG17 8PQ |
| Lodge Lane | NG17 7QL |
| Lowmoor Road | NG17 5LG NG17 5LX NG17 7BH NG17 7BJ NG17 7BP NG17 7JA NG17 7JE NG17 7JF NG17 7JU |
| Marlborough Road | NG17 7HN NG17 7HP NG17 7HQ NG17 7HR |
| Mary Street | NG17 7JS NG17 7JT |
| Millers Way | NG17 8RF |
| Milton Street | NG17 7JB NG17 7JD |
| Morven Road | NG17 7BX |
| Newstead Close | NG17 7HU |
| Oak Street | NG17 7HJ |
| Pierpoint Place | NG17 8QZ |
| Pinewood Close | NG17 7QE |
| Pond Street | NG17 7AH |
| Poplar Avenue | NG17 7GX NG17 7HH |
| Portland Street | NG17 7AB NG17 7AG |
| Priory Grove | NG17 7QS |
| Richmond Road | NG17 7PR NG17 7PW |
| Roewood Close | NG17 8PX |
| Rosewood Drive | NG17 7PY |
| Ruby Gardens | NG17 7QH |
| Rutland | NG17 7PQ |
| Sandalwood Drive | NG17 7QD |
| Sapphire Drive | NG17 7QG |
| School Street | NG17 7BT |
| Sherwood Street | NG17 7BW |
| Springfield Way | NG17 7PJ NG17 7PL NG17 7PN |
| Spruce Grove | NG17 7QB |
| St Andrews Street | NG17 7HL |
| Station Street | NG17 7AQ |
| Stonemasons Mews | NG17 7AT |
| The Promenade | NG17 7PP |
| Thoresby Avenue | NG17 7LY |
| Tintern Close | NG17 7RJ |
| Unity Road | NG17 7LE |
| Walesby Drive | NG17 7PD NG17 7PF |
| Warwick Close | NG17 7PE |
| Waverley Close | NG17 7PU |
| Welbeck Street | NG17 7GT NG17 7GU |
| Westminster Avenue | NG17 7HY |
| Woburn Avenue | NG17 7HW |
| Wollaton Road | NG17 7NP NG17 7NQ |
| Woodland Walk | NG17 7PG |
| York Grove | NG17 7LB |
Transport near Kirkby In Ashfield East
- FAQ
- Price Paid By Year
- Property Type Price
Frequently asked questions about Kirkby In Ashfield East
What is the average price for a property for sale in Kirkby In Ashfield East?
The average price for a property for sale in Kirkby In Ashfield East is £173,313. This amount is 39% lower than the average price in Nottingham. There are 550 property listings for sale in Kirkby In Ashfield East.
What streets have the most expensive properties for sale in Kirkby In Ashfield East?
The streets with the most expensive properties for sale in Kirkby In Ashfield East are Derby Road at an average of £645,000, Lodge Lane at an average of £525,000 and Emerald Grove at an average of £410,000.
What streets have the most affordable properties for sale in Kirkby In Ashfield East?
The streets with the most affordable properties for sale in Kirkby In Ashfield East are Ashwood Avenue at an average of £94,625, Portland Street at an average of £101,035 and Springfield Way at an average of £103,750.
Which train stations are available in or near Kirkby In Ashfield East?
Some of the train stations available in or near Kirkby In Ashfield East are Kirkby in Ashfield, Sutton Parkway and Newstead.
Property Price Paid in Kirkby In Ashfield East by Year
The average sold property price by year was:
| Year | Average Sold Price | Price Change |
Sold Properties
|
|---|---|---|---|
| 2025 | £193,127 | 11% |
59 Properties |
| 2024 | £172,669 | 10% |
75 Properties |
| 2023 | £155,237 | -6% |
62 Properties |
| 2022 | £164,489 | 3% |
87 Properties |
| 2021 | £159,249 | 23% |
105 Properties |
| 2020 | £122,073 | - |
73 Properties |
| 2019 | £122,061 | -7% |
96 Properties |
| 2018 | £131,012 | 8% |
90 Properties |
| 2017 | £120,348 | 9% |
95 Properties |
| 2016 | £109,315 | 4% |
85 Properties |
| 2015 | £104,602 | -12% |
83 Properties |
| 2014 | £116,765 | 7% |
84 Properties |
| 2013 | £108,167 | 2% |
81 Properties |
| 2012 | £106,227 | 16% |
59 Properties |
| 2011 | £89,175 | -5% |
67 Properties |
| 2010 | £93,965 | 13% |
59 Properties |
| 2009 | £81,499 | -12% |
43 Properties |
| 2008 | £91,206 | -12% |
70 Properties |
| 2007 | £102,013 | 0,1% |
155 Properties |
| 2006 | £101,893 | 5% |
145 Properties |
| 2005 | £96,390 | 7% |
132 Properties |
| 2004 | £89,521 | 19% |
132 Properties |
| 2003 | £72,150 | 20% |
194 Properties |
| 2002 | £57,656 | 16% |
171 Properties |
| 2001 | £48,505 | 3% |
137 Properties |
| 2000 | £47,160 | 4% |
98 Properties |
| 1999 | £45,341 | 22% |
91 Properties |
| 1998 | £35,181 | -19% |
72 Properties |
| 1997 | £41,725 | 14% |
77 Properties |
| 1996 | £35,932 | -27% |
71 Properties |
| 1995 | £45,719 | - |
90 Properties |
Property Price per Property Type in Kirkby In Ashfield East
Here you can find historic sold price data in order to help with your property search.
The average Property Paid Price for specific property types in the last three years are:
| Property Type | Average Sold Price | Sold Properties |
|---|---|---|
| Semi Detached House | £158,432.00 | 122 Semi Detached Houses |
| Detached House | £279,363.00 | 37 Detached Houses |
| Terraced House | £121,361.00 | 31 Terraced Houses |
| Flat | £90,333.00 | 6 Flats |

