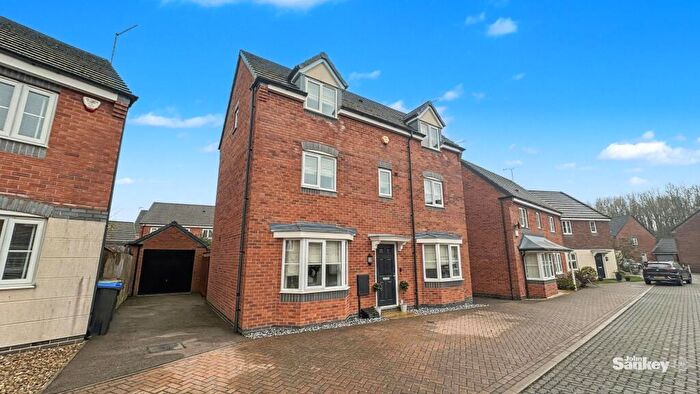
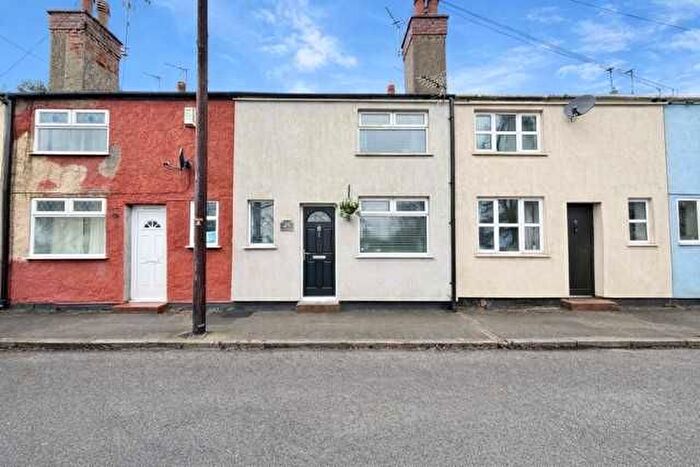
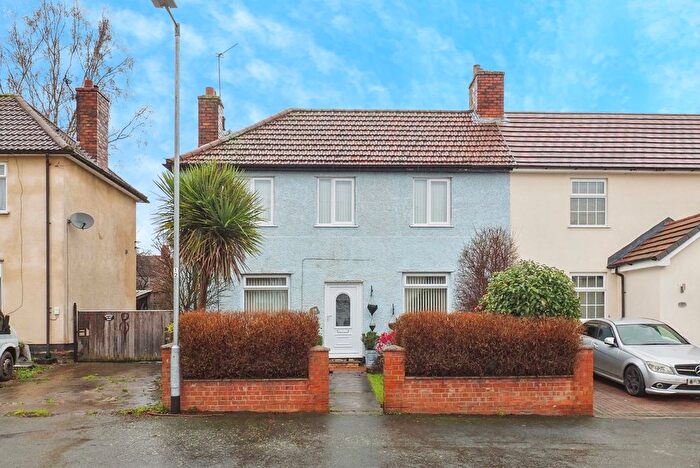
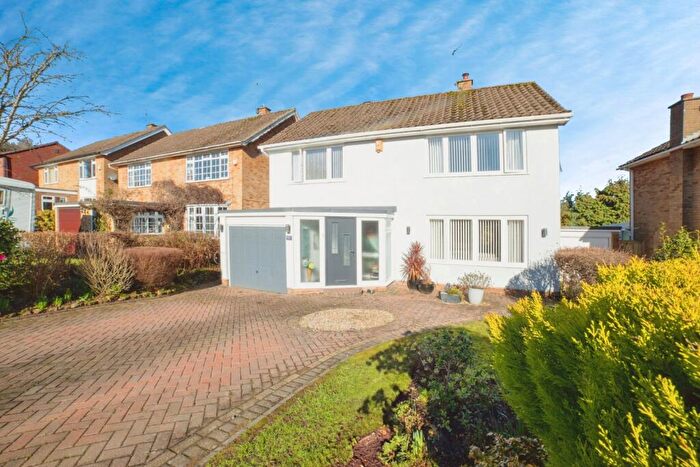
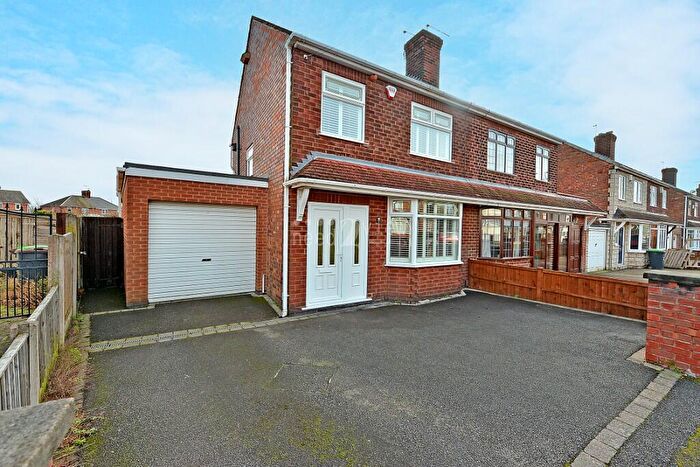
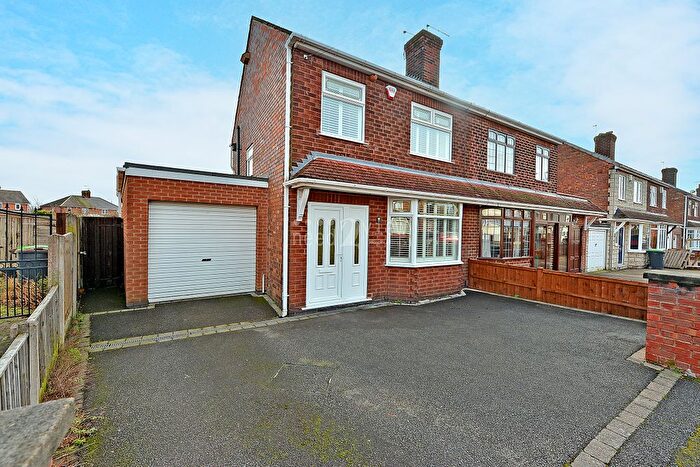
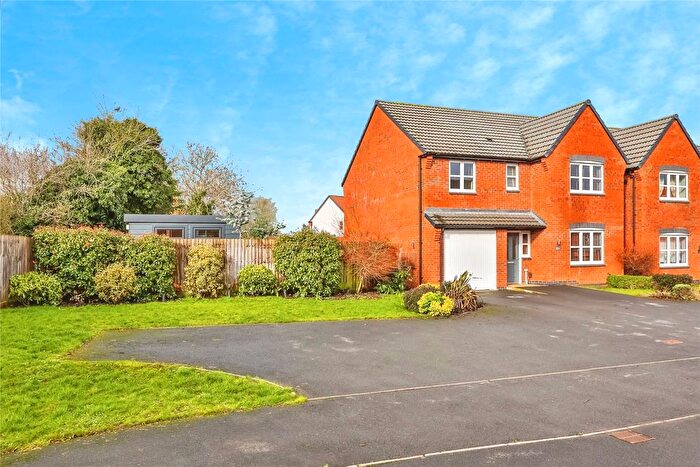
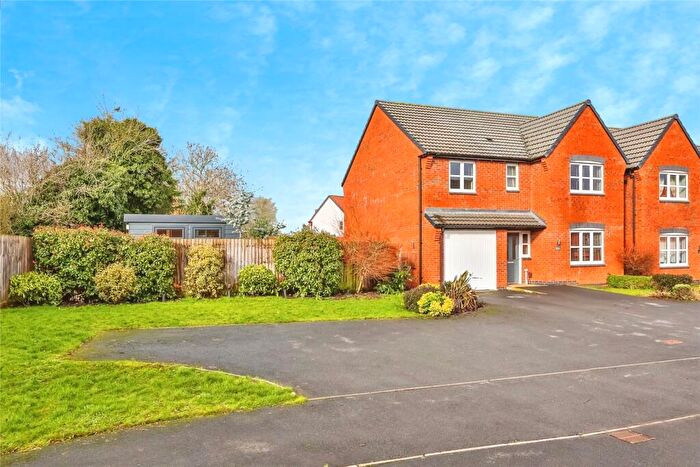
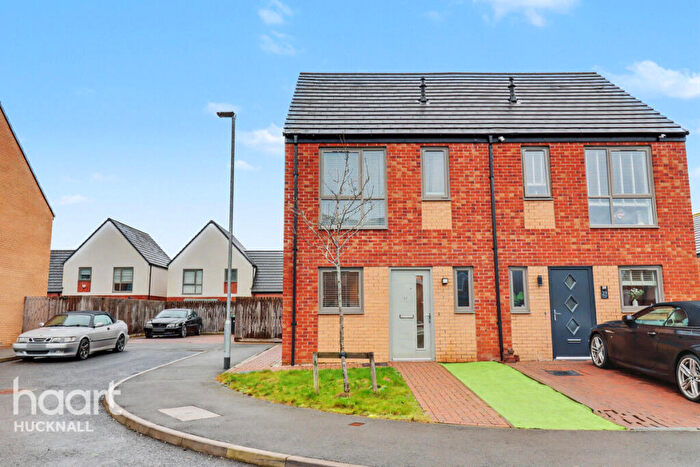
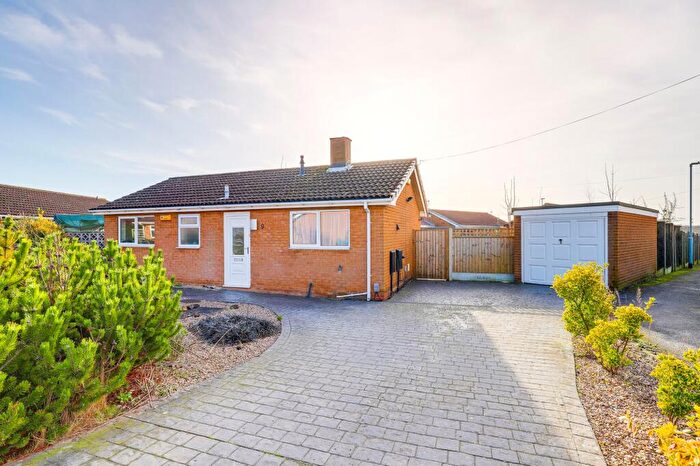
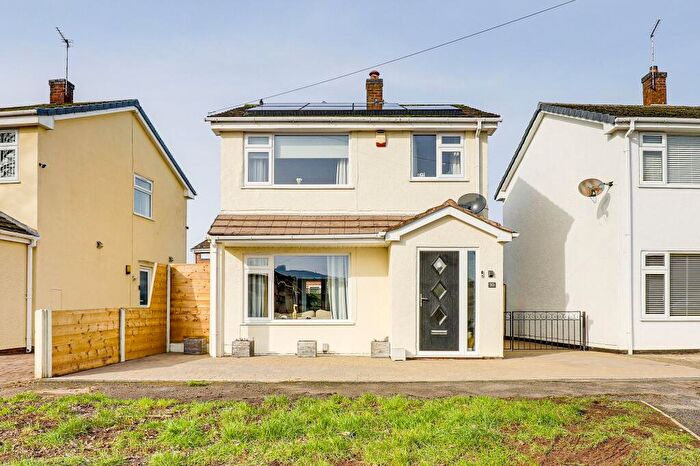
Houses for sale & to rent in Newstead, Nottingham
House Prices in Newstead
Properties in Newstead have an average house price of £321,520.00 and had 80 Property Transactions within the last 3 years¹.
Newstead is an area in Nottingham, Nottinghamshire with 907 households², where the most expensive property was sold for £3,900,000.00.
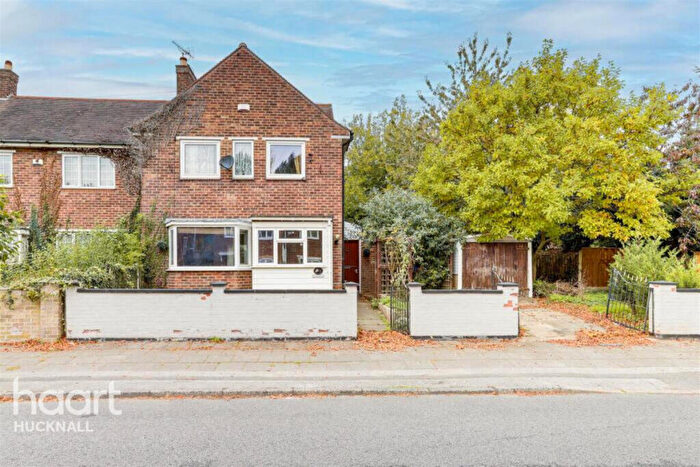
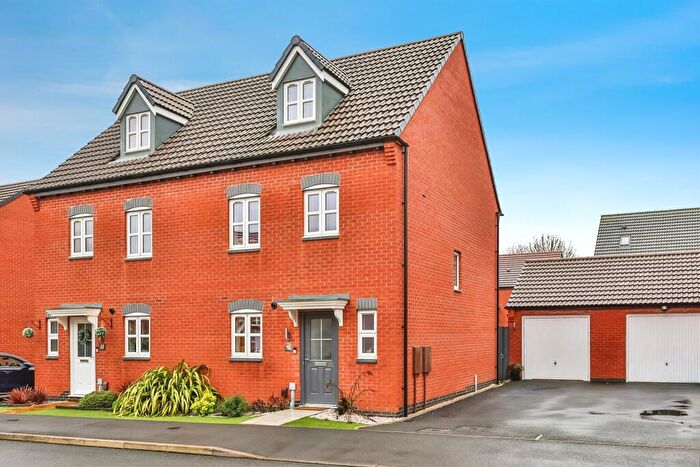
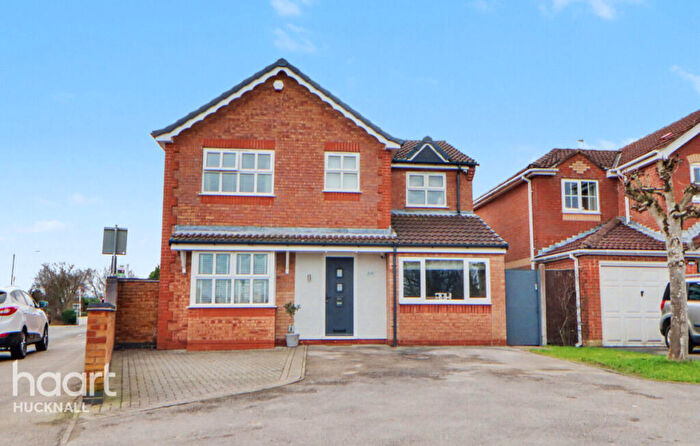
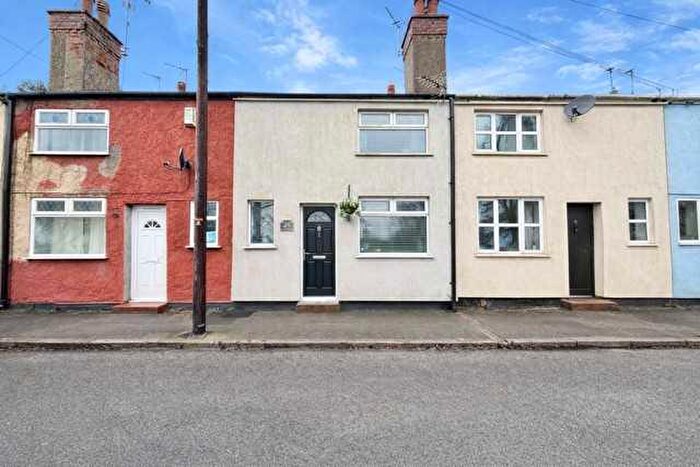
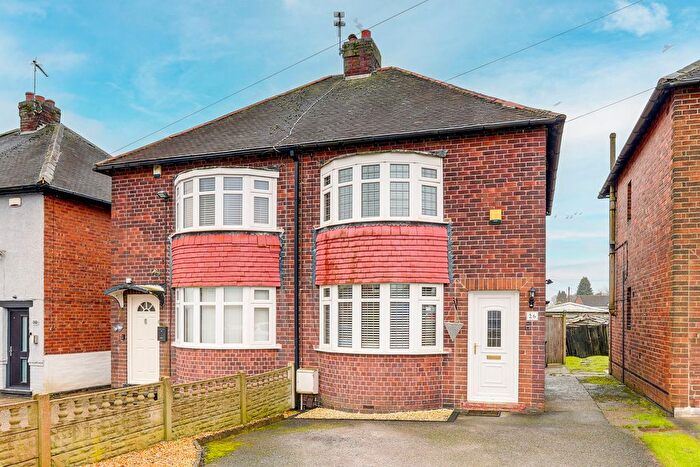
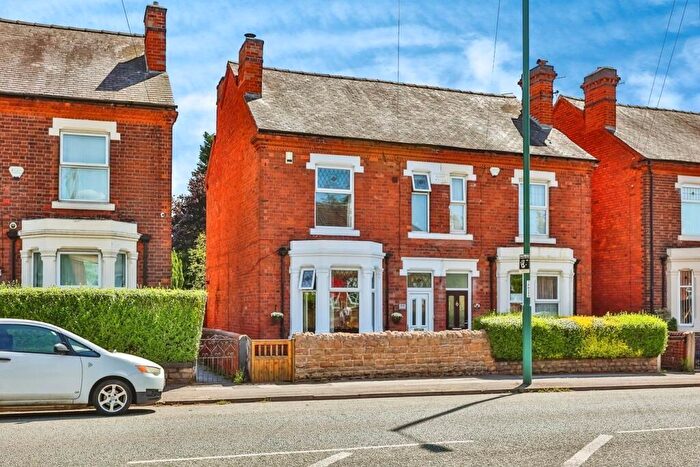
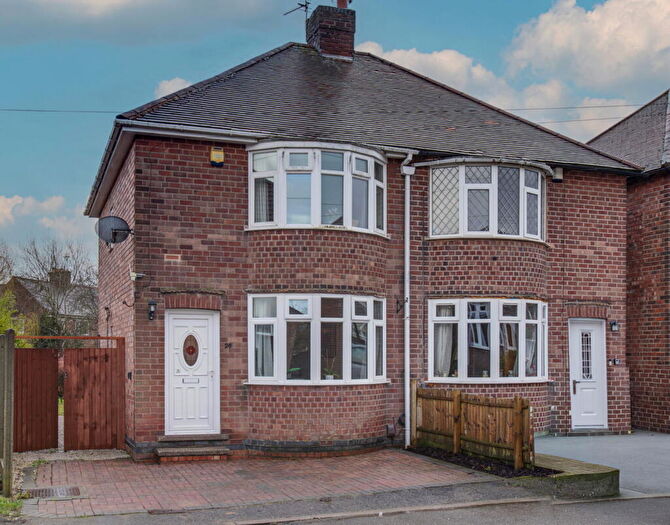
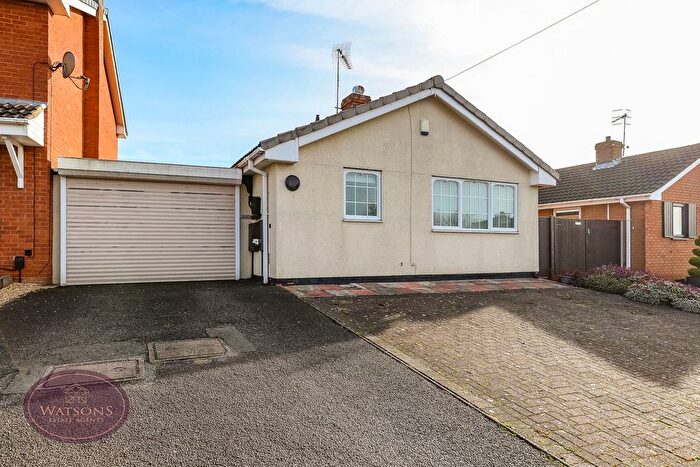
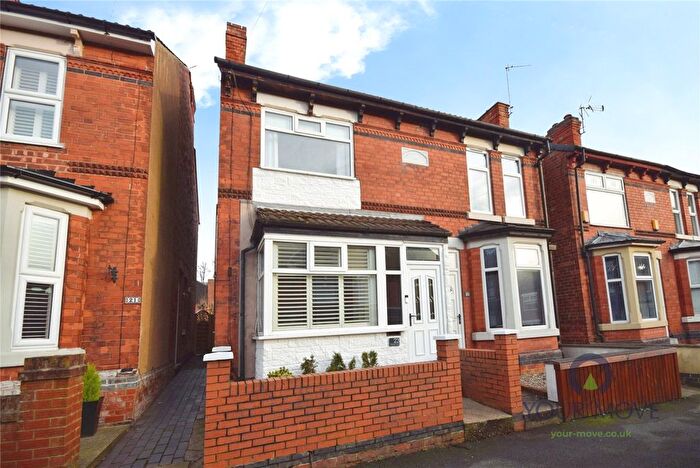
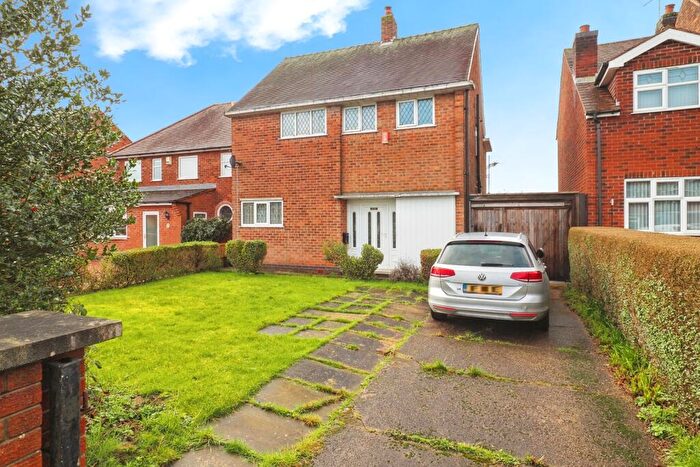
Properties for sale in Newstead
Roads and Postcodes in Newstead
Navigate through our locations to find the location of your next house in Newstead, Nottingham for sale or to rent.
| Streets | Postcodes |
|---|---|
| Abbey Road | NG15 0BL |
| Blacksmiths Court | NG15 8FZ |
| Burntstump Hill | NG5 8PQ |
| Byron Street | NG15 0BG |
| Chapel Terrace | NG15 0BW |
| Chatsworth Terrace | NG15 0DD |
| Church Lane | NG15 8AB |
| Copse Close | NG15 9HU |
| Fairfields Drive | NG15 9HR |
| Forest Lane | NG15 8FF NG15 8FG |
| Foundry Terrace | NG15 0BT |
| Fraser Street | NG15 0BN |
| Garden Terrace | NG15 0BX |
| Hall Mews | NG15 8FW |
| Hazelford Way | NG15 0DQ |
| High Leys Drive | NG15 9HQ |
| Hucknall Road | NG15 0BB NG15 0BD |
| Linby Lane | NG15 8AF NG15 8FB |
| Livingstone Street | NG15 0BJ |
| Main Street | NG15 8AE NG15 8FD NG15 8FE |
| Mansfield Road | NG15 8FH NG15 8FJ NG15 8FL NG5 8PN |
| Markham Street | NG15 0BQ |
| Moor Road | NG15 8EN NG15 8EP NG15 8FR |
| Musters Road | NG15 0BE |
| Newstead Abbey Park | NG15 8GE |
| Papplewick Lane | NG15 8EL |
| Quarry Lane | NG15 8GA |
| Stonehouse Terrace | NG15 0DB |
| The Quadrangle | NG15 0BP |
| Tilford Road | NG15 0BU NG15 0BY |
| Webb Street | NG15 0BH |
| Wighay Road | NG15 8AH |
Transport near Newstead
- FAQ
- Price Paid By Year
- Property Type Price
Frequently asked questions about Newstead
What is the average price for a property for sale in Newstead?
The average price for a property for sale in Newstead is £321,520. This amount is 14% higher than the average price in Nottingham. There are 5,399 property listings for sale in Newstead.
What streets have the most expensive properties for sale in Newstead?
The streets with the most expensive properties for sale in Newstead are Newstead Abbey Park at an average of £1,541,333, High Leys Drive at an average of £610,000 and Forest Lane at an average of £406,130.
What streets have the most affordable properties for sale in Newstead?
The streets with the most affordable properties for sale in Newstead are Stonehouse Terrace at an average of £95,000, Tilford Road at an average of £95,666 and Chatsworth Terrace at an average of £99,333.
Which train stations are available in or near Newstead?
Some of the train stations available in or near Newstead are Newstead, Hucknall and Kirkby in Ashfield.
Property Price Paid in Newstead by Year
The average sold property price by year was:
| Year | Average Sold Price | Price Change |
Sold Properties
|
|---|---|---|---|
| 2025 | £219,071 | -114% |
21 Properties |
| 2024 | £469,275 | 47% |
29 Properties |
| 2023 | £250,405 | -18% |
30 Properties |
| 2022 | £294,348 | -9% |
28 Properties |
| 2021 | £320,990 | 15% |
25 Properties |
| 2020 | £272,716 | 22% |
30 Properties |
| 2019 | £211,842 | -10% |
38 Properties |
| 2018 | £232,040 | -4% |
30 Properties |
| 2017 | £242,183 | -7% |
38 Properties |
| 2016 | £258,571 | 29% |
35 Properties |
| 2015 | £183,941 | -5% |
37 Properties |
| 2014 | £193,873 | 1% |
32 Properties |
| 2013 | £192,113 | -16% |
22 Properties |
| 2012 | £223,683 | -1% |
27 Properties |
| 2011 | £225,747 | -6% |
24 Properties |
| 2010 | £239,678 | 29% |
25 Properties |
| 2009 | £171,105 | 9% |
26 Properties |
| 2008 | £156,201 | -7% |
30 Properties |
| 2007 | £166,727 | -8% |
34 Properties |
| 2006 | £180,021 | 22% |
59 Properties |
| 2005 | £140,415 | 3% |
41 Properties |
| 2004 | £135,559 | 23% |
46 Properties |
| 2003 | £104,996 | -4% |
48 Properties |
| 2002 | £109,308 | 17% |
49 Properties |
| 2001 | £90,709 | -69% |
61 Properties |
| 2000 | £153,523 | 23% |
40 Properties |
| 1999 | £117,640 | -1% |
37 Properties |
| 1998 | £118,308 | 20% |
52 Properties |
| 1997 | £94,919 | 33% |
76 Properties |
| 1996 | £63,623 | 0,2% |
36 Properties |
| 1995 | £63,521 | - |
33 Properties |
Property Price per Property Type in Newstead
Here you can find historic sold price data in order to help with your property search.
The average Property Paid Price for specific property types in the last three years are:
| Property Type | Average Sold Price | Sold Properties |
|---|---|---|
| Semi Detached House | £226,311.00 | 31 Semi Detached Houses |
| Detached House | £978,607.00 | 14 Detached Houses |
| Terraced House | £137,742.00 | 33 Terraced Houses |
| Flat | £230,000.00 | 2 Flats |

