Houses for sale & to rent in Oak, Nottingham
House Prices in Oak
Properties in Oak have an average house price of £474,960.00 and had 84 Property Transactions within the last 3 years¹.
Oak is an area in Nottingham, Nottinghamshire with 884 households², where the most expensive property was sold for £2,650,000.00.
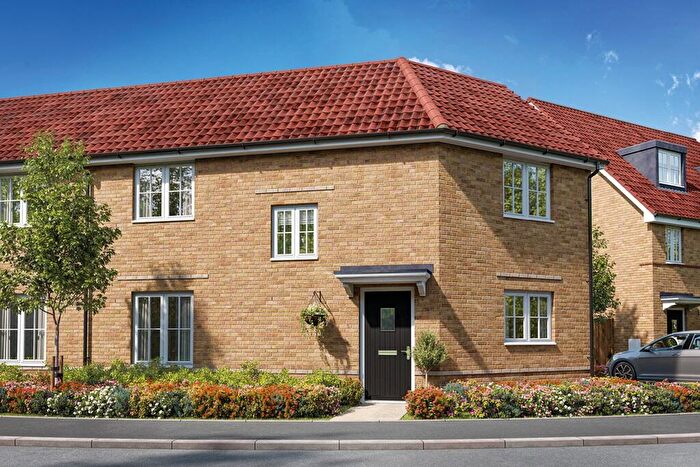
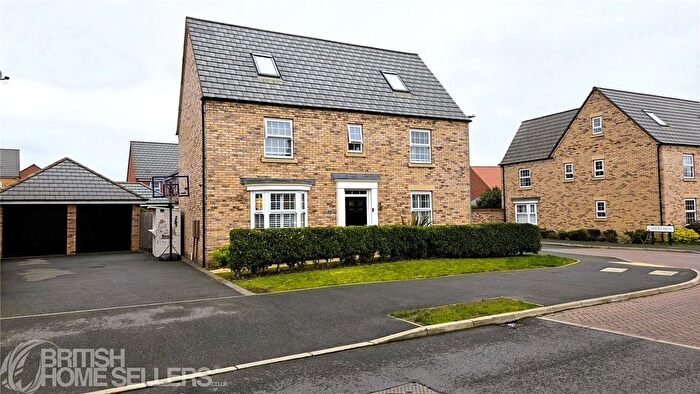
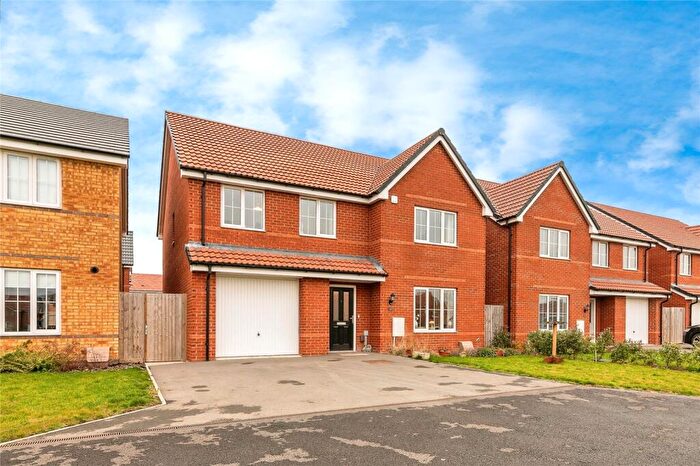
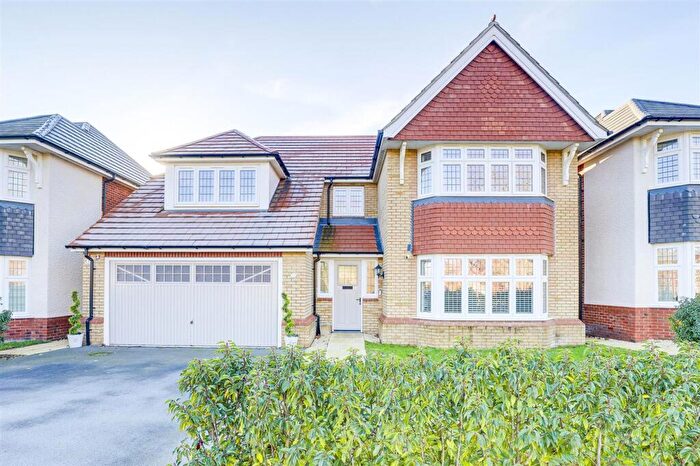
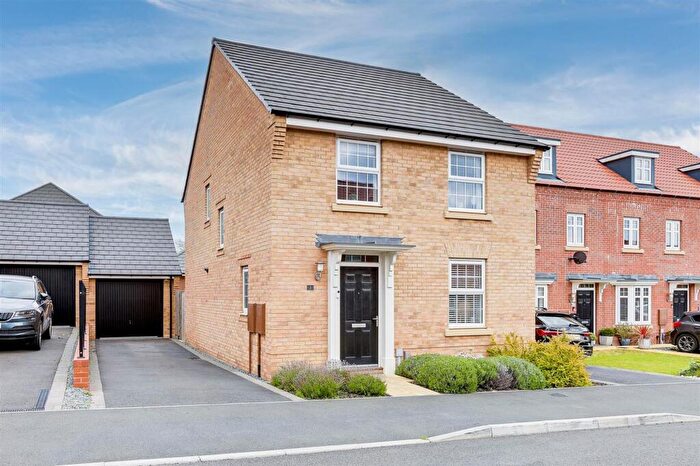
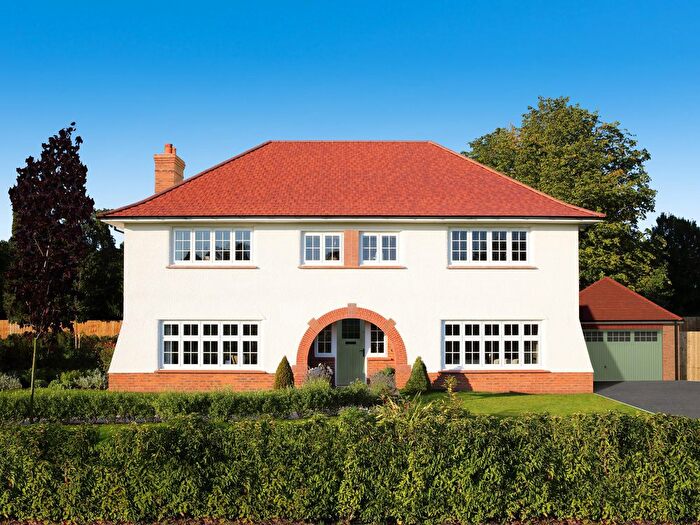
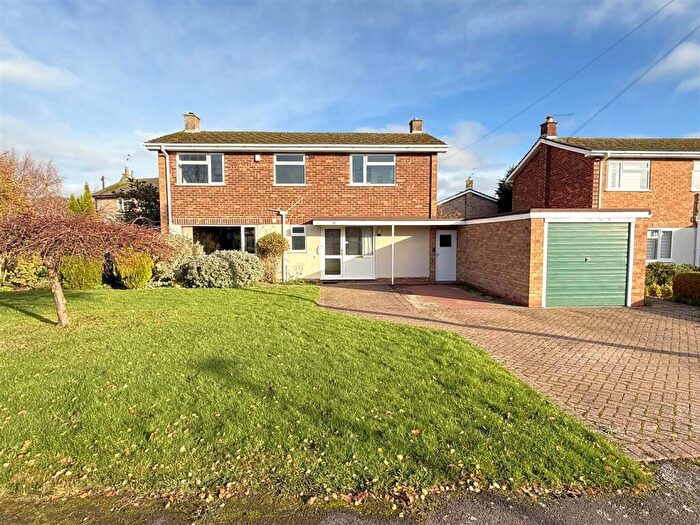
Properties for sale in Oak
Roads and Postcodes in Oak
Navigate through our locations to find the location of your next house in Oak, Nottingham for sale or to rent.
| Streets | Postcodes |
|---|---|
| Brickyard Lane | NG13 8NJ |
| Bridle Ways | NG13 8PT |
| Brooks Close | NG13 8LZ |
| Browns Lane | NG13 8PL |
| Brunts Lane | NG13 8NQ |
| Burneham Close | NG13 8NT |
| Butt Lane | NG13 8NY |
| Car Colston Road | NG13 8JL |
| Cherry Holt Close | NG13 8PP |
| Cherry Holt Lane | NG13 8LJ NG13 8PN |
| Church Lane | NG13 8HZ |
| Closes Side Lane | NG13 8NA |
| College Street | NG13 8LE NG13 8LF |
| Croft Rise | NG13 8PS |
| Cross Lane | NG13 8NE |
| Crossways Drive | NG13 8ND |
| Cuttle Hill Gardens | NG13 8PW |
| Dovecote Close | NG13 8PR |
| Farm Close | NG13 8LN |
| Flintham Lane | NG13 8QY |
| Fosse Road | NG13 8JJ |
| Fosters Close | NG13 8NZ |
| Hackers Close | NG13 8PU |
| Hawksworth Road | NG13 8JP |
| Haycroft Way | NG13 8PB |
| Holloway Close | NG13 8NG |
| Kirk Hill | NG13 8PE |
| Kneeton Road | NG13 8LP NG13 8PG NG13 8PH NG13 8PJ |
| Knights Close | NG13 8JT |
| Lammas Gardens | NG13 8LQ |
| Lammas Lane | NG13 8LL |
| Lodge Lane | NG13 8JN |
| Ludgate Drive | NG13 8NW |
| Magdalen Drive | NG13 8NB |
| Main Street | NG13 8NH NG13 8PA |
| Malthouse Court | NG13 8PY |
| Mill Gate | NG13 8PD |
| Mill Heyes | NG13 8NU |
| Moss Close | NG13 8LG |
| Orchard Close | NG13 8LH |
| Screveton Road | NG13 8JG |
| Stable Close | NG13 8LY |
| Straws Croft | NG13 8PQ |
| Straws Lane | NG13 8NF |
| The Lyngs | NG13 8NL |
| Trent Lane | NG13 8PF |
| Vicarage Lane | NG13 8JR |
| Walnut Grove | NG13 8NS |
| Walnut Tree Lane | NG13 8NN |
| Wilmot Close | NG13 8JF |
| NG13 8JE |
Transport near Oak
-
Bingham Station
-
Lowdham Station
-
Thurgarton Station
-
Aslockton Station
-
Burton Joyce Station
-
Radcliffe (Nottinghamshire) Station
-
Bleasby Station
-
Elton and Orston Station
- FAQ
- Price Paid By Year
- Property Type Price
Frequently asked questions about Oak
What is the average price for a property for sale in Oak?
The average price for a property for sale in Oak is £474,960. This amount is 68% higher than the average price in Nottingham. There are 1,016 property listings for sale in Oak.
What streets have the most expensive properties for sale in Oak?
The streets with the most expensive properties for sale in Oak are Kirk Hill at an average of £1,700,000, Cherry Holt Lane at an average of £868,333 and Browns Lane at an average of £677,500.
What streets have the most affordable properties for sale in Oak?
The streets with the most affordable properties for sale in Oak are Holloway Close at an average of £162,500, Cross Lane at an average of £185,250 and The Lyngs at an average of £239,500.
Which train stations are available in or near Oak?
Some of the train stations available in or near Oak are Bingham, Lowdham and Thurgarton.
Property Price Paid in Oak by Year
The average sold property price by year was:
| Year | Average Sold Price | Price Change |
Sold Properties
|
|---|---|---|---|
| 2025 | £363,619 | -44% |
21 Properties |
| 2024 | £522,562 | 5% |
35 Properties |
| 2023 | £498,964 | 11% |
28 Properties |
| 2022 | £445,914 | -6% |
34 Properties |
| 2021 | £472,184 | 9% |
38 Properties |
| 2020 | £431,352 | -3% |
38 Properties |
| 2019 | £442,301 | 17% |
29 Properties |
| 2018 | £367,879 | 4% |
31 Properties |
| 2017 | £353,977 | -2% |
34 Properties |
| 2016 | £359,315 | 21% |
29 Properties |
| 2015 | £282,824 | -6% |
33 Properties |
| 2014 | £299,061 | -8% |
35 Properties |
| 2013 | £322,922 | 3% |
33 Properties |
| 2012 | £313,583 | 17% |
28 Properties |
| 2011 | £260,635 | -10% |
23 Properties |
| 2010 | £286,655 | -6% |
35 Properties |
| 2009 | £302,750 | 28% |
30 Properties |
| 2008 | £217,336 | -40% |
19 Properties |
| 2007 | £304,763 | 9% |
42 Properties |
| 2006 | £276,591 | 11% |
31 Properties |
| 2005 | £246,897 | -1% |
34 Properties |
| 2004 | £250,099 | 3% |
41 Properties |
| 2003 | £242,108 | 8% |
39 Properties |
| 2002 | £223,484 | 23% |
42 Properties |
| 2001 | £172,977 | 26% |
39 Properties |
| 2000 | £128,378 | -5% |
35 Properties |
| 1999 | £135,234 | 11% |
42 Properties |
| 1998 | £120,651 | 2% |
55 Properties |
| 1997 | £118,185 | 16% |
39 Properties |
| 1996 | £99,148 | -7% |
29 Properties |
| 1995 | £106,085 | - |
31 Properties |
Property Price per Property Type in Oak
Here you can find historic sold price data in order to help with your property search.
The average Property Paid Price for specific property types in the last three years are:
| Property Type | Average Sold Price | Sold Properties |
|---|---|---|
| Semi Detached House | £440,225.00 | 12 Semi Detached Houses |
| Detached House | £583,354.00 | 48 Detached Houses |
| Terraced House | £300,526.00 | 19 Terraced Houses |
| Flat | £180,600.00 | 5 Flats |

