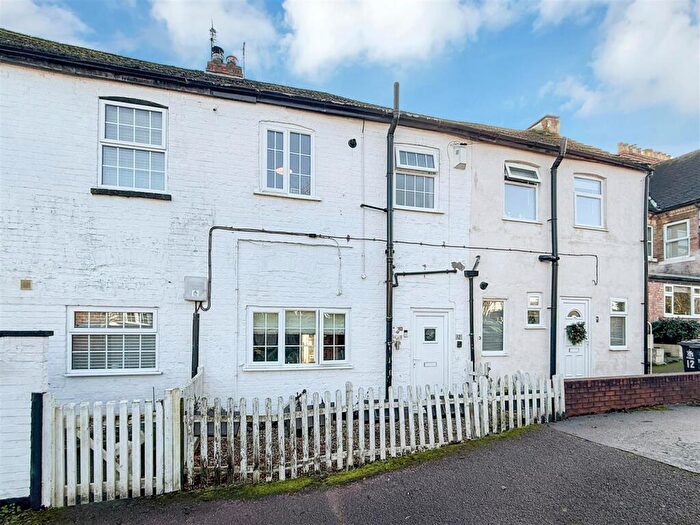
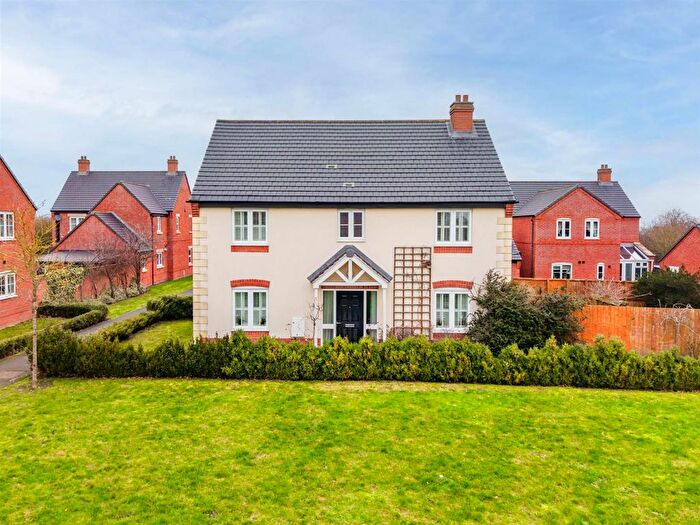
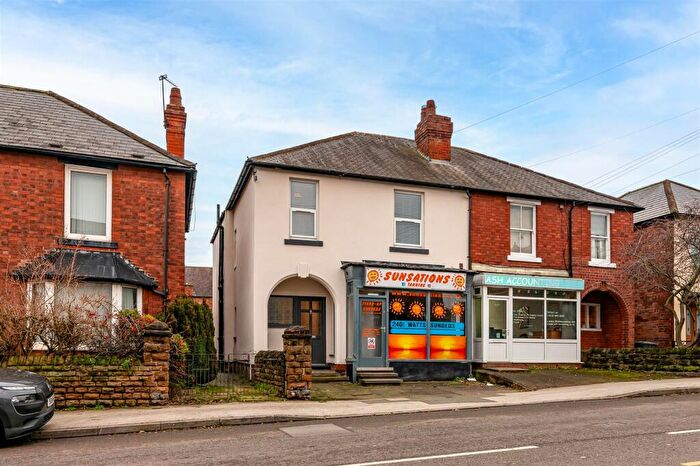
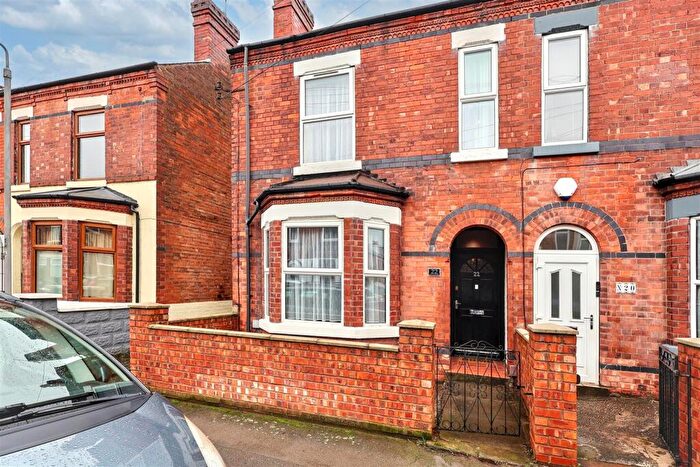
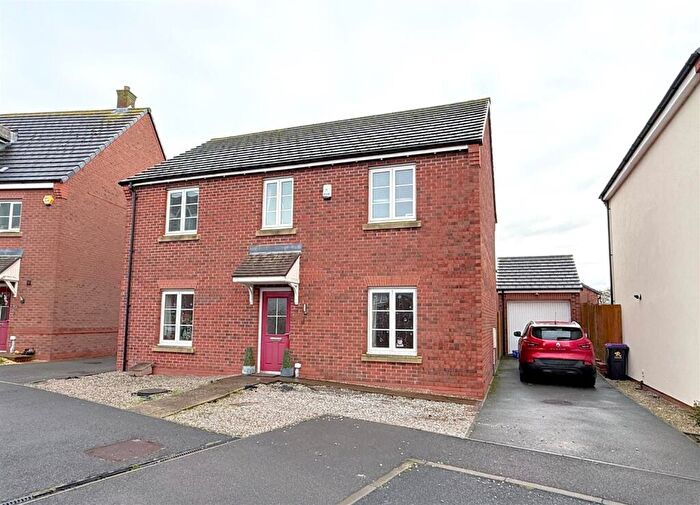
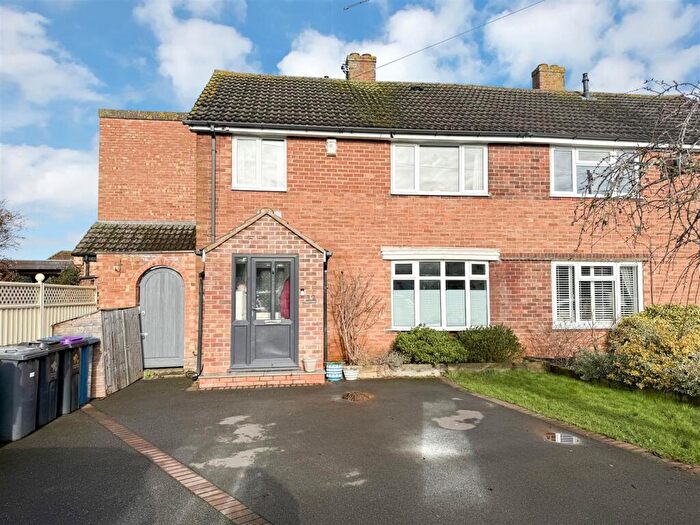
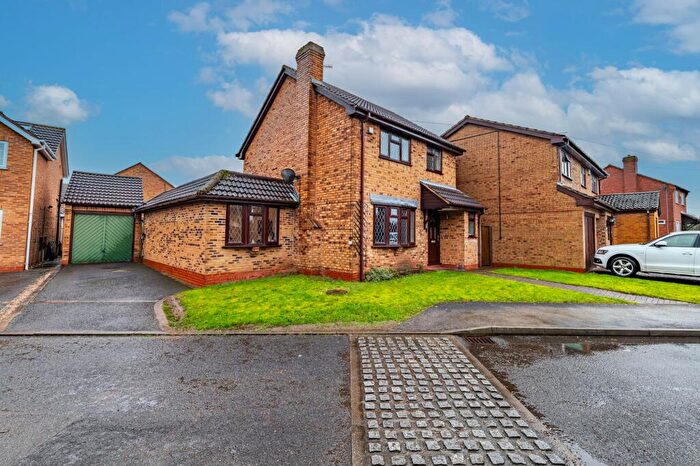
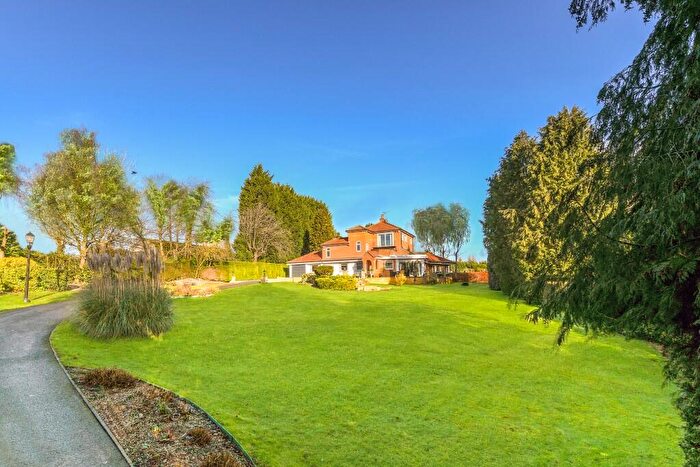
Houses for sale & to rent in Trent, Nottingham
House Prices in Trent
Properties in Trent have an average house price of £383,488.00 and had 269 Property Transactions within the last 3 years¹.
Trent is an area in Nottingham, Nottinghamshire with 2,413 households², where the most expensive property was sold for £1,700,000.00.
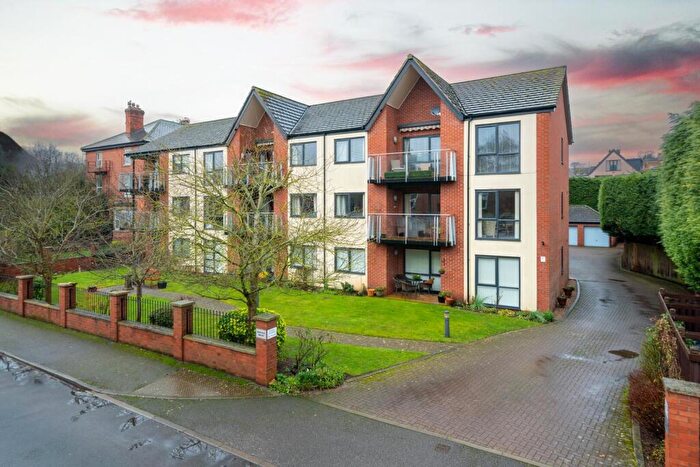
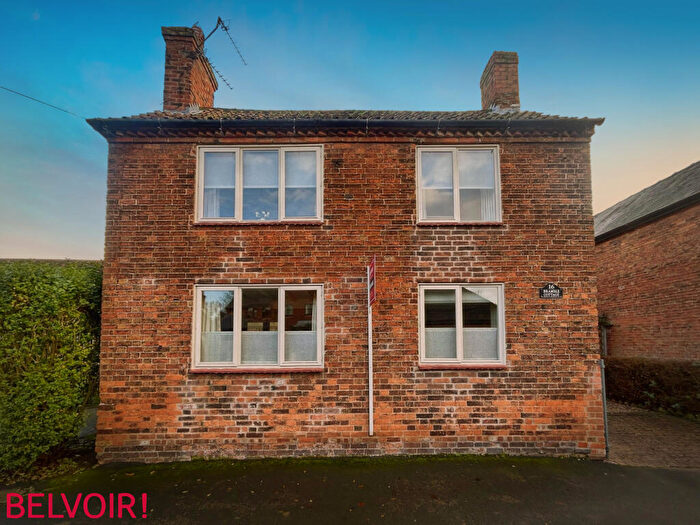
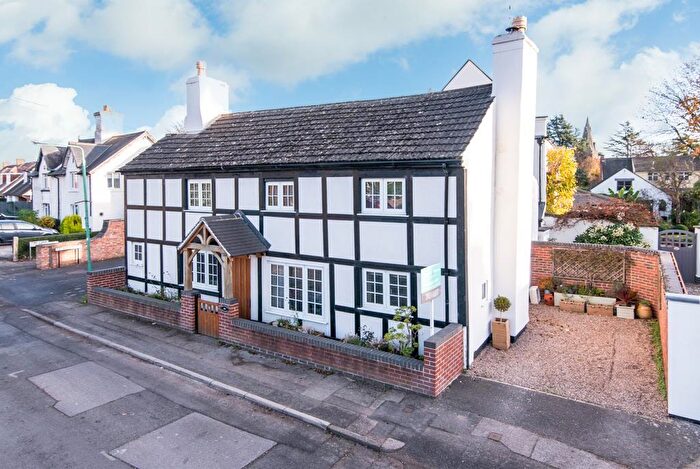
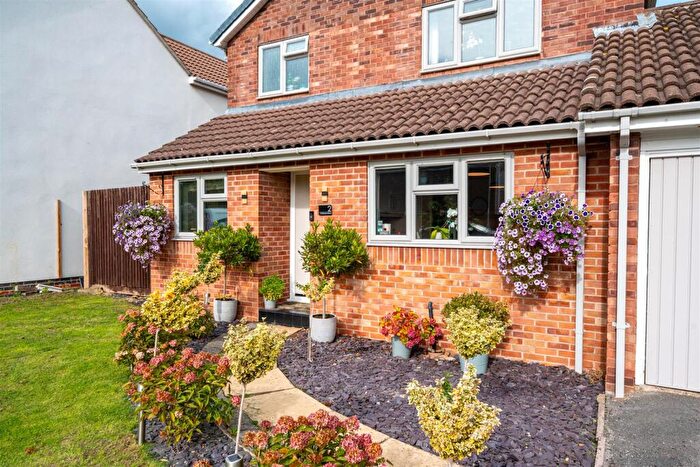
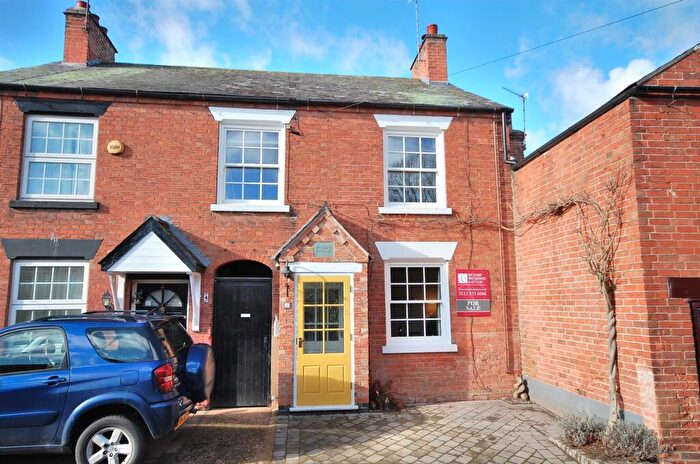
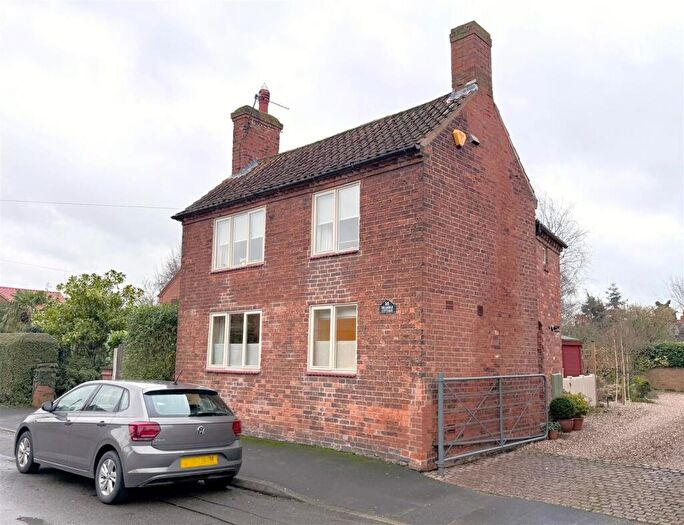
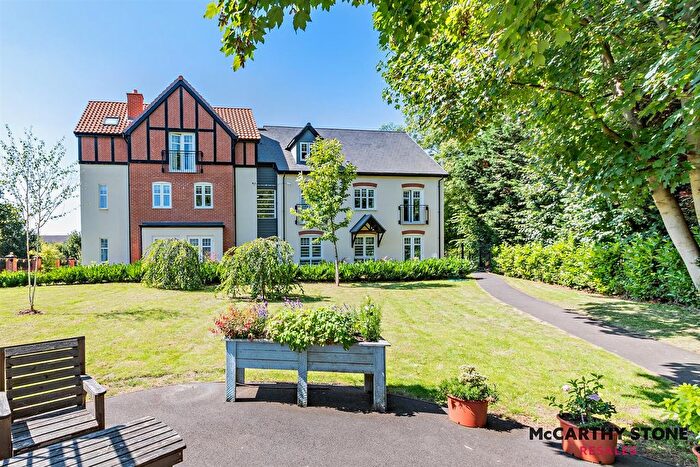
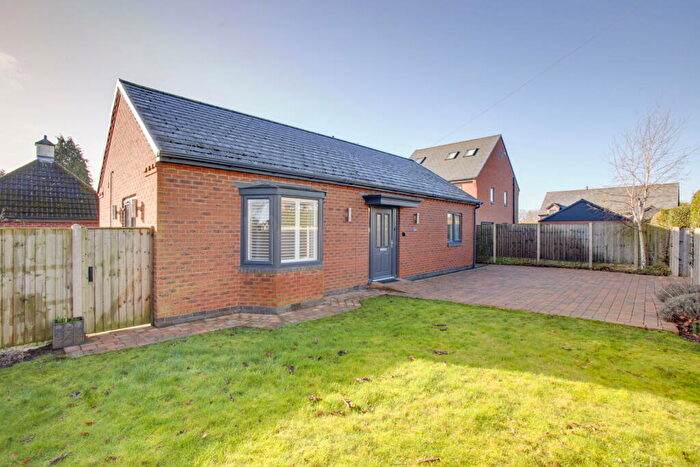
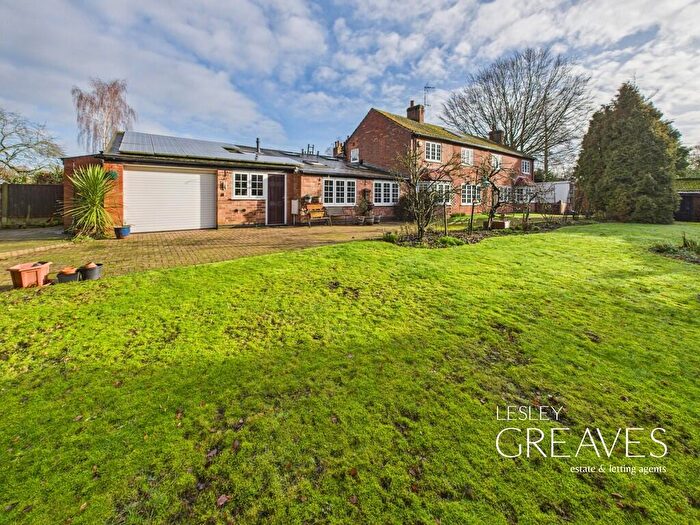
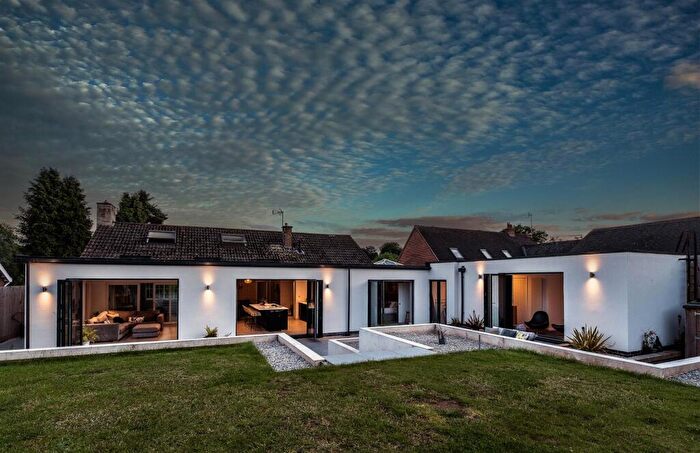
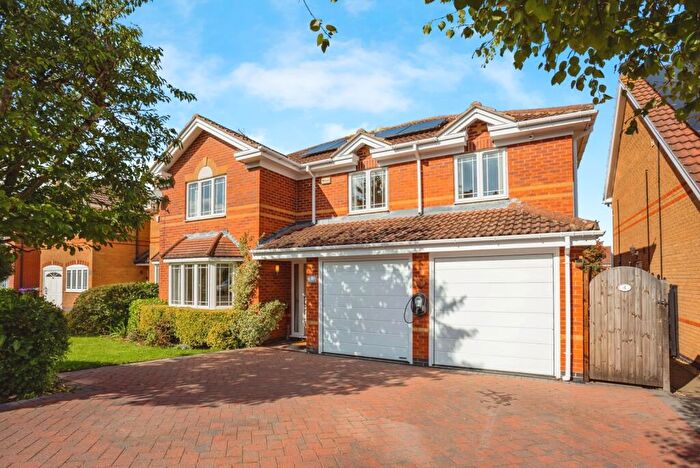
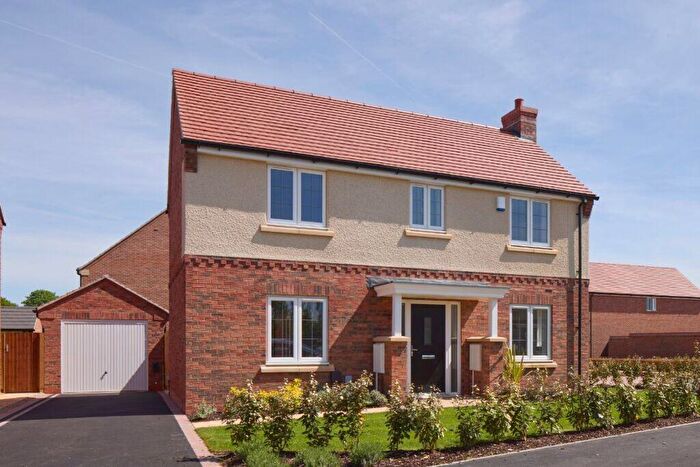
Properties for sale in Trent
Roads and Postcodes in Trent
Navigate through our locations to find the location of your next house in Trent, Nottingham for sale or to rent.
| Streets | Postcodes |
|---|---|
| Addington Court | NG12 1DW |
| Albert Street | NG12 2FL |
| Anson Road | NG13 8ZJ |
| Battle Close | NG13 8ZW |
| Beck Street | NG14 7HB |
| Bingham Road | NG12 2FU NG12 2FW NG12 2FY NG12 2GP NG12 2GT |
| Birkin Avenue | NG12 1DQ |
| Bleasby Road | NG14 7FN NG14 7FW |
| Boat Lane | NG14 7FT |
| Bolton Terrace | NG12 2FG |
| Borrowbread Lane | NG14 7GB |
| Bosworth Close | NG12 1EW |
| Brielen Court | NG12 2GB |
| Brielen Road | NG12 2GN |
| Brookfield Close | NG12 2LP |
| Butler Avenue | NG12 1BU |
| Chatsworth Avenue | NG12 1DE NG12 1DG |
| Cherrytree Close | NG12 2GE |
| Chestnut Grove | NG12 1AH |
| Chipmunk Way | NG13 8ZH |
| Church Street | NG12 1EN |
| Cliff Crescent | NG12 1AT |
| Cliff Drive | NG12 1AX |
| Cliff Way | NG12 1AQ |
| Clumber Drive | NG12 1DA NG12 1DB |
| Cropwell Gardens | NG12 2JF |
| Cropwell Road | NG12 2FJ NG12 2FQ NG12 2FS |
| Dakota Road | NG13 8ZY |
| Eastwood Road | NG12 2FZ |
| Elmores Meadow | NG14 7HF |
| Fairway Crescent | NG13 8HJ |
| Fernwood Drive | NG12 1AA |
| Firefly Close | NG13 8ZP |
| Friars Walk | NG13 8HE |
| Gatcombe Close | NG12 2GG |
| Gibsmere | NG14 7FS NG14 7LS |
| Glebe Lane | NG12 2FR |
| Golf Road | NG12 2GA |
| Grandfield Avenue | NG12 1AL |
| Grandfield Crescent | NG12 1AN |
| Grantham Road | NG12 2HB |
| Gypsy Lane | NG14 7GG |
| Haddon Way | NG12 1DD |
| Hamilton Drive | NG12 1AG |
| Hampden Road | NG13 8ZX |
| Harewood Close | NG12 2GQ |
| Hawthorn Close | NG12 1EU NG14 7HW |
| Hopewell Close | NG12 1BH |
| Hunt Close | NG12 2EQ |
| Julian Lane | NG12 1EG |
| Kingston Court | NG12 2AB |
| Lincoln Grove | NG12 2FN |
| Lorne Grove | NG12 2FX |
| Main Road | NG12 1EE NG12 2AA NG12 2FD |
| Main Street | NG13 8HN NG14 7FU NG14 7GH |
| Malkin Avenue | NG12 1DP |
| Manor Close | NG14 7GE |
| Manor Lane | NG12 1EQ |
| Manvers Grove | NG12 2FT |
| Meteor Close | NG13 8ZL |
| Morley Gardens | NG12 2GH |
| New Road | NG12 2AJ |
| Newstead Avenue | NG12 1DF |
| Newton Avenue | NG12 1BY |
| Nottingham Road | NG14 7GZ |
| Oak Tree Close | NG14 7HZ |
| Oakfield | NG12 2AL NG12 2AX |
| Oaktree Avenue | NG12 1AD |
| Orchard Close | NG14 7GF |
| Orchard View | NG14 7GQ |
| Palin Gardens | NG12 2GL |
| Park Road | NG12 1AS |
| Parr Court | NG12 2AU |
| Penrith Avenue | NG12 1BW |
| Priory Park | NG14 7HE |
| Priory Road | NG14 7GR NG14 7GW NG14 7GX |
| Queens Road | NG12 1DJ NG12 1DL |
| Richmond Drive | NG12 1BG |
| Richmond Terrace | NG12 2FE |
| Ridge Lane | NG12 1BD |
| Rockley Avenue | NG12 1AR |
| Rushcliffe Avenue | NG12 2AF |
| Saddlers Gate | NG12 2NU |
| Shelford Close | NG12 1BX |
| Shelford Hill | NG12 1ED |
| Shelford Road | NG12 1AE NG12 1AF NG12 1AJ NG12 1AP NG12 1AU NG12 1AW NG12 1AZ NG12 1BA NG12 2AE NG12 2AG NG13 8HT |
| Southwell Road | NG14 7GP NG14 7HG |
| Stanford Gardens | NG12 1AB |
| Station Road | NG14 7GD NG14 7HD |
| Station Terrace | NG12 2AH |
| Sycamore Lane | NG14 7GJ |
| The Crescent | NG12 2GR |
| The Hollows | NG14 7GS |
| The Park | NG14 7HA |
| Thoresby Close | NG12 1BZ |
| Thurgarton Lane | NG14 7JS |
| Trenchard Close | NG13 8HF NG13 8HG NG13 8HH |
| Trent View Gardens | NG12 1AY |
| Valley Road | NG12 1BB |
| Victoria Street | NG12 2FP |
| Wakefield Avenue | NG12 1BS |
| Walkers Yard | NG12 2FF |
| Walnut Court | NG12 2LN |
| Walnut Grove | NG12 2AD |
| Welbeck Road | NG12 1DH |
| West Street | NG12 1EJ |
| Westcliffe Avenue | NG12 1BT |
| Wharf Lane | NG12 2AN |
| NG14 7FR NG14 7FX NG14 7FP NG14 7FY |
Transport near Trent
-
Burton Joyce Station
-
Radcliffe (Nottinghamshire) Station
-
Lowdham Station
-
Bingham Station
-
Carlton Station
- FAQ
- Price Paid By Year
- Property Type Price
Frequently asked questions about Trent
What is the average price for a property for sale in Trent?
The average price for a property for sale in Trent is £383,488. This amount is 36% higher than the average price in Nottingham. There are 5,908 property listings for sale in Trent.
What streets have the most expensive properties for sale in Trent?
The streets with the most expensive properties for sale in Trent are Sycamore Lane at an average of £915,620, The Park at an average of £915,000 and Ridge Lane at an average of £875,000.
What streets have the most affordable properties for sale in Trent?
The streets with the most affordable properties for sale in Trent are Haddon Way at an average of £112,500, Brielen Court at an average of £116,769 and Addington Court at an average of £120,000.
Which train stations are available in or near Trent?
Some of the train stations available in or near Trent are Burton Joyce, Radcliffe (Nottinghamshire) and Lowdham.
Property Price Paid in Trent by Year
The average sold property price by year was:
| Year | Average Sold Price | Price Change |
Sold Properties
|
|---|---|---|---|
| 2025 | £408,796 | 13% |
108 Properties |
| 2024 | £356,408 | -6% |
82 Properties |
| 2023 | £376,998 | 10% |
79 Properties |
| 2022 | £339,754 | -12% |
106 Properties |
| 2021 | £382,080 | 5% |
141 Properties |
| 2020 | £361,846 | 18% |
99 Properties |
| 2019 | £298,385 | 3% |
115 Properties |
| 2018 | £289,047 | -3% |
111 Properties |
| 2017 | £296,308 | 1% |
133 Properties |
| 2016 | £293,277 | 9% |
118 Properties |
| 2015 | £267,768 | 5% |
122 Properties |
| 2014 | £255,648 | 15% |
136 Properties |
| 2013 | £217,082 | -20% |
165 Properties |
| 2012 | £260,353 | 20% |
147 Properties |
| 2011 | £208,630 | -19% |
87 Properties |
| 2010 | £247,454 | 25% |
80 Properties |
| 2009 | £185,414 | -12% |
72 Properties |
| 2008 | £207,543 | -14% |
64 Properties |
| 2007 | £236,486 | -5% |
115 Properties |
| 2006 | £249,110 | 0,4% |
143 Properties |
| 2005 | £248,171 | 19% |
117 Properties |
| 2004 | £199,950 | 15% |
111 Properties |
| 2003 | £170,165 | 9% |
116 Properties |
| 2002 | £155,534 | 9% |
113 Properties |
| 2001 | £141,706 | 3% |
134 Properties |
| 2000 | £138,060 | 32% |
131 Properties |
| 1999 | £94,180 | 19% |
211 Properties |
| 1998 | £76,719 | -6% |
129 Properties |
| 1997 | £81,369 | -18% |
138 Properties |
| 1996 | £96,376 | 12% |
92 Properties |
| 1995 | £84,999 | - |
68 Properties |
Property Price per Property Type in Trent
Here you can find historic sold price data in order to help with your property search.
The average Property Paid Price for specific property types in the last three years are:
| Property Type | Average Sold Price | Sold Properties |
|---|---|---|
| Semi Detached House | £298,002.00 | 85 Semi Detached Houses |
| Detached House | £559,454.00 | 115 Detached Houses |
| Terraced House | £217,785.00 | 42 Terraced Houses |
| Flat | £160,887.00 | 27 Flats |

