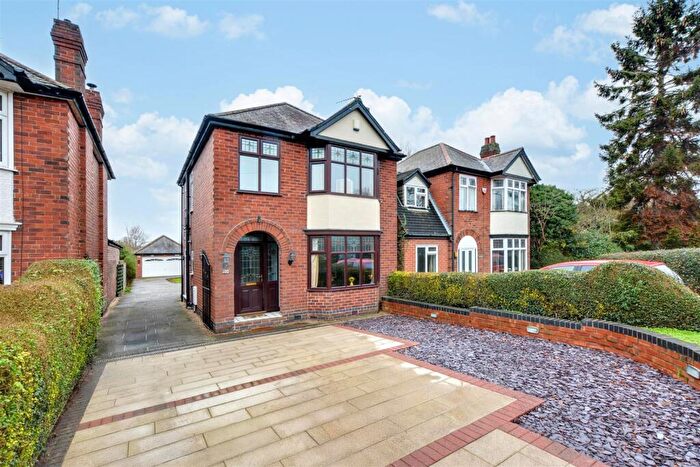
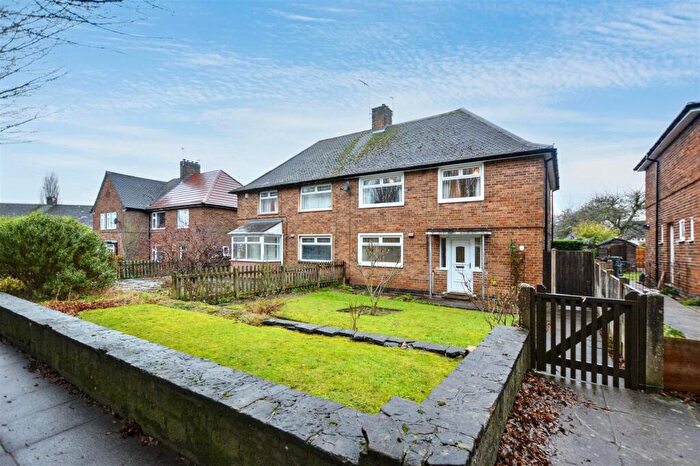
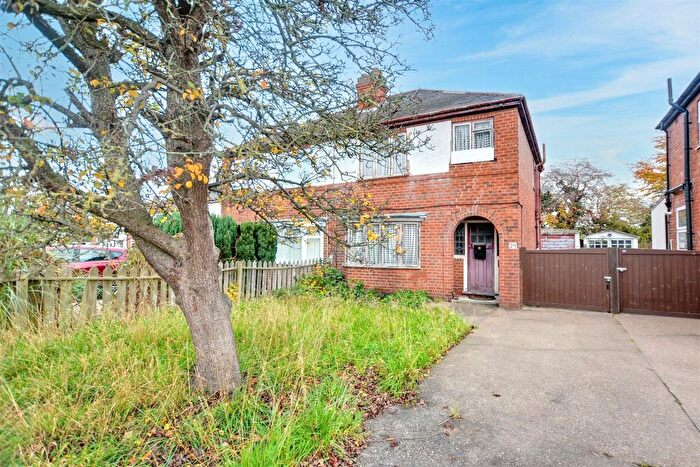
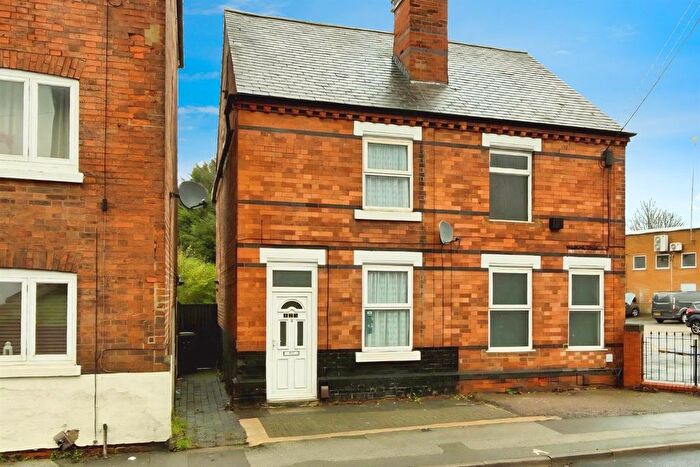
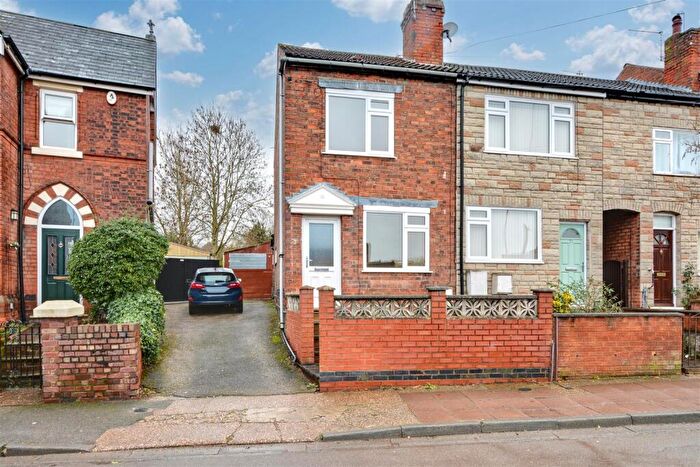
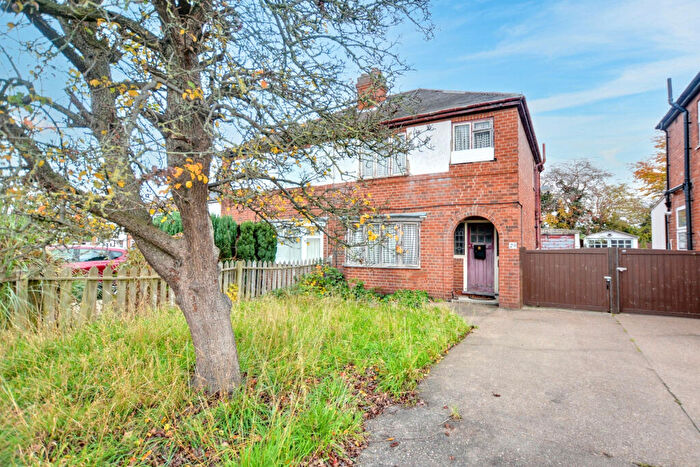
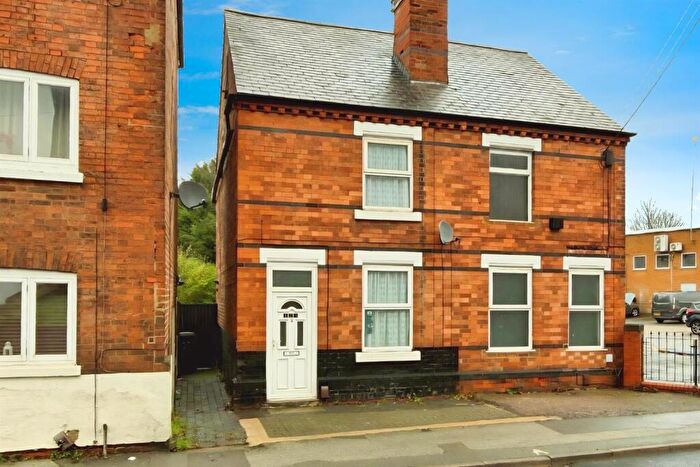
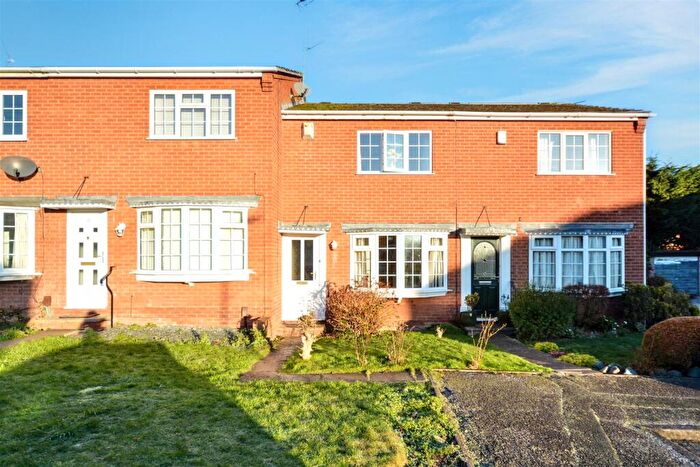
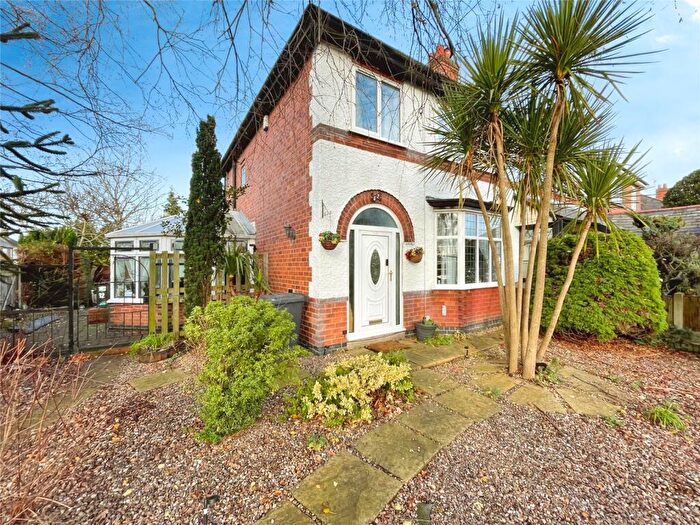
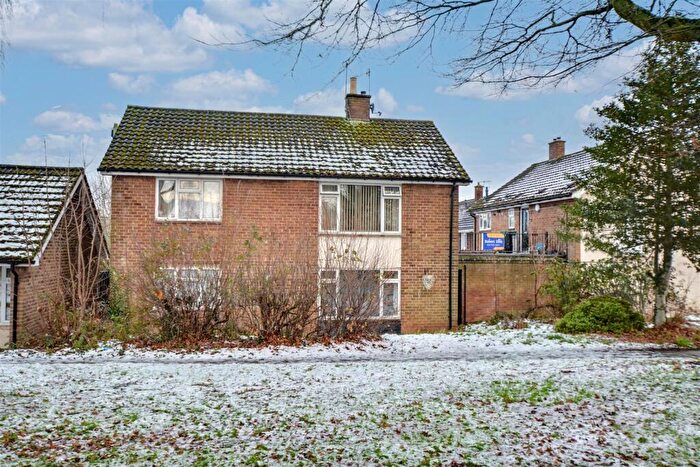
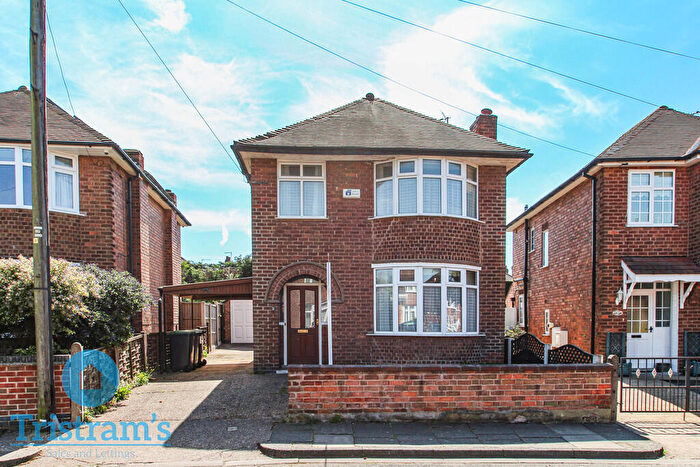
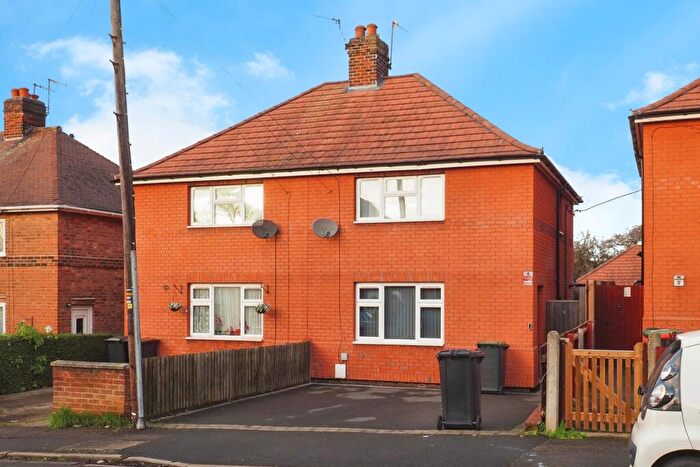
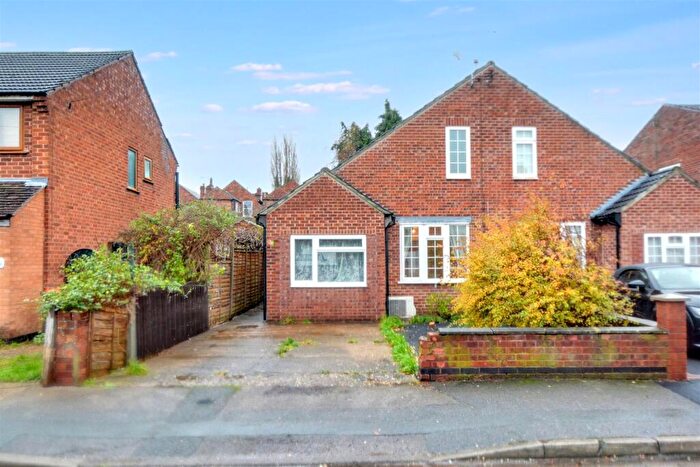
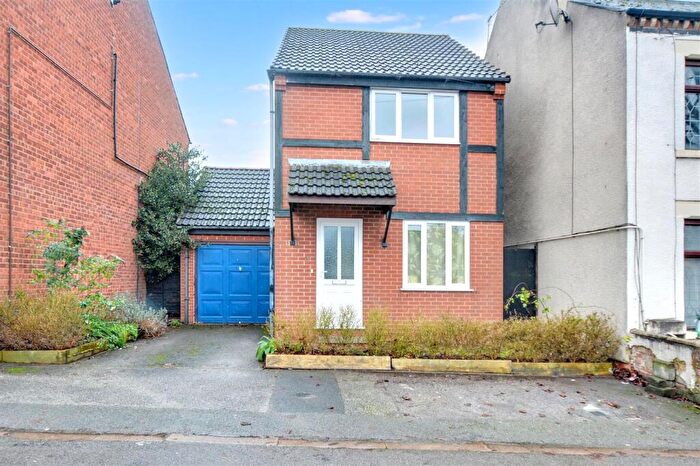
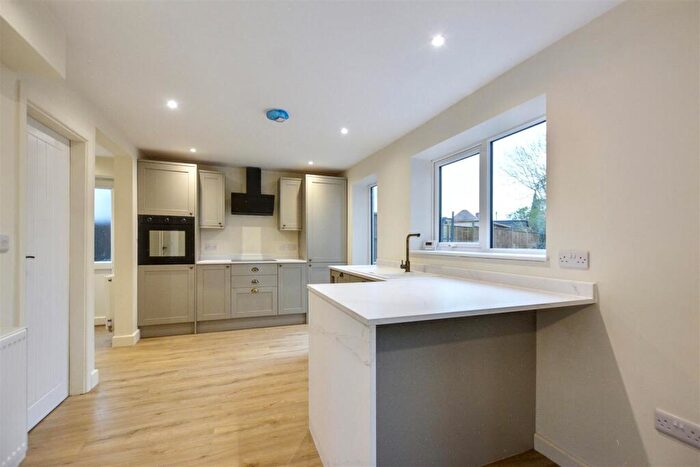
Houses for sale & to rent in Stapleford South East, Nottingham
House Prices in Stapleford South East
Properties in Stapleford South East have an average house price of £252,542.00 and had 183 Property Transactions within the last 3 years¹.
Stapleford South East is an area in Nottingham, Nottinghamshire with 2,168 households², where the most expensive property was sold for £755,000.00.
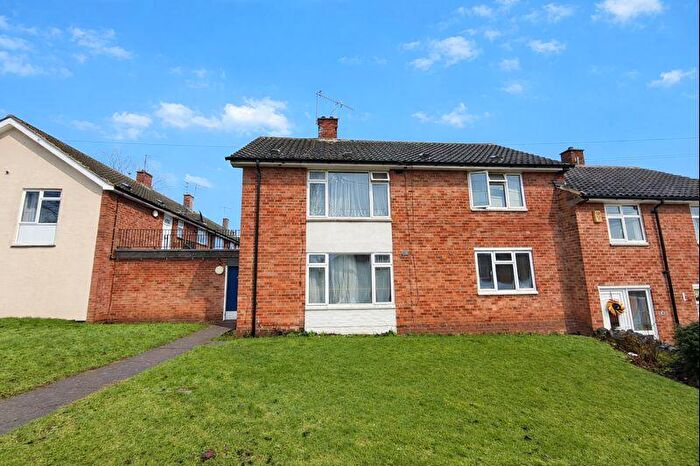
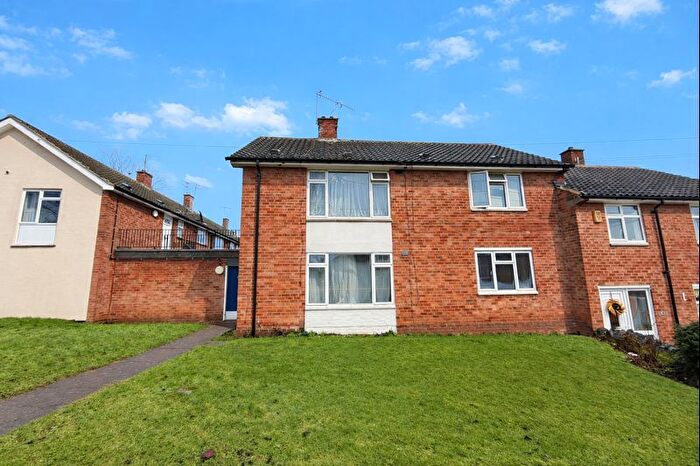
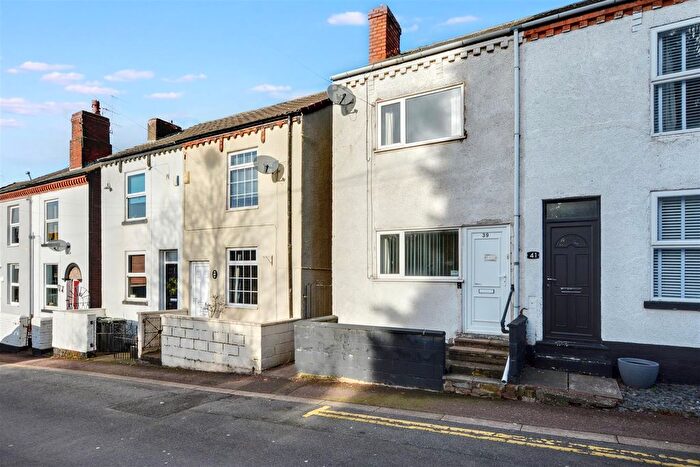
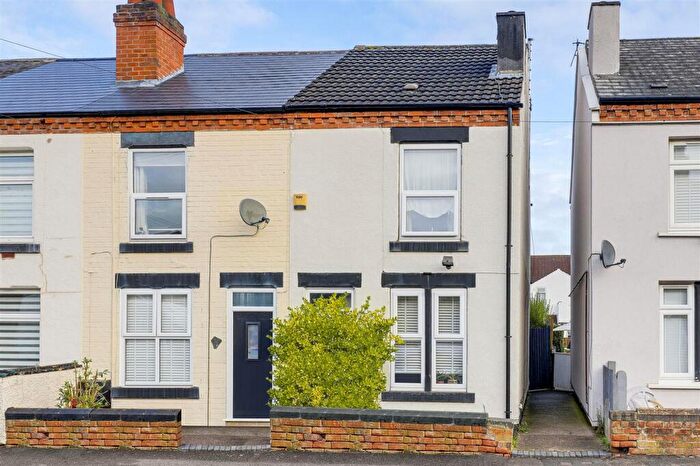
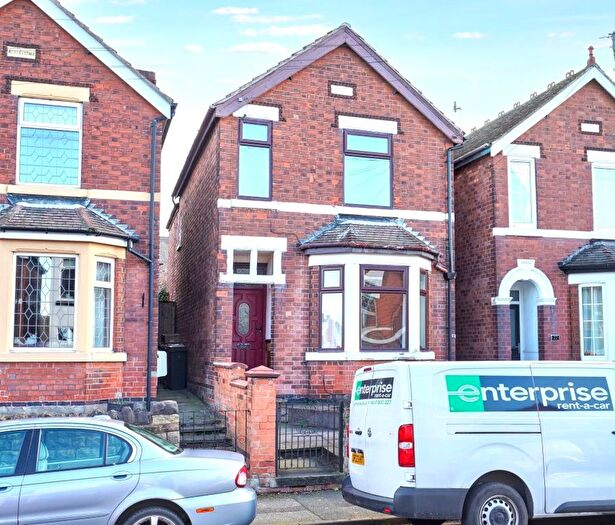
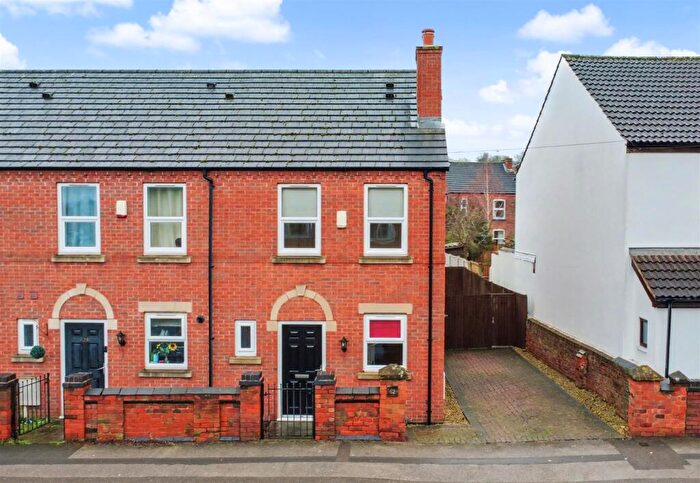
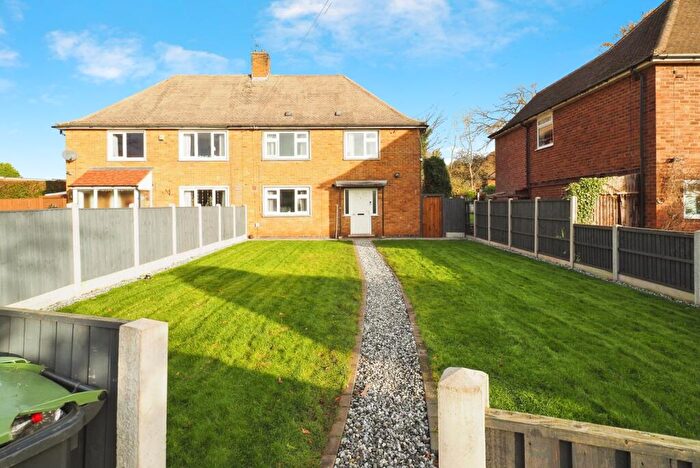
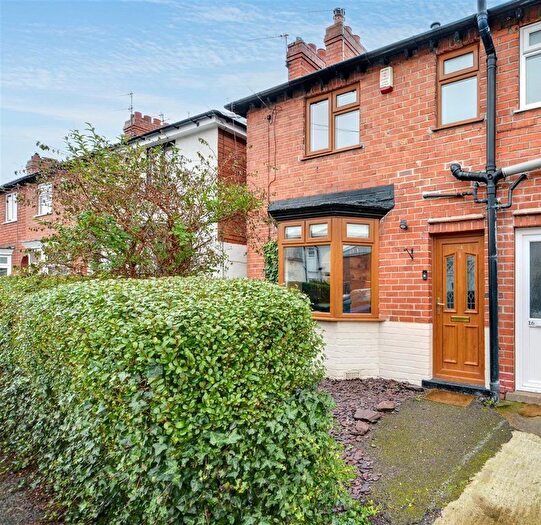
Properties for sale in Stapleford South East
Roads and Postcodes in Stapleford South East
Navigate through our locations to find the location of your next house in Stapleford South East, Nottingham for sale or to rent.
| Streets | Postcodes |
|---|---|
| Albert Street | NG9 8DB |
| Arthur Avenue | NG9 8BA |
| Baulk Lane | NG9 8BG |
| Blake Road | NG9 7HL NG9 7HN NG9 7HP NG9 7HR |
| Brampton Drive | NG9 7JJ |
| Brunswick Drive | NG9 7JL |
| Cemetery Road | NG9 8AP |
| Central Avenue | NG9 8DZ NG9 8PR NG9 8PU NG9 8QH NG9 8ED |
| Charles Avenue | NG9 8BB |
| Church Street | NG9 8DA NG9 8DJ |
| Church Walk | NG9 8DE |
| Clarehaven | NG9 7JF |
| Cliff Hill Avenue | NG9 7HD |
| Cloud Avenue | NG9 8BN |
| Copeland Avenue | NG9 8DQ |
| Dalley Close | NG9 8DR |
| Darkey Lane | NG9 7JH |
| Eleanor Crescent | NG9 8BH |
| Ewe Lamb Lane | NG9 3JW NG9 3LS |
| Gainsborough Close | NG9 7HX |
| Gregory Close | NG9 8PW |
| Gutersloh Court | NG9 8QD |
| Guy Close | NG9 7GZ |
| Hemlock Avenue | NG9 8DN |
| Hickings Lane | NG9 8PB NG9 8PG NG9 8PJ |
| High Street | NG9 8AG |
| Hillfield Road | NG9 8PS NG9 8PT |
| Hogarth Close | NG9 7HS |
| Holden Gardens | NG9 7GX |
| Judson Avenue | NG9 7FH |
| Kayes Court | NG9 8EB |
| Lancaster Avenue | NG9 7HH |
| Lower Orchard Street | NG9 8DH |
| Middle Orchard Street | NG9 8DD |
| Nottingham Road | NG9 8AA NG9 8AB NG9 8AD NG9 8AQ NG9 8AR NG9 8AT NG9 8AY NG9 8BE NG9 8BJ NG9 8AE NG9 8AS NG9 8AU |
| Parker Gardens | NG9 8QG |
| Pinfold Lane | NG9 8DL |
| Plackett Close | NG9 8QF |
| Pritchard Drive | NG9 7GW |
| Revill Crescent | NG9 8EH |
| Rockwell Court | NG9 8BZ |
| Ryecroft Street | NG9 8AW NG9 8AX NG9 8PN |
| Sandstone Close | NG9 8AN |
| Saville Close | NG9 8DS |
| Sefton Avenue | NG9 8EA |
| Severals | NG9 8BL |
| Sherwin Road | NG9 8PP NG9 8PQ |
| Sisley Avenue | NG9 7HT NG9 7HU NG9 7HW |
| Spencer Crescent | NG9 8EG |
| Springfield Court | NG9 8PL |
| Sunlea Crescent | NG9 7JP |
| Taylor Crescent | NG9 8EF |
| Tevery Close | NG9 8DU |
| Tilford Gardens | NG9 7FJ |
| Toton Lane | NG9 7HB NG9 7HY NG9 7HZ NG9 7JD NG9 7JN NG9 7JQ |
| Trevone Avenue | NG9 7HJ |
| Turner Close | NG9 7HQ |
| Upper Orchard Street | NG9 8DF |
| Wadsworth Road | NG9 8AZ NG9 8BD |
| Walker Grove | NG9 7GY |
| Welch Avenue | NG9 8EE NG9 8EJ |
| Wesley Place | NG9 8DP |
| Wesleyan Chapel Walk | NG9 8BQ |
| West Avenue | NG9 8DW NG9 8DY |
| West Cross Avenue | NG9 8DX |
| Westerlands | NG9 7JE NG9 7JG |
| Whitely Close | NG9 8DT |
| Windsor Crescent | NG9 7HF |
| Windsor Street | NG9 7HE NG9 7HG |
| NG9 8BX |
Transport near Stapleford South East
-
Attenborough Station
-
Beeston Station
-
Long Eaton Station
-
Ilkeston Station
-
East Midlands Parkway Station
- FAQ
- Price Paid By Year
- Property Type Price
Frequently asked questions about Stapleford South East
What is the average price for a property for sale in Stapleford South East?
The average price for a property for sale in Stapleford South East is £252,542. This amount is 10% lower than the average price in Nottingham. There are 1,462 property listings for sale in Stapleford South East.
What streets have the most expensive properties for sale in Stapleford South East?
The streets with the most expensive properties for sale in Stapleford South East are Parker Gardens at an average of £500,000, Tilford Gardens at an average of £465,000 and Judson Avenue at an average of £455,000.
What streets have the most affordable properties for sale in Stapleford South East?
The streets with the most affordable properties for sale in Stapleford South East are Albert Street at an average of £155,000, Springfield Court at an average of £175,000 and Wesley Place at an average of £181,000.
Which train stations are available in or near Stapleford South East?
Some of the train stations available in or near Stapleford South East are Attenborough, Beeston and Long Eaton.
Property Price Paid in Stapleford South East by Year
The average sold property price by year was:
| Year | Average Sold Price | Price Change |
Sold Properties
|
|---|---|---|---|
| 2025 | £250,963 | 1% |
54 Properties |
| 2024 | £247,641 | -5% |
65 Properties |
| 2023 | £258,852 | 5% |
64 Properties |
| 2022 | £245,762 | 7% |
70 Properties |
| 2021 | £229,693 | 3% |
99 Properties |
| 2020 | £221,896 | 24% |
90 Properties |
| 2019 | £169,390 | -1% |
100 Properties |
| 2018 | £171,861 | -3% |
146 Properties |
| 2017 | £176,300 | 14% |
83 Properties |
| 2016 | £150,823 | -12% |
98 Properties |
| 2015 | £168,620 | 13% |
87 Properties |
| 2014 | £147,479 | 3% |
67 Properties |
| 2013 | £143,550 | 6% |
78 Properties |
| 2012 | £134,240 | -7% |
59 Properties |
| 2011 | £144,100 | 8% |
63 Properties |
| 2010 | £133,179 | 2% |
48 Properties |
| 2009 | £130,665 | -28% |
47 Properties |
| 2008 | £166,676 | 14% |
57 Properties |
| 2007 | £143,513 | 0,2% |
79 Properties |
| 2006 | £143,289 | 10% |
105 Properties |
| 2005 | £128,349 | -14% |
64 Properties |
| 2004 | £146,344 | 16% |
79 Properties |
| 2003 | £122,922 | 18% |
116 Properties |
| 2002 | £100,474 | 16% |
108 Properties |
| 2001 | £84,510 | 1% |
85 Properties |
| 2000 | £84,019 | 12% |
90 Properties |
| 1999 | £73,634 | 13% |
93 Properties |
| 1998 | £63,910 | 12% |
95 Properties |
| 1997 | £56,053 | 13% |
91 Properties |
| 1996 | £49,004 | -30% |
79 Properties |
| 1995 | £63,612 | - |
97 Properties |
Property Price per Property Type in Stapleford South East
Here you can find historic sold price data in order to help with your property search.
The average Property Paid Price for specific property types in the last three years are:
| Property Type | Average Sold Price | Sold Properties |
|---|---|---|
| Semi Detached House | £235,184.00 | 87 Semi Detached Houses |
| Detached House | £347,073.00 | 49 Detached Houses |
| Terraced House | £189,810.00 | 36 Terraced Houses |
| Flat | £174,040.00 | 11 Flats |

