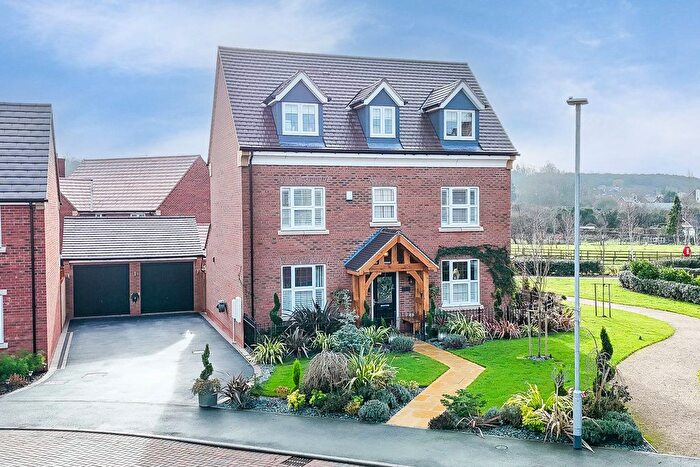
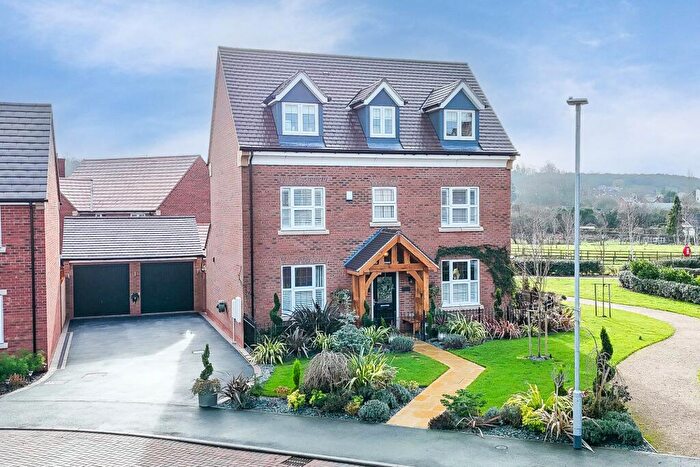
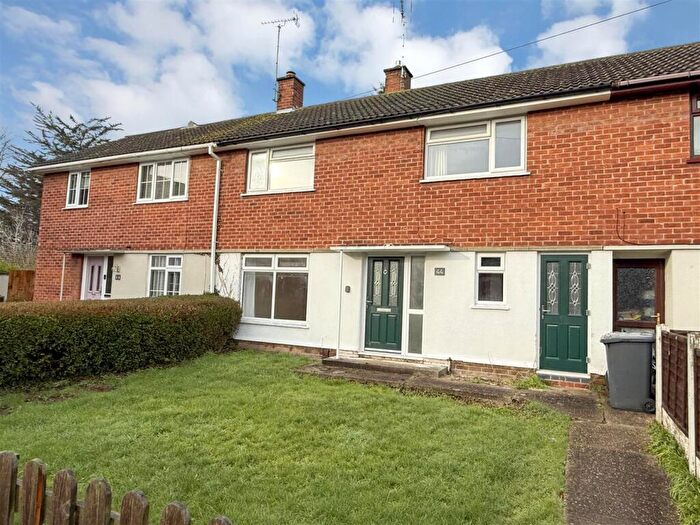
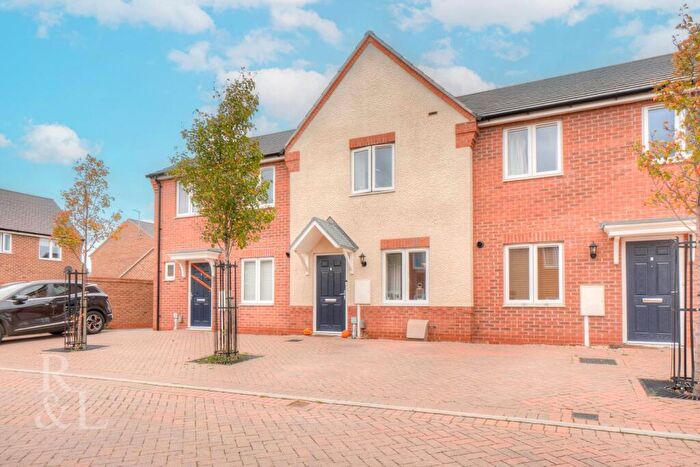
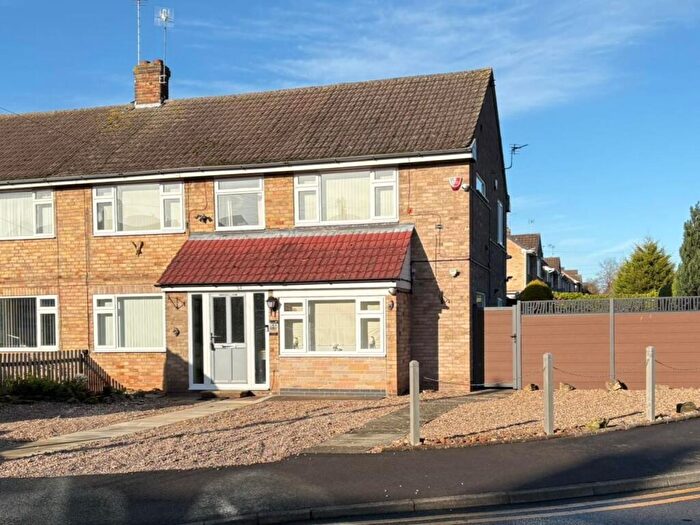
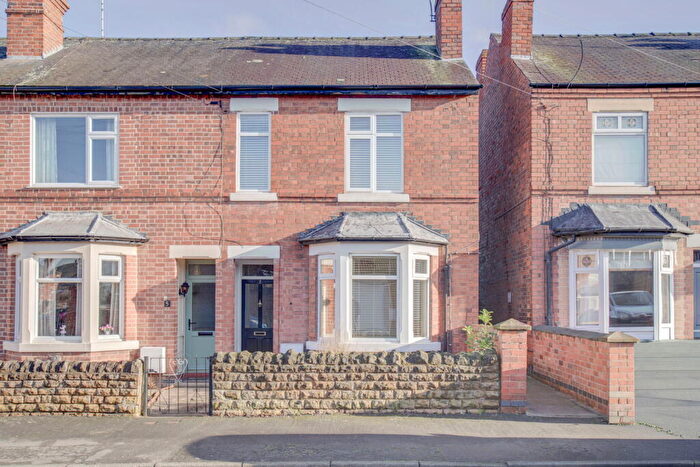
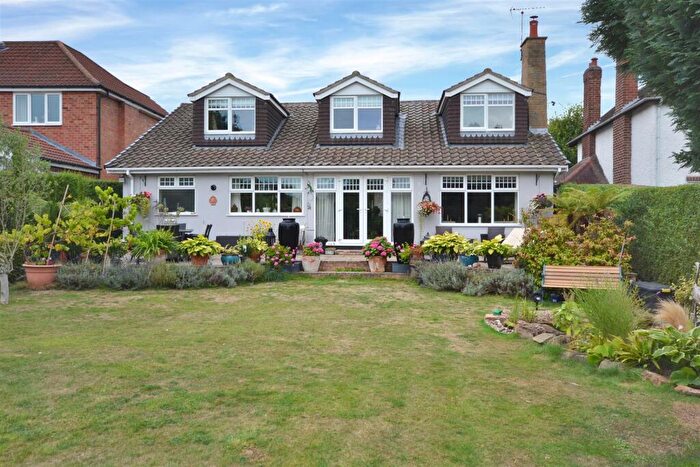
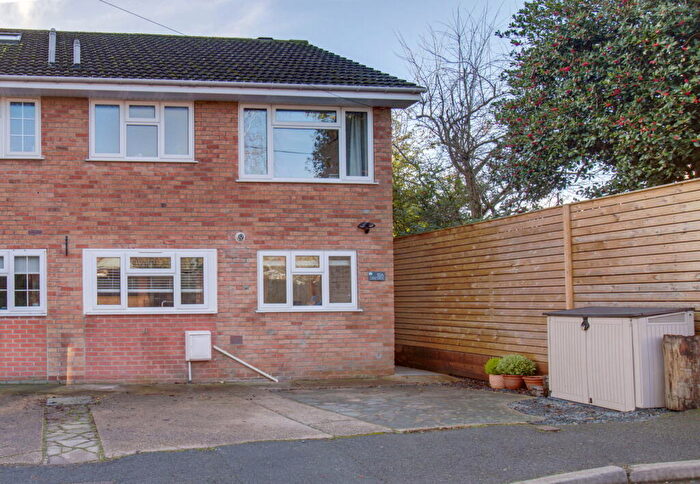
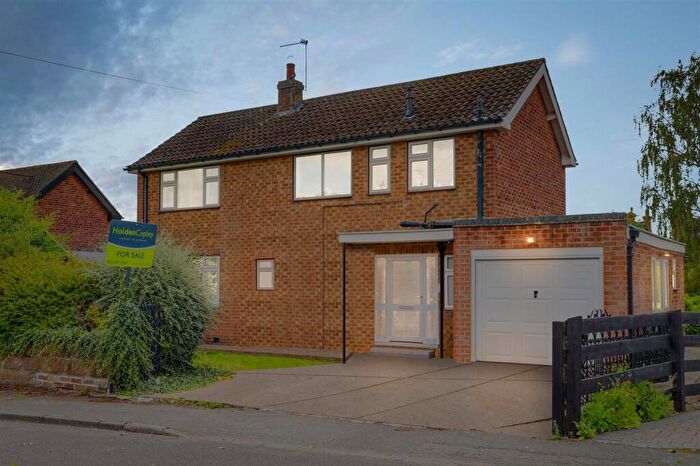
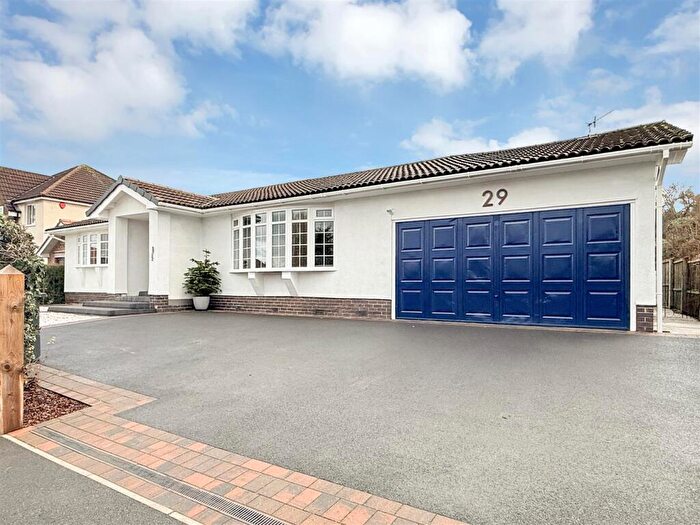
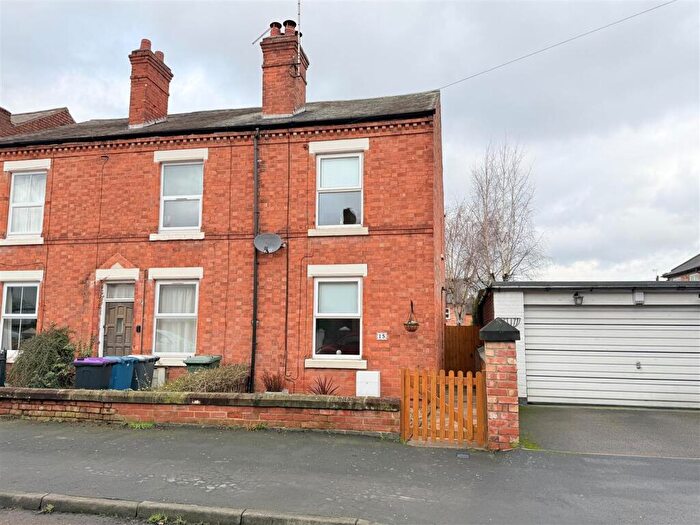
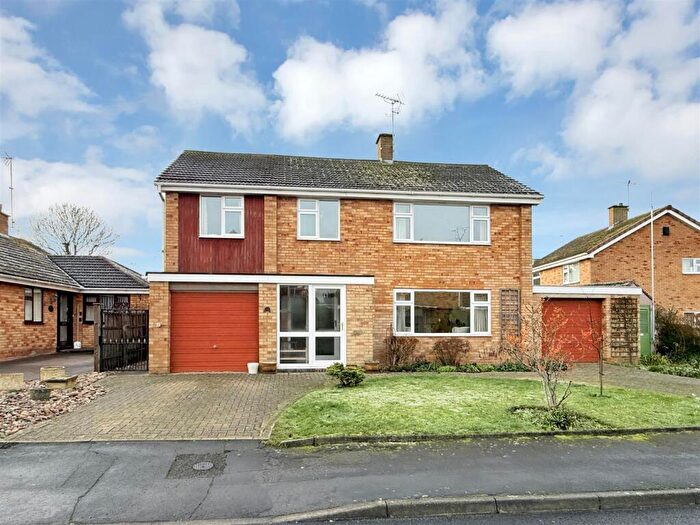
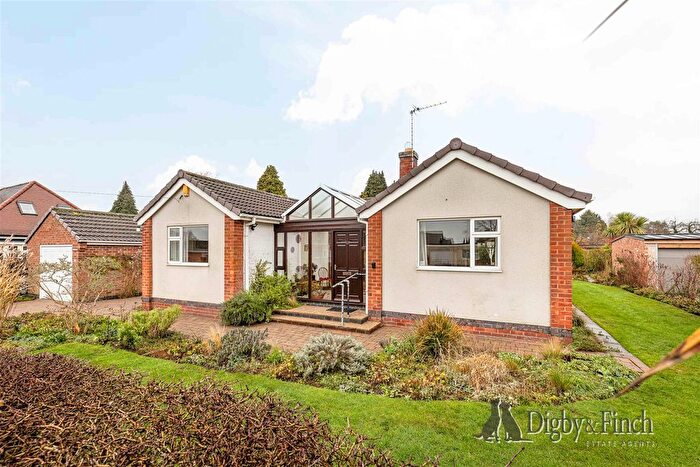
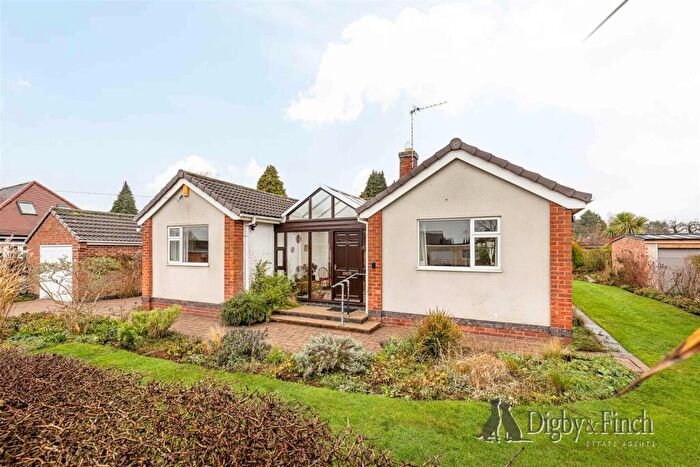
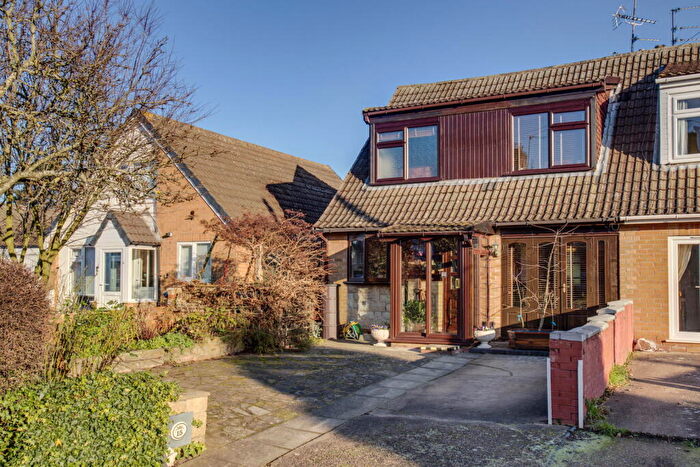
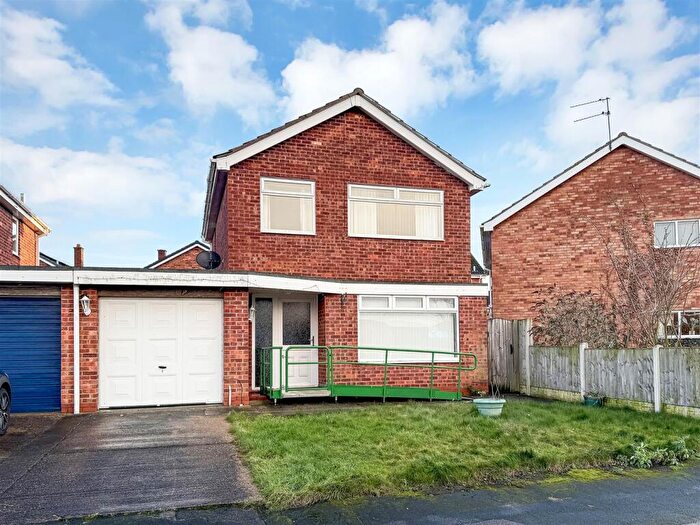
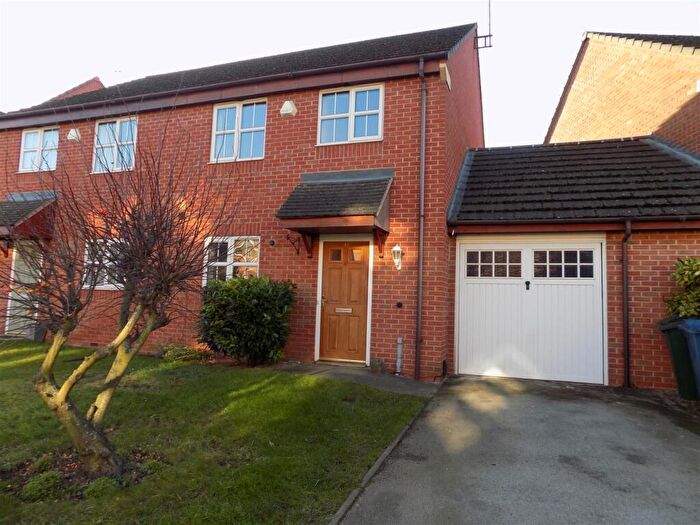
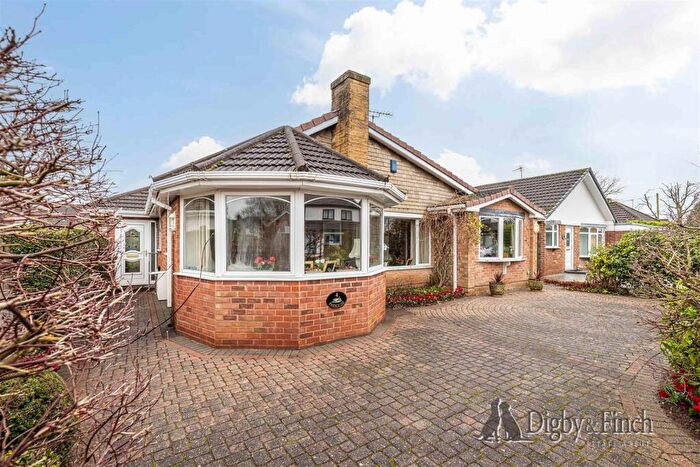
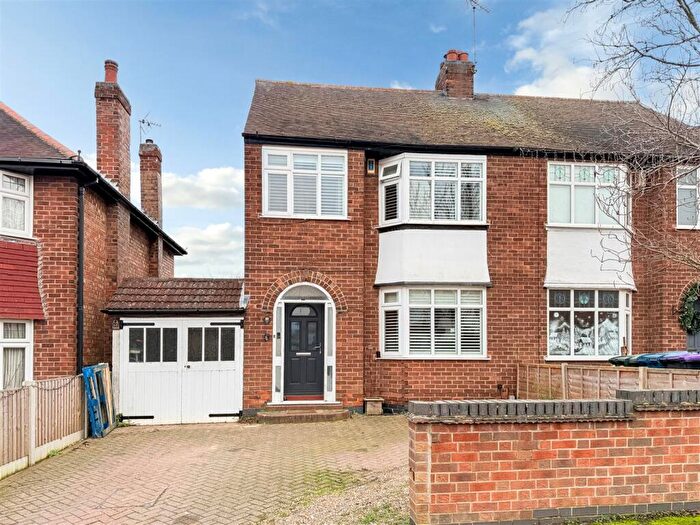
Houses for sale & to rent in Manvers, Nottingham
House Prices in Manvers
Properties in Manvers have an average house price of £333,659.00 and had 174 Property Transactions within the last 3 years¹.
Manvers is an area in Nottingham, Nottinghamshire with 1,723 households², where the most expensive property was sold for £1,100,000.00.
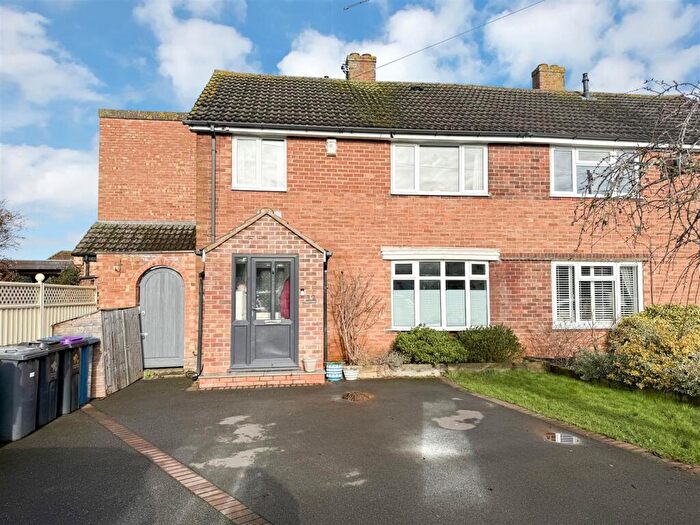
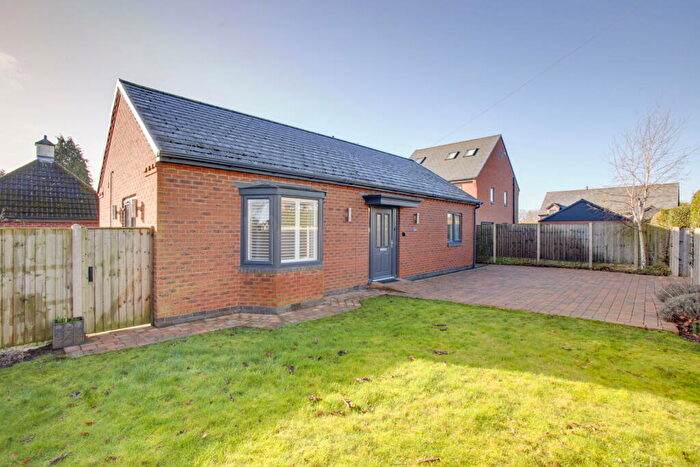
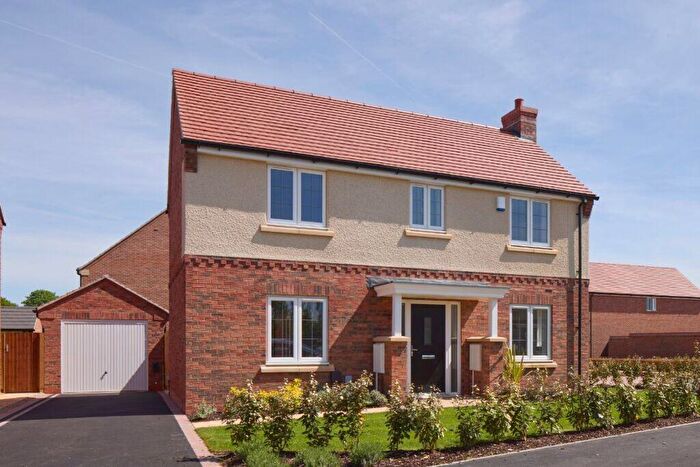
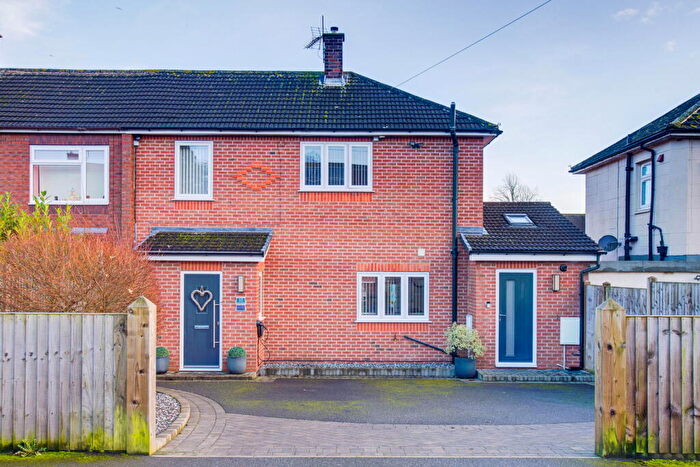
Properties for sale in Manvers
Roads and Postcodes in Manvers
Navigate through our locations to find the location of your next house in Manvers, Nottingham for sale or to rent.
| Streets | Postcodes |
|---|---|
| Bailey Court | NG12 2DN |
| Bailey Lane | NG12 2DA NG12 2EG |
| Barrington Close | NG12 2DZ |
| Beech Close | NG12 2DH |
| Berkeley Crescent | NG12 2NW |
| Blakeney Road | NG12 2GX |
| Bloomsbury Mews | NG12 2NG |
| Brickyard Lane | NG12 2HF |
| Buckingham Drive | NG12 2NE |
| Carnaby Close | NG12 2LQ |
| Carter Avenue | NG12 2GU |
| Chelsea Mews | NG12 2NT |
| Covent Gardens | NG12 2NF |
| Covert Crescent | NG12 2HN NG12 2HP |
| Cropwell Road | NG12 2JG |
| Cutlers Court | NG12 2PS |
| Dormy Close | NG12 2JA |
| Douglas Close | NG12 2ED |
| Dowson Close | NG12 2PR |
| Fenimore Court | NG12 2JB |
| Grantham Road | NG12 2DR NG12 2HA NG12 2HE NG12 2HG NG12 2HS NG12 2HY NG12 2PT |
| Granville Crescent | NG12 2EF |
| Greenway Close | NG12 2BU |
| Grosvenor Close | NG12 2NN |
| Hammersmith Close | NG12 2NQ |
| Harlequin Close | NG12 2HQ |
| Harlequin Mews | NG12 2GF |
| Hillside Road | NG12 2GZ |
| Hogg Lane | NG12 2BL |
| Holme Lane | NG12 2LB |
| Home Farm Lane | NG12 2LL |
| Hudson Way | NG12 2PP |
| Jasper Close | NG12 2EP |
| Johns Road | NG12 2GW |
| Kingsway | NG12 2EB |
| Lamcote Gardens | NG12 2BS |
| Lamcote Mews | NG12 2BT |
| Lees Barn Road | NG12 2DS |
| Lime Close | NG12 2DF |
| Main Road | NG12 2BE NG12 2BJ NG12 2BP NG12 2BQ |
| Maple Close | NG12 2DG |
| Marl Road | NG12 2GY |
| Mayfair | NG12 2NP |
| Meadow End | NG12 2HU |
| Morton Close | NG12 2JE |
| Morton Gardens | NG12 2HW |
| Mount Pleasant | NG12 2AY |
| Northfield Avenue | NG12 2HX |
| Nottingham Road | NG12 2BW NG12 2DW |
| Nursery Close | NG12 2JD |
| Nursery Road | NG12 2HH |
| Orchard Close | NG12 2BN |
| Orford Avenue | NG12 2DD |
| Paddock Close | NG12 2BX |
| Portage Close | NG12 2EN |
| Prince Edward Crescent | NG12 2DX |
| Queen Marys Close | NG12 2NR |
| Regina Close | NG12 2EL |
| Saskatoon Close | NG12 2EJ |
| Saxondale Drive | NG12 2JL |
| Serpentine Close | NG12 2NS |
| Shadwell Grove | NG12 2ET |
| Shaftesbury Avenue | NG12 2NH |
| South Avenue | NG12 2HR |
| St Catherines Street | NG12 2EA |
| St Lawrence Boulevard | NG12 2DY NG12 2EH |
| Sycamore Close | NG12 2DJ |
| Sydney Grove | NG12 2BH |
| Talbot Court | NG12 2DQ |
| The Green | NG12 2LA |
| The Woodlands | NG12 2JY |
| Thomas Avenue | NG12 2HT |
| Vancouver Avenue | NG12 2ES |
| Vicarage Lane | NG12 2FB |
| Water Lane | NG12 2BY NG12 2BZ NG12 2DB |
| West End Villas | NG12 2BD |
| Westminster Drive | NG12 2NL |
| Whitehall Court | NG12 2NJ |
| Whitworth Drive | NG12 2DE NG12 2ER |
| Willow Close | NG12 2DL |
| Woodland Close | NG12 2HZ |
| Woodside Avenue | NG12 2HL |
| Woodside Road | NG12 2HJ |
| Yew Tree Close | NG12 2AZ |
| Yonge Close | NG12 2EE |
Transport near Manvers
- FAQ
- Price Paid By Year
- Property Type Price
Frequently asked questions about Manvers
What is the average price for a property for sale in Manvers?
The average price for a property for sale in Manvers is £333,659. This amount is 18% higher than the average price in Nottingham. There are 337 property listings for sale in Manvers.
What streets have the most expensive properties for sale in Manvers?
The streets with the most expensive properties for sale in Manvers are Cropwell Road at an average of £750,000, The Woodlands at an average of £709,000 and Grosvenor Close at an average of £690,000.
What streets have the most affordable properties for sale in Manvers?
The streets with the most affordable properties for sale in Manvers are Fenimore Court at an average of £139,166, Talbot Court at an average of £140,000 and Cutlers Court at an average of £183,333.
Which train stations are available in or near Manvers?
Some of the train stations available in or near Manvers are Radcliffe (Nottinghamshire), Netherfield and Carlton.
Property Price Paid in Manvers by Year
The average sold property price by year was:
| Year | Average Sold Price | Price Change |
Sold Properties
|
|---|---|---|---|
| 2025 | £344,078 | 6% |
57 Properties |
| 2024 | £323,902 | -4% |
70 Properties |
| 2023 | £335,556 | 5% |
47 Properties |
| 2022 | £318,789 | 7% |
69 Properties |
| 2021 | £297,922 | -1% |
96 Properties |
| 2020 | £301,745 | 7% |
77 Properties |
| 2019 | £279,510 | 15% |
65 Properties |
| 2018 | £237,119 | -3% |
70 Properties |
| 2017 | £243,719 | -2% |
87 Properties |
| 2016 | £249,794 | -0,4% |
82 Properties |
| 2015 | £250,741 | 13% |
66 Properties |
| 2014 | £217,172 | -0,2% |
94 Properties |
| 2013 | £217,616 | 13% |
65 Properties |
| 2012 | £189,447 | -15% |
70 Properties |
| 2011 | £218,119 | 2% |
64 Properties |
| 2010 | £213,064 | -2% |
63 Properties |
| 2009 | £218,052 | 9% |
76 Properties |
| 2008 | £197,969 | -19% |
52 Properties |
| 2007 | £235,542 | 6% |
95 Properties |
| 2006 | £222,344 | 3% |
116 Properties |
| 2005 | £215,503 | -5% |
77 Properties |
| 2004 | £225,343 | 15% |
112 Properties |
| 2003 | £192,614 | 16% |
137 Properties |
| 2002 | £162,697 | 13% |
128 Properties |
| 2001 | £142,027 | -4% |
112 Properties |
| 2000 | £147,463 | 15% |
126 Properties |
| 1999 | £124,995 | 14% |
134 Properties |
| 1998 | £107,833 | 2% |
114 Properties |
| 1997 | £106,083 | 19% |
121 Properties |
| 1996 | £86,444 | 19% |
95 Properties |
| 1995 | £69,636 | - |
47 Properties |
Property Price per Property Type in Manvers
Here you can find historic sold price data in order to help with your property search.
The average Property Paid Price for specific property types in the last three years are:
| Property Type | Average Sold Price | Sold Properties |
|---|---|---|
| Semi Detached House | £299,636.00 | 54 Semi Detached Houses |
| Detached House | £395,618.00 | 85 Detached Houses |
| Terraced House | £278,391.00 | 24 Terraced Houses |
| Flat | £142,500.00 | 11 Flats |

