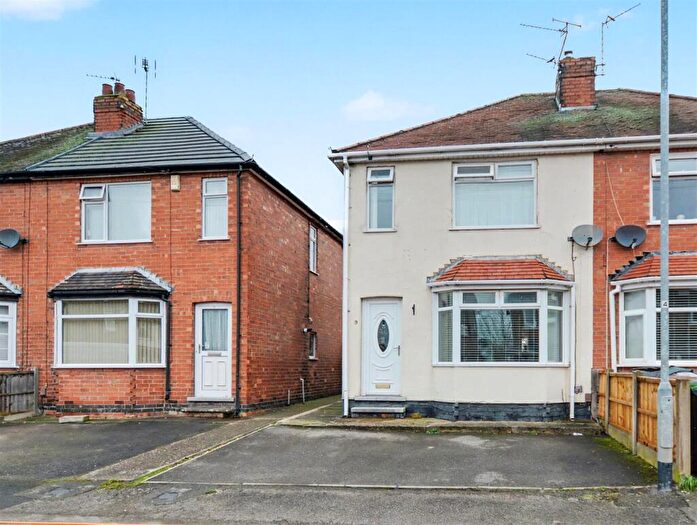
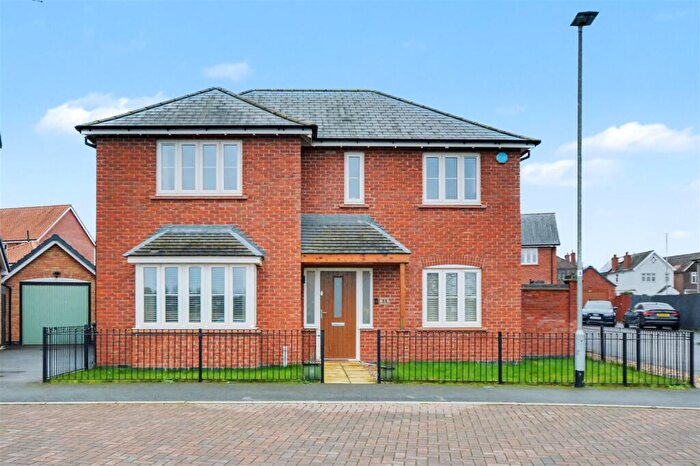
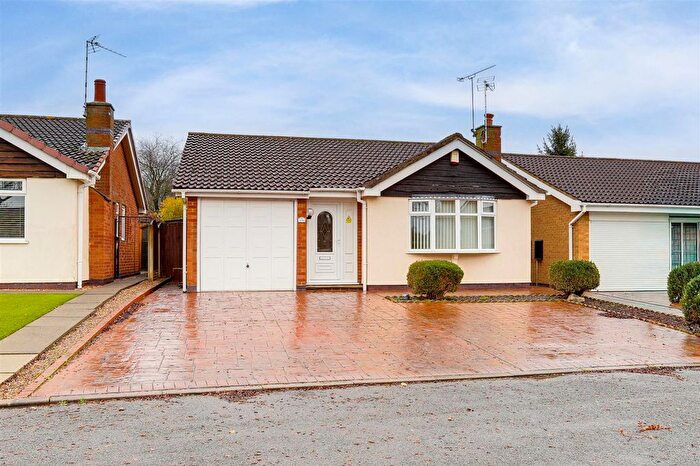
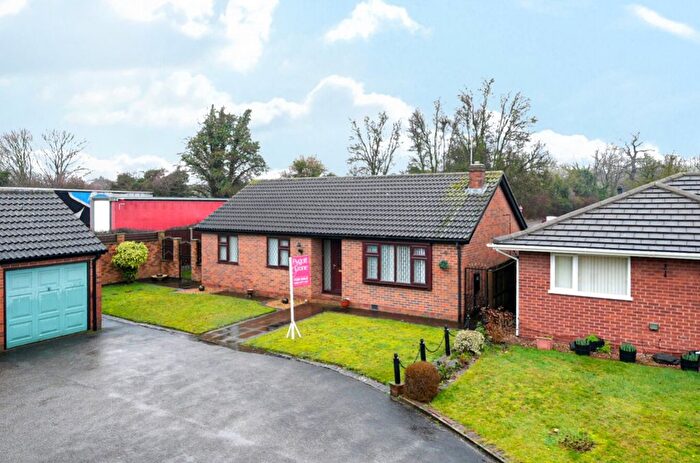
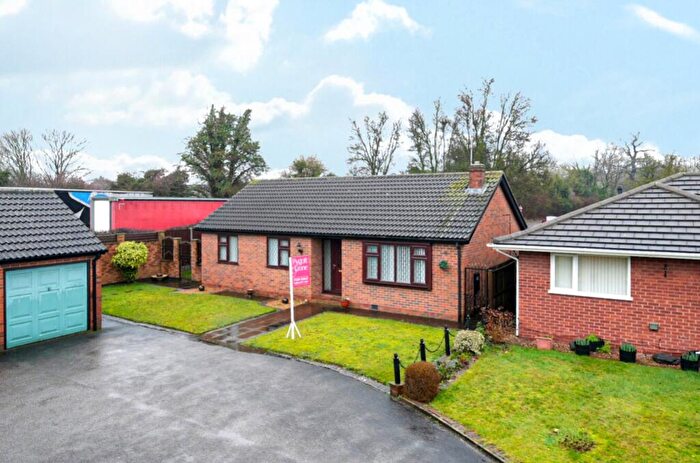
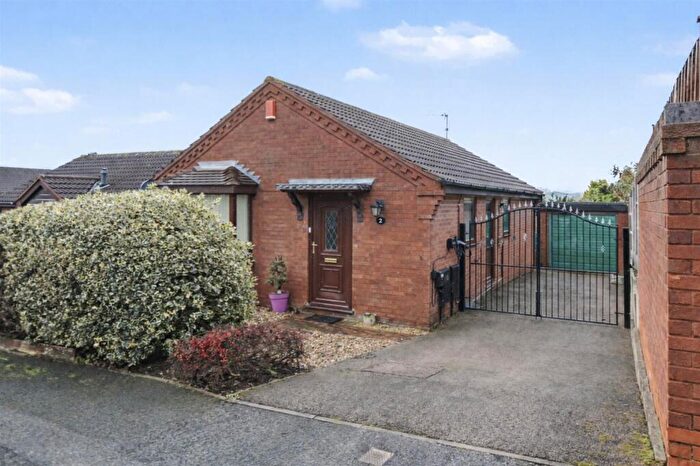
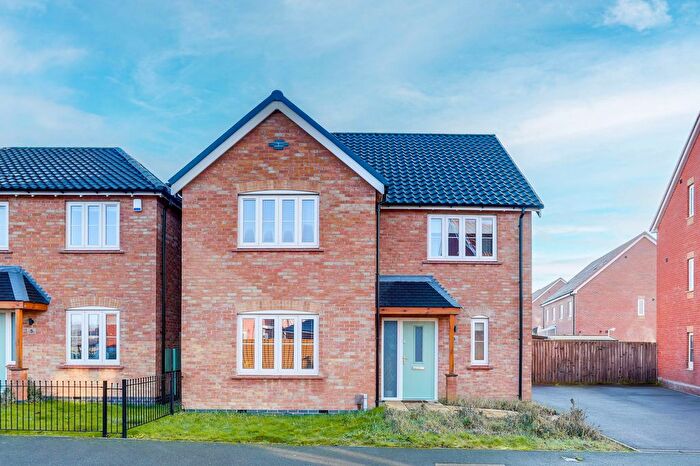
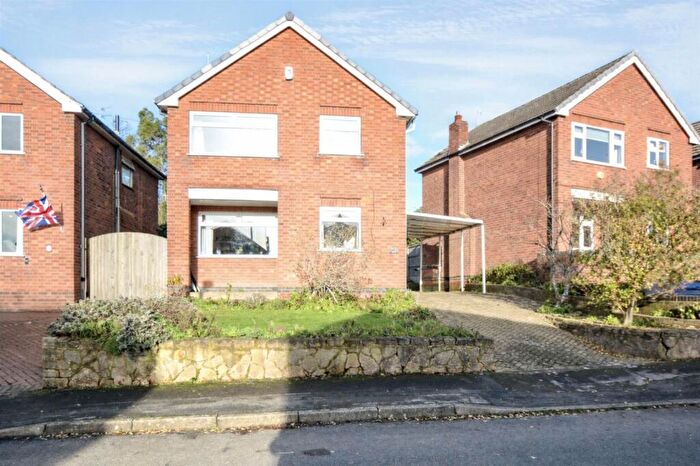
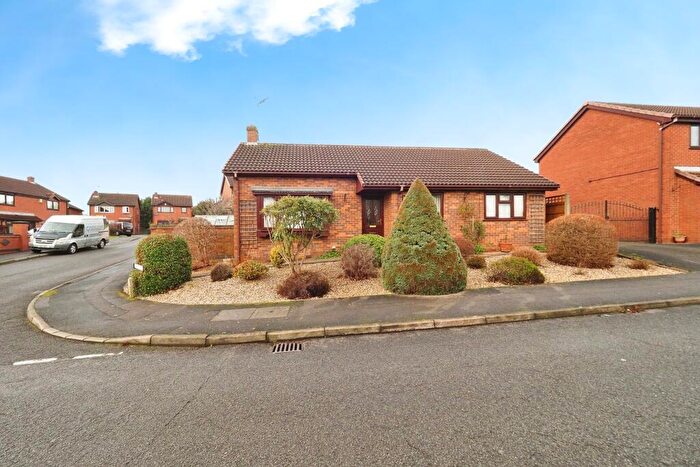
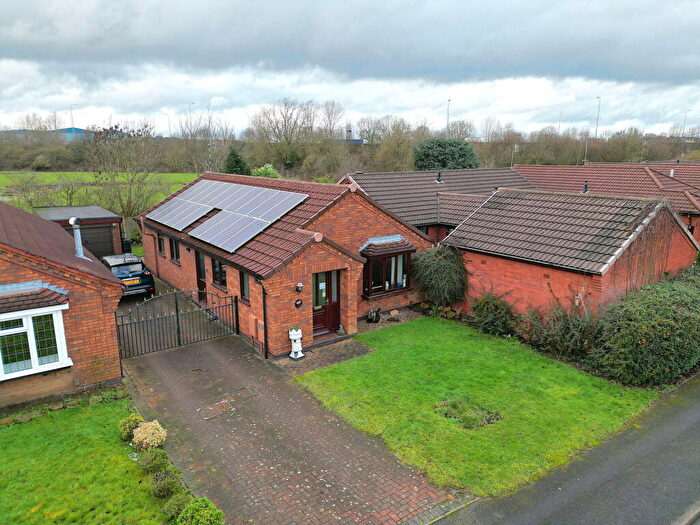
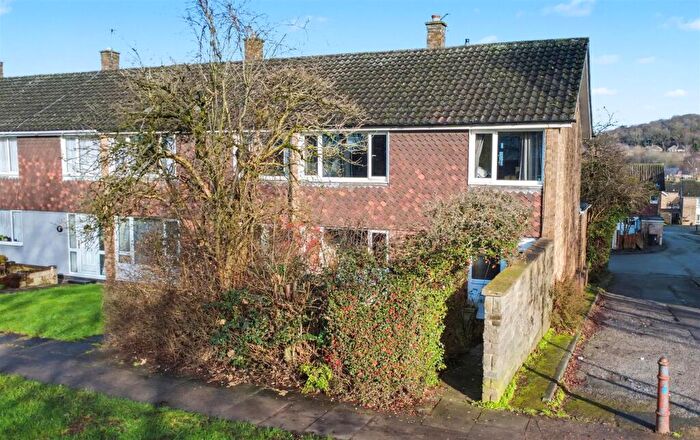
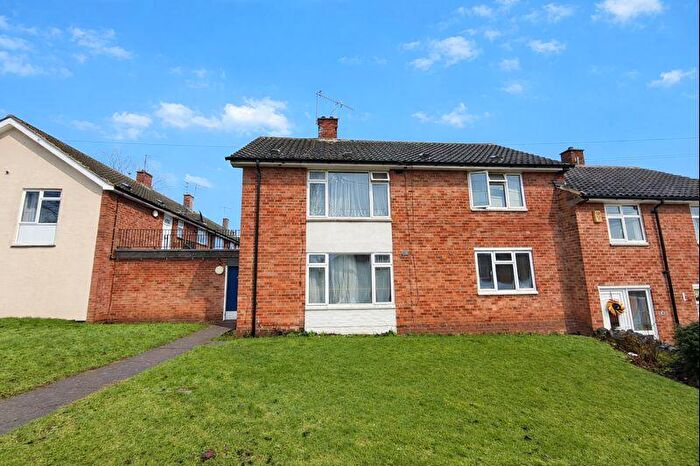
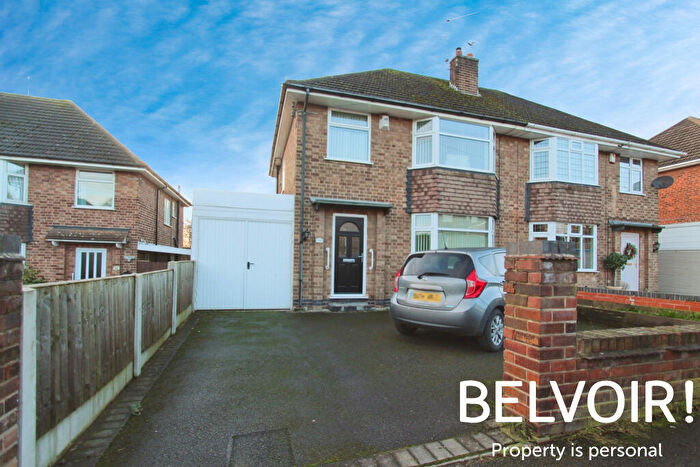
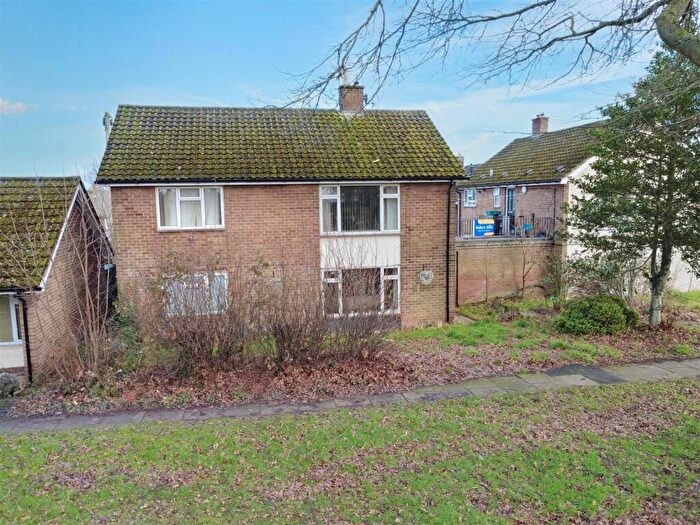
Houses for sale & to rent in Trowell, Nottingham
House Prices in Trowell
Properties in Trowell have an average house price of £273,686.00 and had 98 Property Transactions within the last 3 years¹.
Trowell is an area in Nottingham, Nottinghamshire with 989 households², where the most expensive property was sold for £600,000.00.
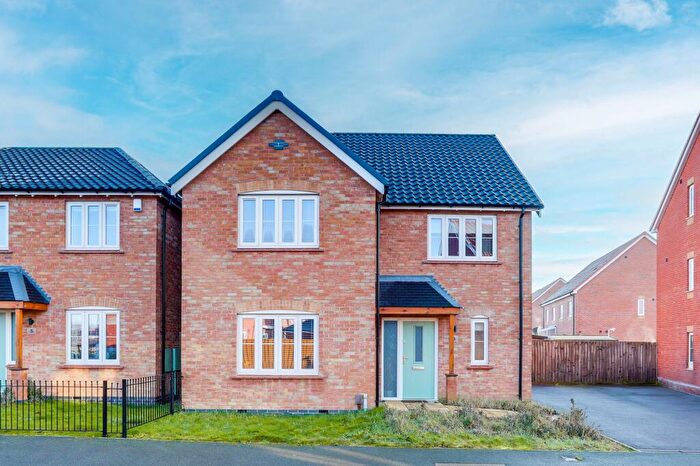
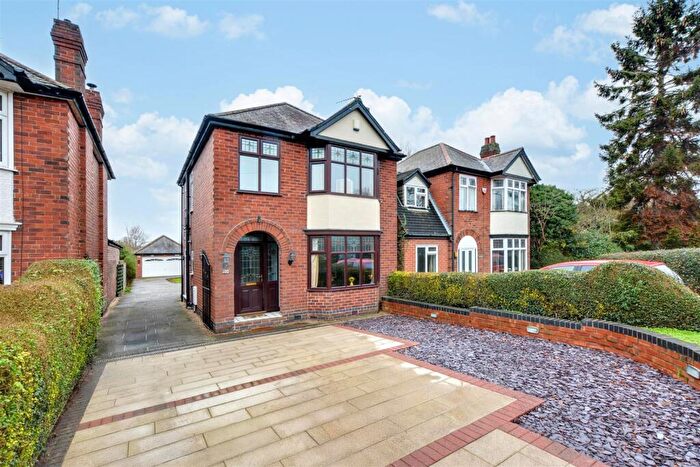
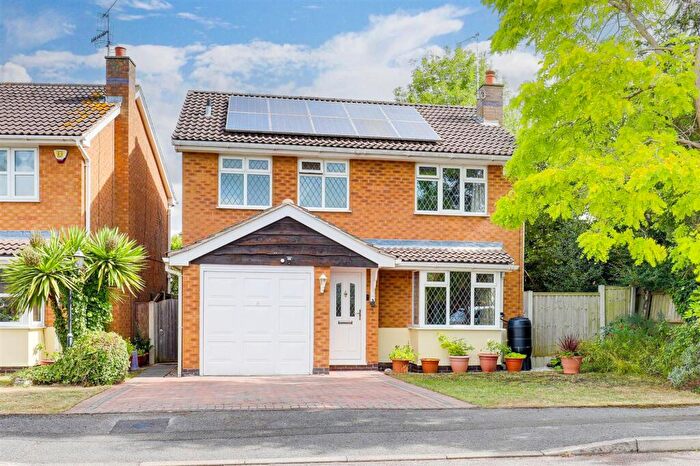
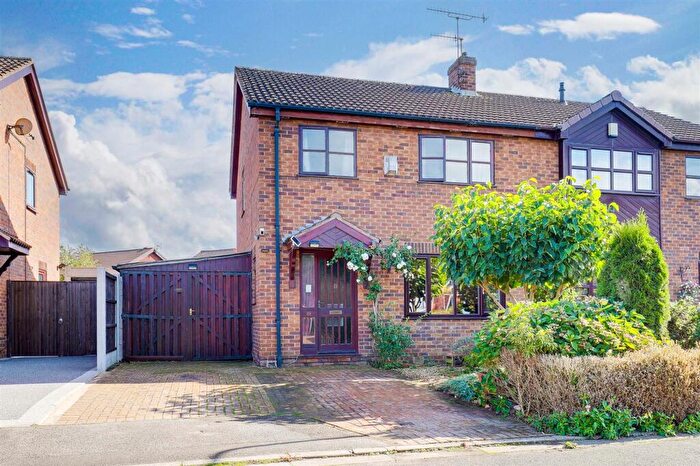
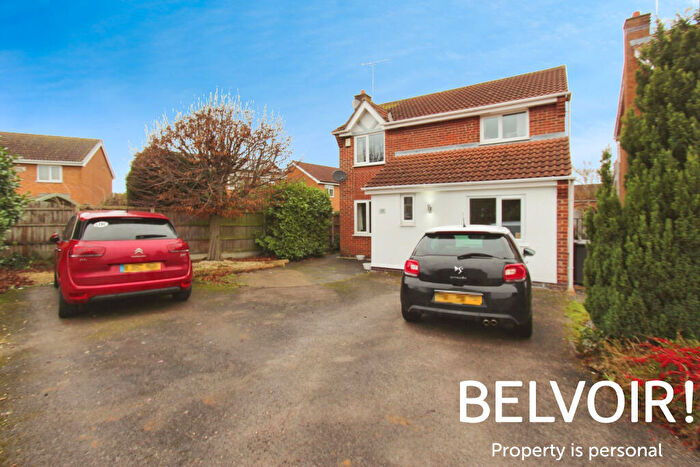
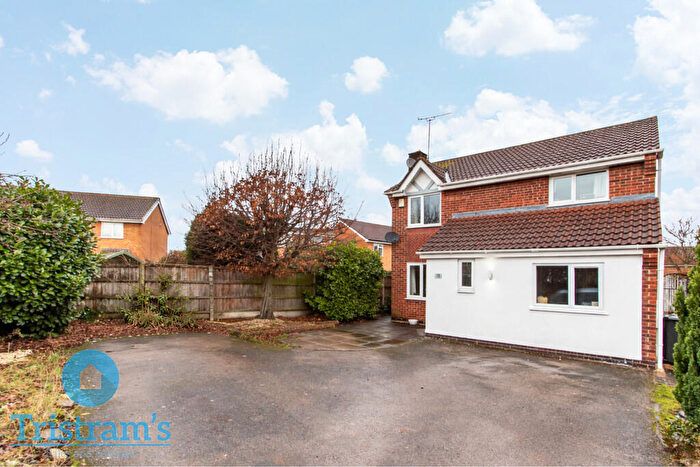
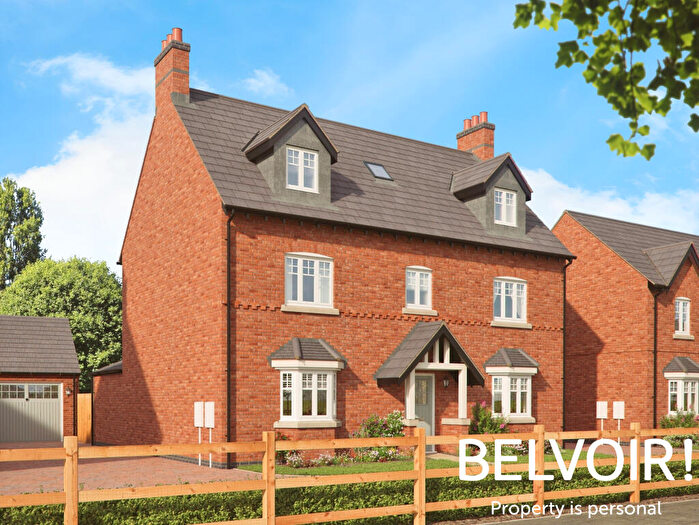
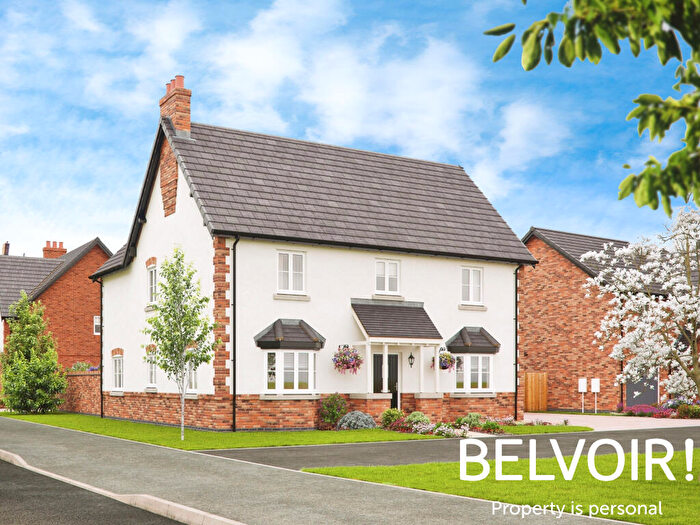
Properties for sale in Trowell
Roads and Postcodes in Trowell
Navigate through our locations to find the location of your next house in Trowell, Nottingham for sale or to rent.
| Streets | Postcodes |
|---|---|
| Barleydale Drive | NG9 3QS |
| Bilborough Road | NG8 4DR |
| Buttermead Close | NG9 3QT |
| Colonsay Close | NG9 3RD |
| Cossall Road | NG9 3PG |
| Cranbourne Close | NG9 3RH |
| Dawn View | NG9 3QU |
| Derbyshire Avenue | NG9 3QD |
| Ellesmere Drive | NG9 3PH |
| Festival Crescent | NG9 3SZ |
| Harvey Croft | NG9 3QW |
| Haynes Avenue | NG9 3NY |
| Hill Rise | NG9 3PE |
| Ilkeston Road | NG9 3PW NG9 3PX NG9 3PY |
| Iona Drive | NG9 3RF |
| Islay Close | NG9 3RE |
| Kingsmead Avenue | NG9 3QX |
| Needwood Avenue | NG9 3RJ |
| Northern Drive | NG9 3QL NG9 3QN |
| Nottingham Road | NG9 3PA NG9 3PB NG9 3PF NG9 3PJ NG9 3PN NG9 3PP |
| Pembrey Close | NG9 3RW |
| Roehampton Drive | NG9 3QY |
| Rothbury Avenue | NG9 3RQ |
| Salcey Drive | NG9 3RN |
| Smithfield Avenue | NG9 3PD |
| Springdale Gardens | NG9 3QZ |
| St Helens Crescent | NG9 3PZ |
| Stapleford Road | NG9 3QA NG9 3QE NG9 3QF NG9 3QG |
| Stoney Lane | NG9 3NZ |
| Tiree Close | NG9 3RG |
| Trowell Grove | NG9 3QH NG9 3QJ |
| Trowell Moor | NG9 3PQ |
| Trowell Park Drive | NG9 3RA |
| Waterloo Lane | NG9 3QQ |
| Windsor Close | NG9 3PU |
| Wortley Avenue | NG9 3QP |
| Wychwood Drive | NG9 3RB |
Transport near Trowell
- FAQ
- Price Paid By Year
- Property Type Price
Frequently asked questions about Trowell
What is the average price for a property for sale in Trowell?
The average price for a property for sale in Trowell is £273,686. This amount is 3% lower than the average price in Nottingham. There are 517 property listings for sale in Trowell.
What streets have the most expensive properties for sale in Trowell?
The streets with the most expensive properties for sale in Trowell are Nottingham Road at an average of £399,166, Pembrey Close at an average of £385,000 and Buttermead Close at an average of £340,000.
What streets have the most affordable properties for sale in Trowell?
The streets with the most affordable properties for sale in Trowell are Trowell Grove at an average of £191,900, Wortley Avenue at an average of £192,332 and Kingsmead Avenue at an average of £210,000.
Which train stations are available in or near Trowell?
Some of the train stations available in or near Trowell are Ilkeston, Beeston and Attenborough.
Property Price Paid in Trowell by Year
The average sold property price by year was:
| Year | Average Sold Price | Price Change |
Sold Properties
|
|---|---|---|---|
| 2025 | £275,271 | 1% |
35 Properties |
| 2024 | £271,433 | -1% |
30 Properties |
| 2023 | £274,052 | -4% |
33 Properties |
| 2022 | £284,861 | 3% |
40 Properties |
| 2021 | £276,407 | 12% |
53 Properties |
| 2020 | £242,481 | 6% |
25 Properties |
| 2019 | £227,194 | 6% |
50 Properties |
| 2018 | £213,483 | 9% |
56 Properties |
| 2017 | £193,746 | -10% |
38 Properties |
| 2016 | £212,487 | 17% |
36 Properties |
| 2015 | £175,343 | -3% |
45 Properties |
| 2014 | £180,469 | 17% |
33 Properties |
| 2013 | £150,514 | -7% |
38 Properties |
| 2012 | £161,070 | 8% |
27 Properties |
| 2011 | £147,920 | -18% |
25 Properties |
| 2010 | £174,289 | 16% |
19 Properties |
| 2009 | £146,761 | -12% |
21 Properties |
| 2008 | £163,760 | 0,4% |
15 Properties |
| 2007 | £163,072 | -3% |
49 Properties |
| 2006 | £168,505 | 2% |
39 Properties |
| 2005 | £165,849 | 7% |
28 Properties |
| 2004 | £153,614 | 4% |
44 Properties |
| 2003 | £146,746 | 17% |
42 Properties |
| 2002 | £122,273 | 25% |
42 Properties |
| 2001 | £91,767 | 10% |
49 Properties |
| 2000 | £82,959 | 1% |
63 Properties |
| 1999 | £82,304 | 13% |
52 Properties |
| 1998 | £71,997 | 10% |
51 Properties |
| 1997 | £64,451 | 14% |
51 Properties |
| 1996 | £55,620 | -10% |
50 Properties |
| 1995 | £61,255 | - |
37 Properties |
Property Price per Property Type in Trowell
Here you can find historic sold price data in order to help with your property search.
The average Property Paid Price for specific property types in the last three years are:
| Property Type | Average Sold Price | Sold Properties |
|---|---|---|
| Semi Detached House | £227,430.00 | 43 Semi Detached Houses |
| Detached House | £314,553.00 | 52 Detached Houses |
| Terraced House | £228,316.00 | 3 Terraced Houses |

