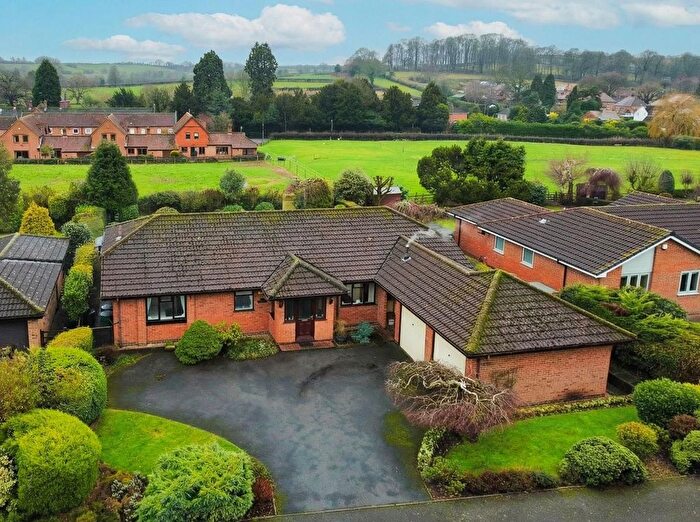
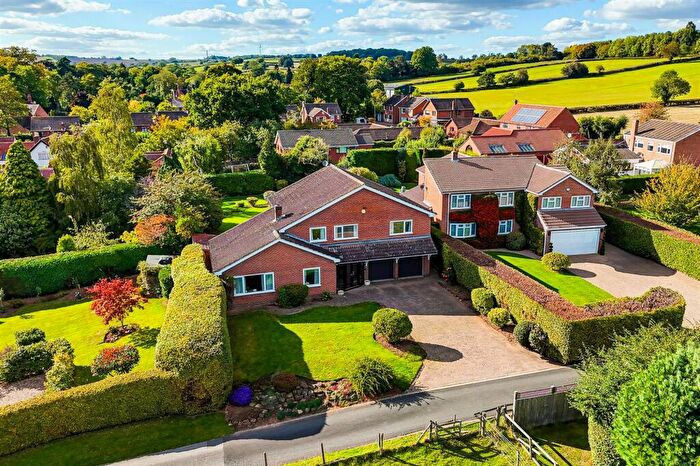
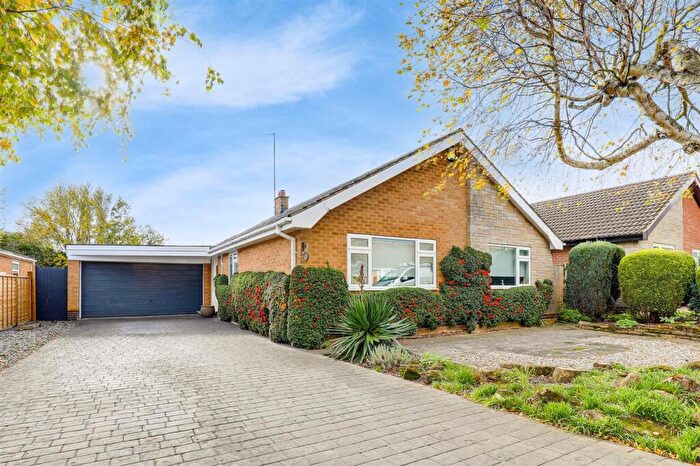
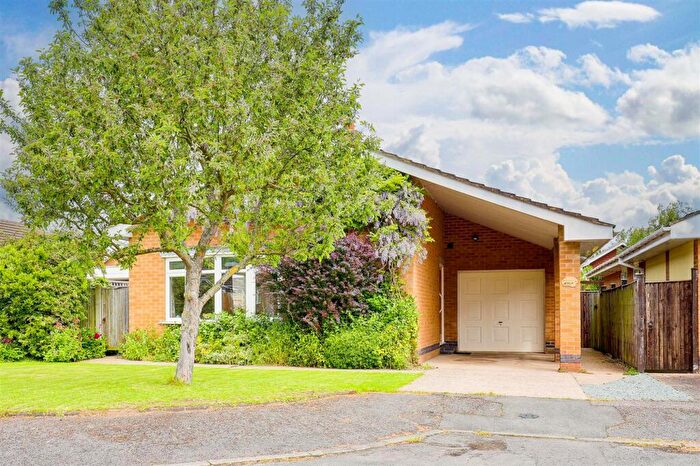
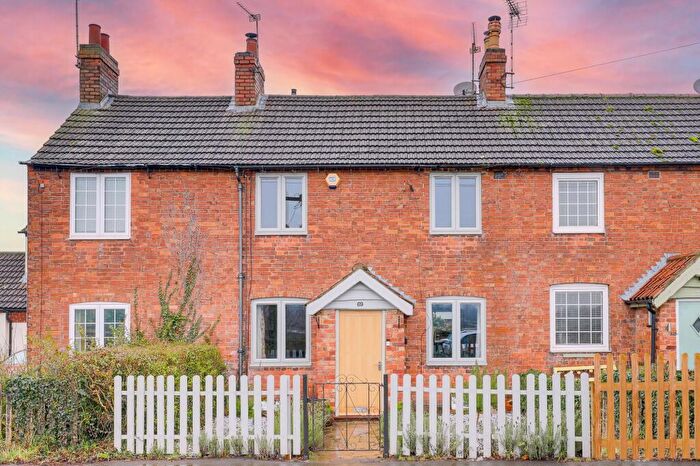
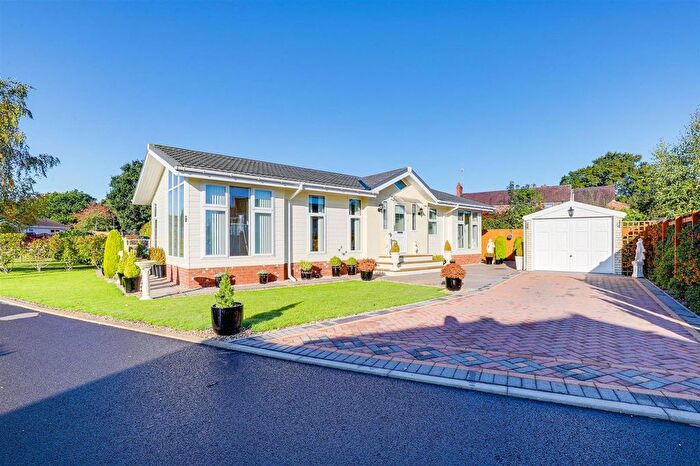
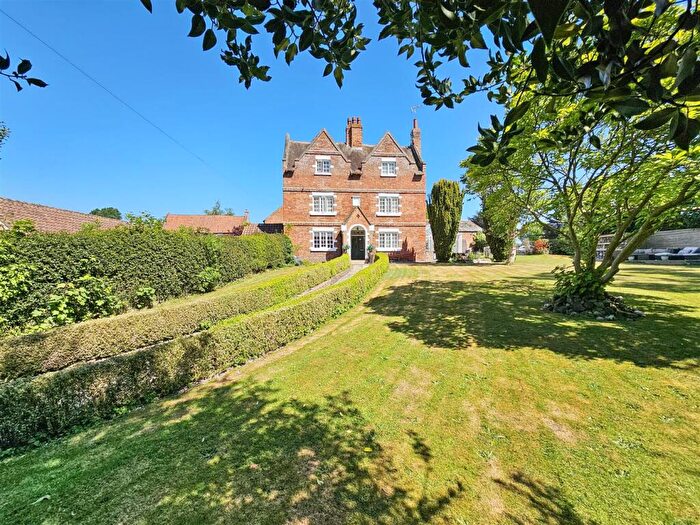
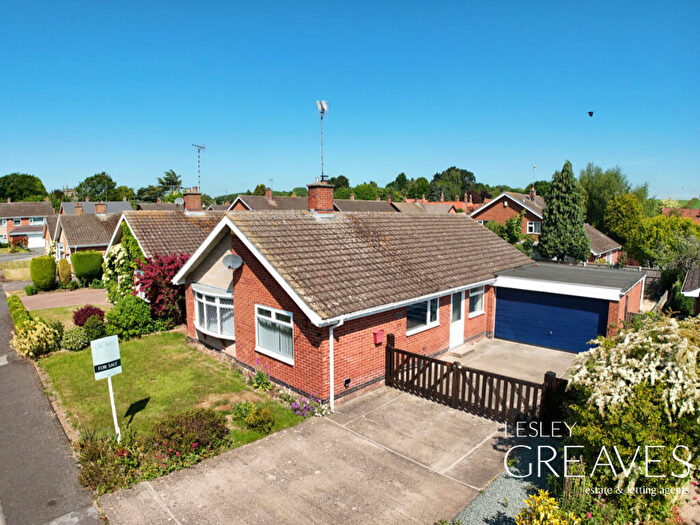
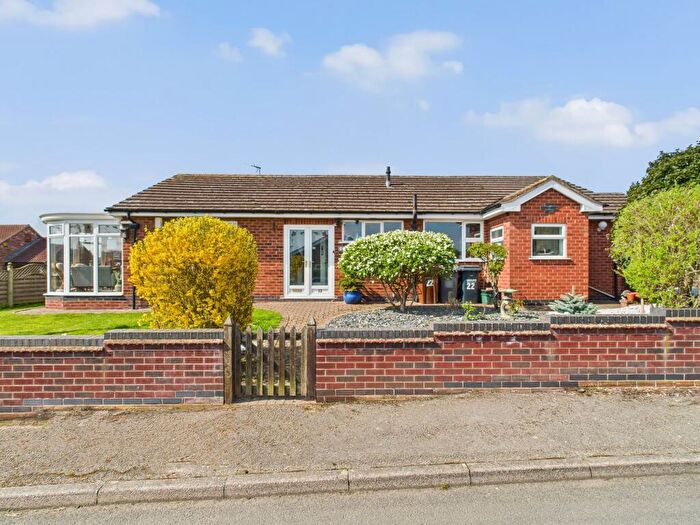
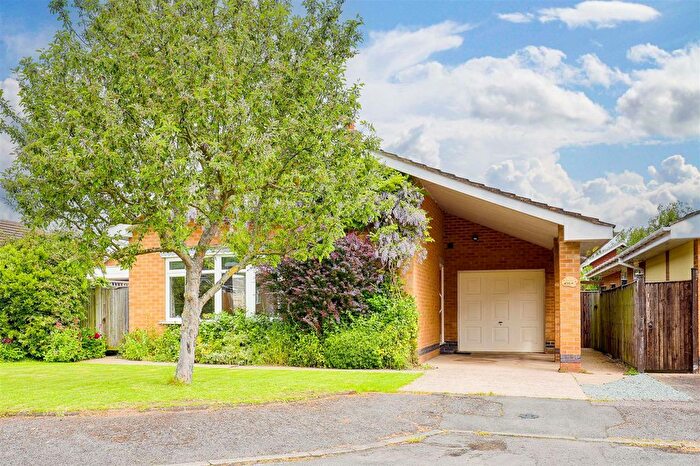
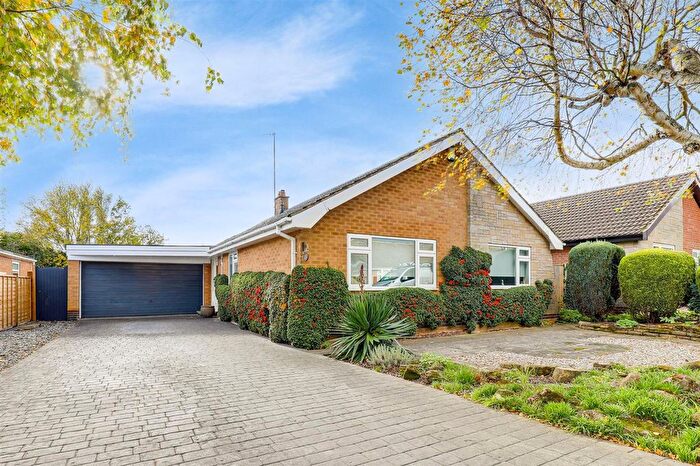
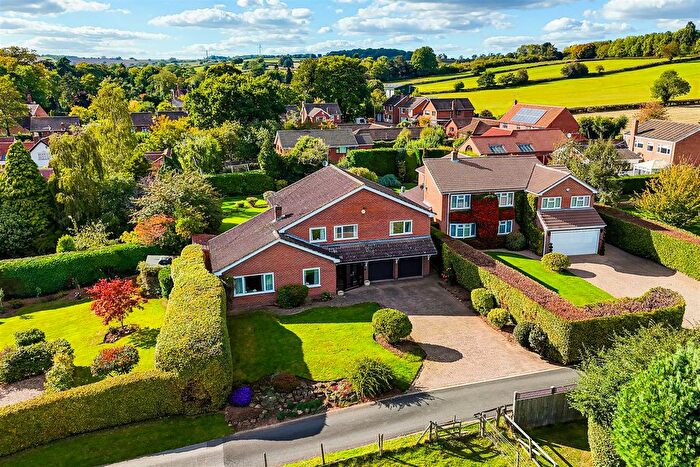
Houses for sale & to rent in Woodborough, Nottingham
House Prices in Woodborough
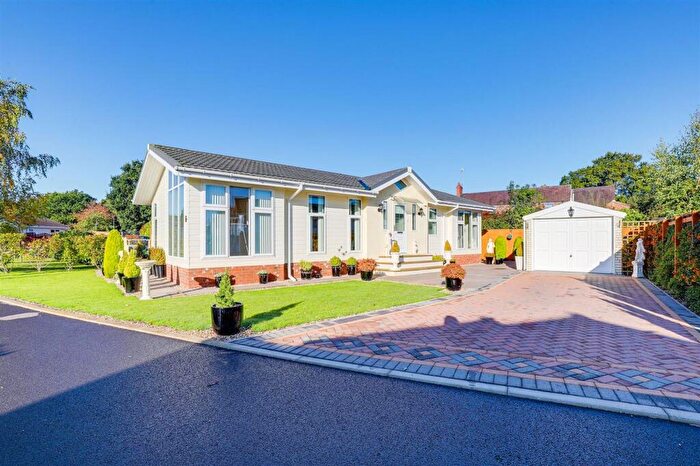
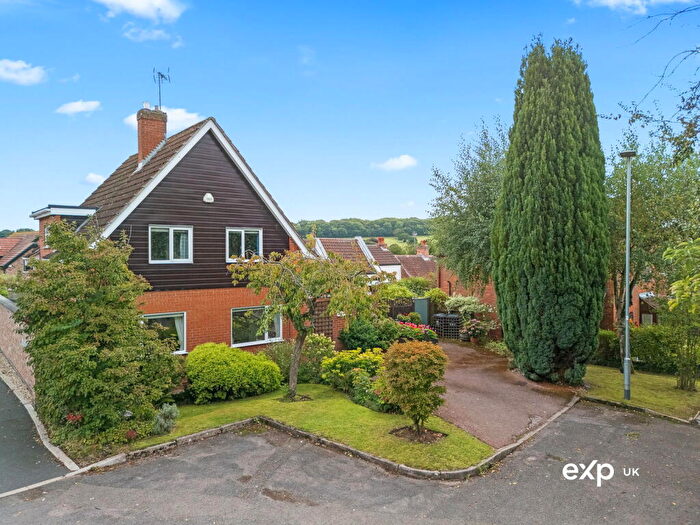
Properties in Woodborough have an average house price of £471,577.00 and had 62 Property Transactions within the last 3 years¹.
Woodborough is an area in Nottingham, Nottinghamshire with 703 households², where the most expensive property was sold for £920,000.00.
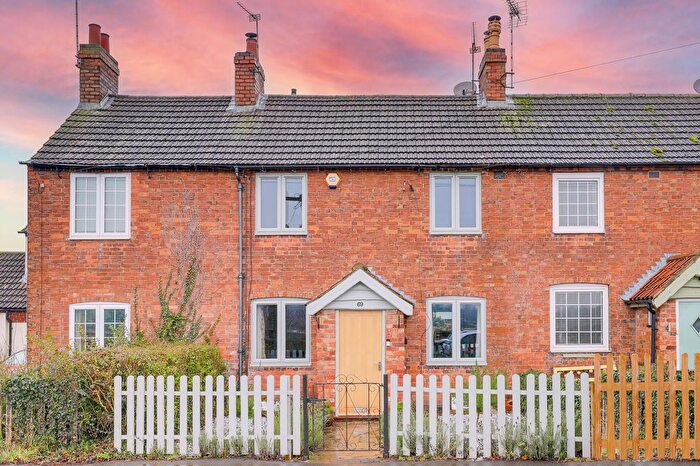
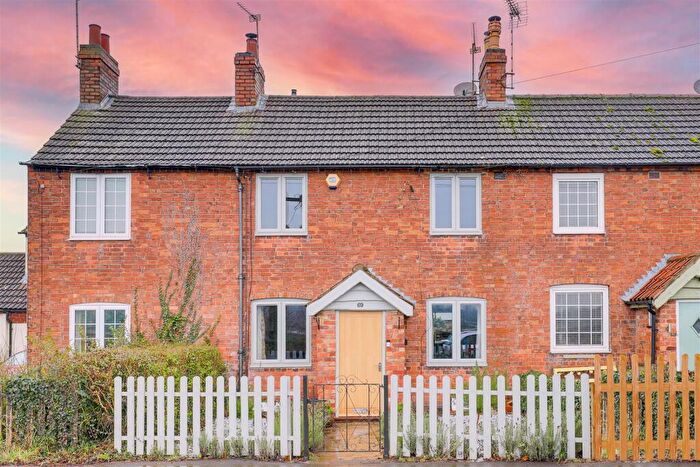
Properties for sale in Woodborough
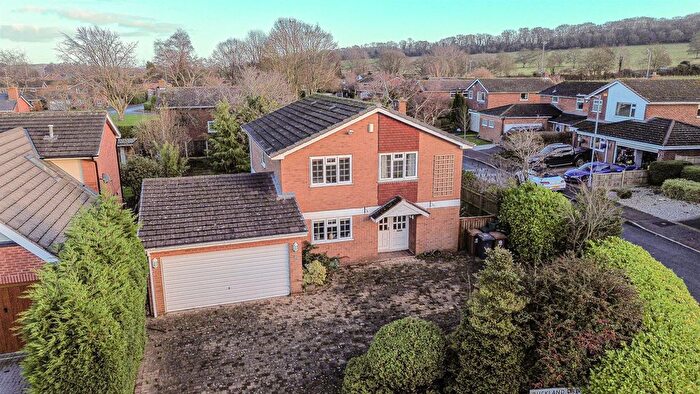
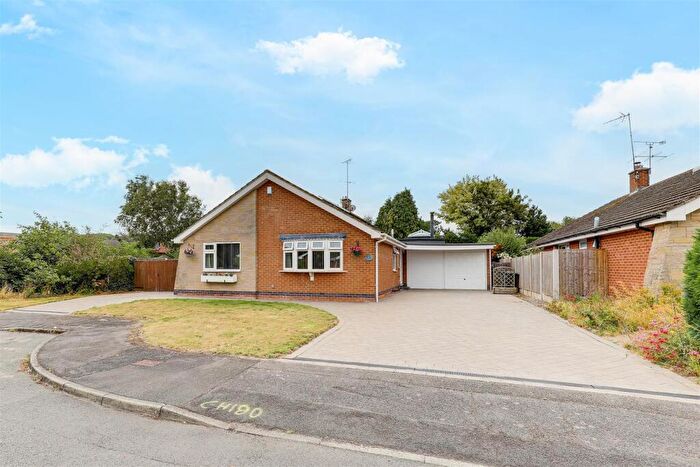
Previously listed properties in Woodborough
Roads and Postcodes in Woodborough
Navigate through our locations to find the location of your next house in Woodborough, Nottingham for sale or to rent.
| Streets | Postcodes |
|---|---|
| Aldene Way | NG14 6ET |
| Ash Grove | NG14 6DR |
| Bank Hill | NG14 6EF |
| Broad Close | NG14 6BY |
| Buckland Drive | NG14 6EU |
| Charnwood Way | NG14 6EW |
| Church Walk | NG14 6DB |
| Dover Beck Drive | NG14 6ER |
| Epperstone By Pass | NG14 6DH |
| Field Lane | NG14 6DU |
| Foxwood Lane | NG14 6ED |
| Holme Close | NG14 6EX |
| Lingwood Lane | NG14 6DX |
| Lowdham Lane | NG14 6DL NG14 6DN |
| Main Street | NG14 6DA NG14 6DD NG14 6EA |
| Moor Lane | NG14 6FZ |
| Old Acres | NG14 6ES |
| Old Manor Close | NG14 6DJ |
| Park Avenue | NG14 6EB |
| Pinfold Close | NG14 6DP |
| Pinfold Crescent | NG14 6DQ |
| Ploughman Avenue | NG14 6DE |
| Private Road | NG14 6DW |
| Roe Hill | NG14 6DS |
| Roe Lane | NG14 6DT |
| Shelt Hill | NG14 6DF NG14 6DG |
| Smalls Croft | NG14 6EY |
| Smithy Close | NG14 6RX |
| Sunningdale Drive | NG14 6EQ |
| Taylors Croft | NG14 6BX |
| The Meadows | NG14 6EJ |
| Westfield Lane | NG14 6EP |
| Whites Croft | NG14 6DZ |
| NG14 6EE |
Transport near Woodborough
-
Lowdham Station
-
Burton Joyce Station
-
Thurgarton Station
-
Carlton Station
-
Netherfield Station
-
Bleasby Station
- FAQ
- Price Paid By Year
- Property Type Price
Frequently asked questions about Woodborough
What is the average price for a property for sale in Woodborough?
The average price for a property for sale in Woodborough is £471,577. This amount is 67% higher than the average price in Nottingham. There are 131 property listings for sale in Woodborough.
What streets have the most expensive properties for sale in Woodborough?
The streets with the most expensive properties for sale in Woodborough are Private Road at an average of £656,666, Broad Close at an average of £647,500 and Main Street at an average of £535,611.
What streets have the most affordable properties for sale in Woodborough?
The streets with the most affordable properties for sale in Woodborough are Church Walk at an average of £210,000, Roe Lane at an average of £235,000 and Moor Lane at an average of £312,500.
Which train stations are available in or near Woodborough?
Some of the train stations available in or near Woodborough are Lowdham, Burton Joyce and Thurgarton.
Property Price Paid in Woodborough by Year
The average sold property price by year was:
| Year | Average Sold Price | Price Change |
Sold Properties
|
|---|---|---|---|
| 2025 | £472,813 | 7% |
15 Properties |
| 2024 | £440,631 | -14% |
24 Properties |
| 2023 | £503,063 | -18% |
23 Properties |
| 2022 | £594,473 | 25% |
19 Properties |
| 2021 | £446,650 | 22% |
30 Properties |
| 2020 | £346,913 | -10% |
23 Properties |
| 2019 | £380,830 | -2% |
20 Properties |
| 2018 | £389,120 | 8% |
20 Properties |
| 2017 | £357,713 | 7% |
22 Properties |
| 2016 | £333,516 | -13% |
31 Properties |
| 2015 | £375,483 | 6% |
30 Properties |
| 2014 | £353,578 | 24% |
19 Properties |
| 2013 | £270,354 | -8% |
31 Properties |
| 2012 | £291,954 | -10% |
23 Properties |
| 2011 | £320,357 | 14% |
21 Properties |
| 2010 | £274,861 | -5% |
22 Properties |
| 2009 | £287,647 | 8% |
20 Properties |
| 2008 | £265,199 | -13% |
20 Properties |
| 2007 | £298,704 | 1% |
34 Properties |
| 2006 | £296,029 | -13% |
32 Properties |
| 2005 | £335,550 | 24% |
26 Properties |
| 2004 | £253,976 | -12% |
26 Properties |
| 2003 | £283,629 | 17% |
33 Properties |
| 2002 | £236,299 | 28% |
30 Properties |
| 2001 | £171,264 | 13% |
17 Properties |
| 2000 | £149,462 | -8% |
25 Properties |
| 1999 | £160,945 | 15% |
30 Properties |
| 1998 | £136,885 | 8% |
37 Properties |
| 1997 | £126,354 | 20% |
30 Properties |
| 1996 | £101,545 | 1% |
36 Properties |
| 1995 | £100,803 | - |
24 Properties |
Property Price per Property Type in Woodborough
Here you can find historic sold price data in order to help with your property search.
The average Property Paid Price for specific property types in the last three years are:
| Property Type | Average Sold Price | Sold Properties |
|---|---|---|
| Semi Detached House | £380,993.00 | 8 Semi Detached Houses |
| Detached House | £508,148.00 | 46 Detached Houses |
| Terraced House | £375,714.00 | 7 Terraced Houses |
| Flat | £185,000.00 | 1 Flat |

