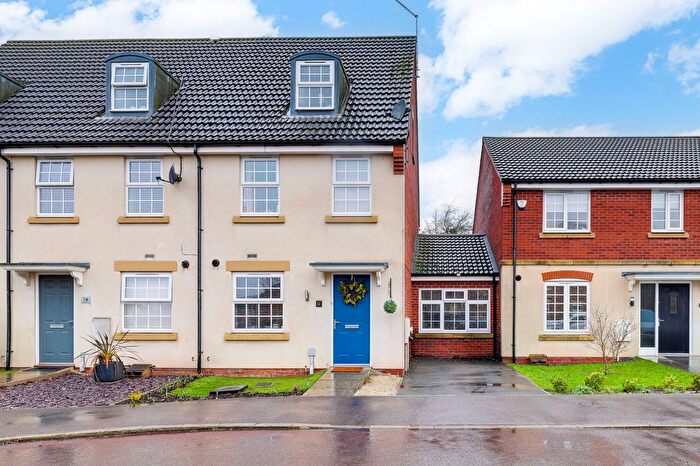
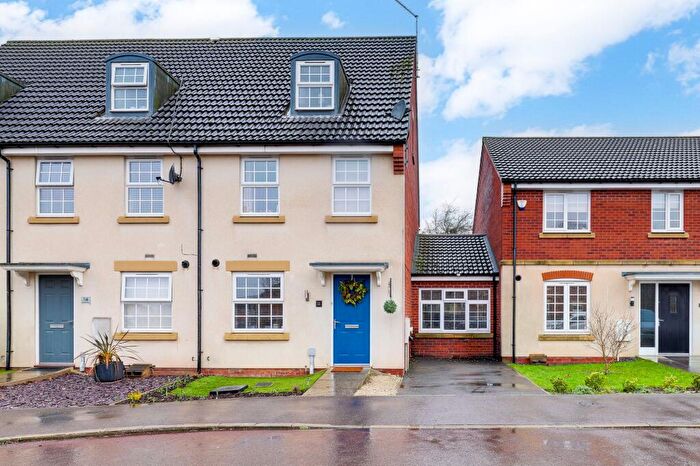
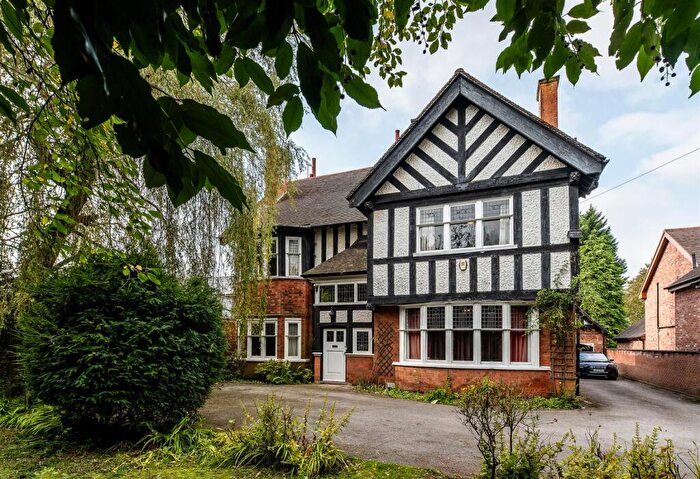
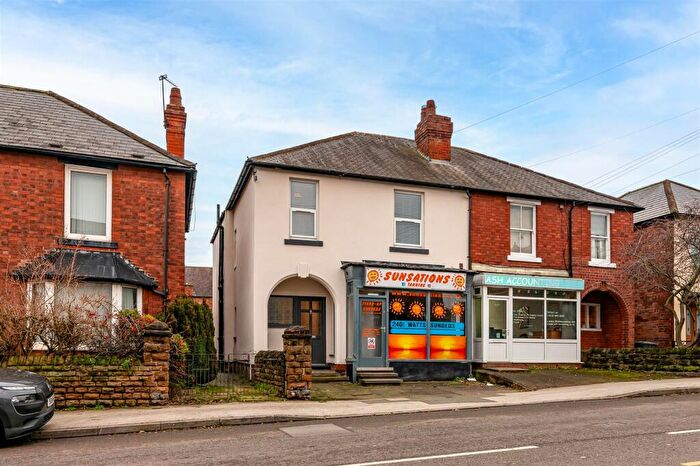
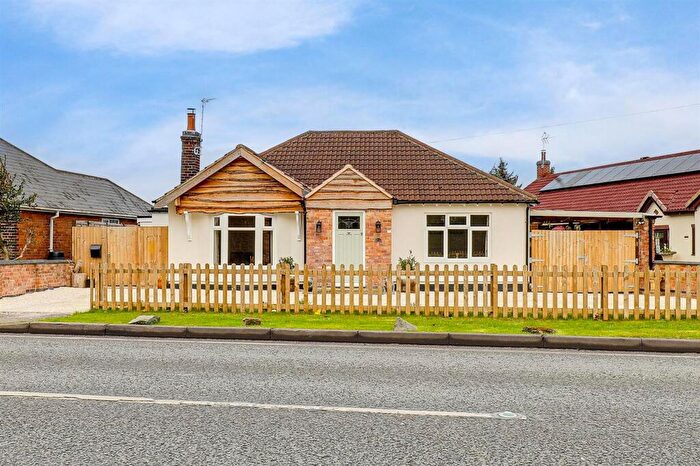
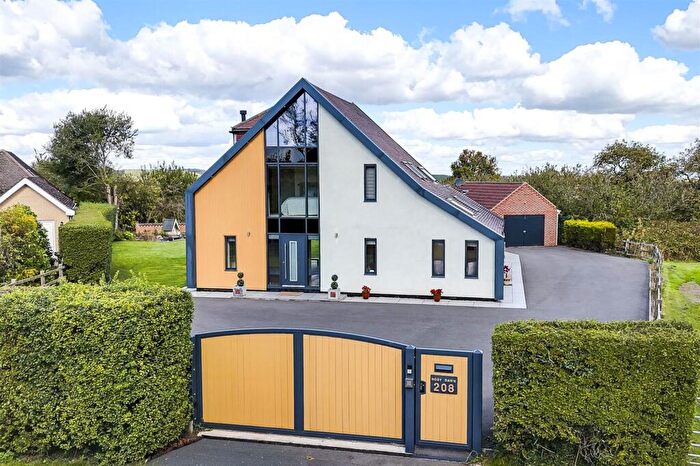
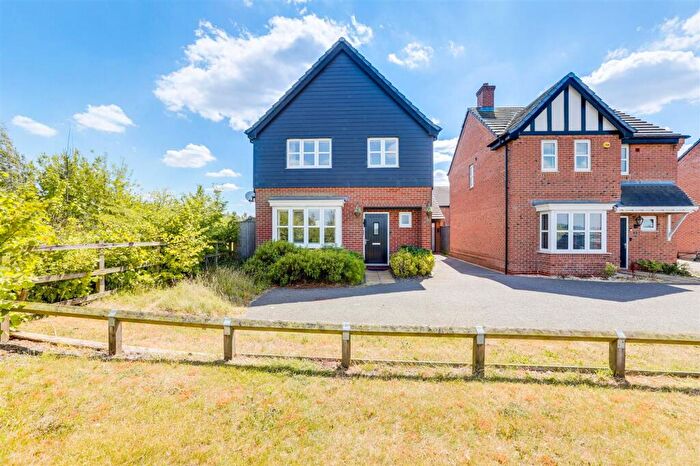
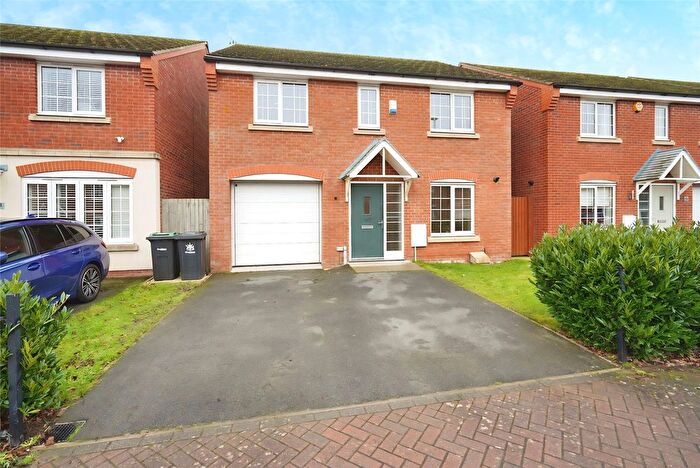
Houses for sale & to rent in Lambley, Nottingham
House Prices in Lambley
Properties in Lambley have an average house price of £356,831.00 and had 81 Property Transactions within the last 3 years¹.
Lambley is an area in Nottingham, Nottinghamshire with 896 households², where the most expensive property was sold for £865,000.00.
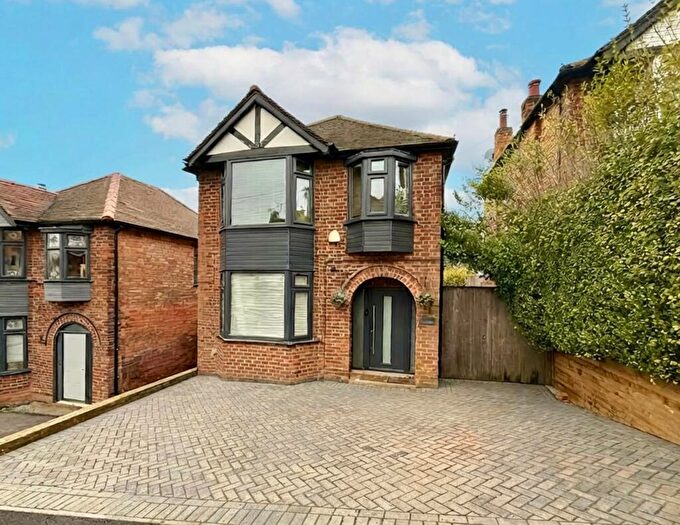
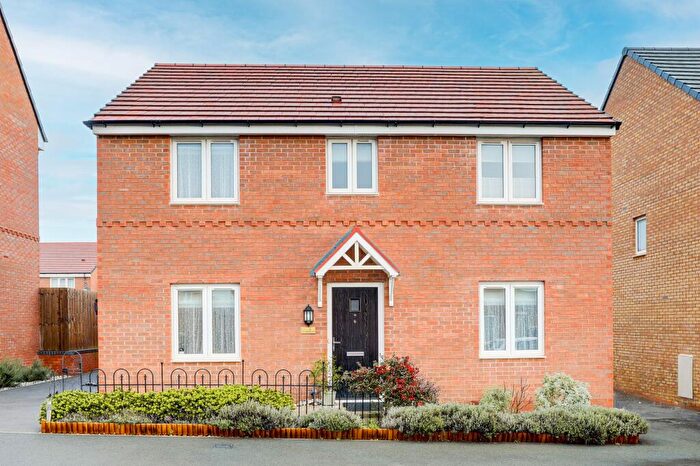
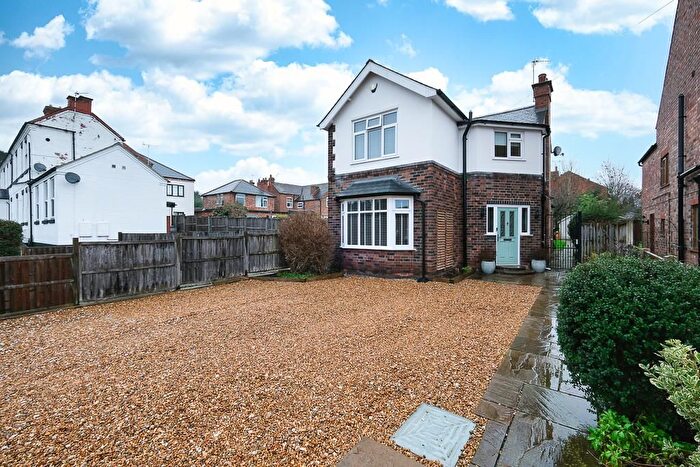
Properties for sale in Lambley
Roads and Postcodes in Lambley
Navigate through our locations to find the location of your next house in Lambley, Nottingham for sale or to rent.
| Streets | Postcodes |
|---|---|
| Ashwater Drive | NG3 5SJ |
| Barn Farm Cottages | NG14 6EH |
| Bideford Close | NG3 5UP |
| Bradstone Drive | NG3 5SY |
| Catfoot Lane | NG4 4QF NG4 4QG NG4 4QH |
| Chapel Lane | NG4 4PT |
| Chartwell Grove | NG3 5RD |
| Chedington Avenue | NG3 5SG |
| Church Street | NG4 4QB |
| Clovelly Drive | NG3 5NJ |
| Cocker Beck | NG4 4QP |
| Copplestone Drive | NG3 5SH |
| Cromwell Crescent | NG4 4PJ |
| Dawlish Close | NG3 5UR |
| Dunsford Drive | NG3 5SB |
| Flamstead Avenue | NG4 4PL |
| Grange Close | NG4 4QJ |
| Green Lane | NG4 4QE |
| Hatherleigh Close | NG3 5SF |
| Kingsbridge Avenue | NG3 5SA |
| Lapford Close | NG3 5SQ |
| Main Street | NG4 4PN NG4 4PP |
| Mapperley Plains | NG3 5RJ NG3 5RN NG3 5RT NG3 5SS |
| Mill Lane | NG4 4PS |
| Okehampton Crescent | NG3 5SE |
| Orchard Park | NG3 5SN |
| Orchard Rise | NG4 4PU |
| Park Lane | NG4 4PY NG4 4QA |
| Podder Lane | NG3 5RL |
| Ross Lane | NG4 4PQ |
| Sanderson Drive | NG3 5PB |
| Spencer Avenue | NG3 5SP |
| Spring Lane | NG3 5RQ NG3 5RR NG4 4PE NG4 4PG NG4 4PH |
| Steeles Way | NG4 4QN |
| The Dumbles | NG4 4QD |
| Thurlestone Drive | NG3 5SD |
| Trinity Crescent | NG4 4PX |
| Willow Crescent | NG4 4PW |
| Winston Close | NG3 5SR |
| Woolacombe Close | NG3 5SL |
Transport near Lambley
- FAQ
- Price Paid By Year
- Property Type Price
Frequently asked questions about Lambley
What is the average price for a property for sale in Lambley?
The average price for a property for sale in Lambley is £356,831. This amount is 26% higher than the average price in Nottingham. There are 2,640 property listings for sale in Lambley.
What streets have the most expensive properties for sale in Lambley?
The streets with the most expensive properties for sale in Lambley are Chartwell Grove at an average of £603,750, Church Street at an average of £553,750 and Winston Close at an average of £455,000.
What streets have the most affordable properties for sale in Lambley?
The streets with the most affordable properties for sale in Lambley are Dunsford Drive at an average of £219,333, Okehampton Crescent at an average of £219,583 and Flamstead Avenue at an average of £275,666.
Which train stations are available in or near Lambley?
Some of the train stations available in or near Lambley are Burton Joyce, Carlton and Netherfield.
Property Price Paid in Lambley by Year
The average sold property price by year was:
| Year | Average Sold Price | Price Change |
Sold Properties
|
|---|---|---|---|
| 2025 | £366,340 | -7% |
22 Properties |
| 2024 | £391,205 | 18% |
28 Properties |
| 2023 | £319,035 | 3% |
31 Properties |
| 2022 | £310,042 | -21% |
35 Properties |
| 2021 | £375,542 | 24% |
47 Properties |
| 2020 | £283,621 | -9% |
39 Properties |
| 2019 | £309,538 | 14% |
36 Properties |
| 2018 | £267,490 | 9% |
49 Properties |
| 2017 | £243,054 | -6% |
47 Properties |
| 2016 | £258,767 | -2% |
39 Properties |
| 2015 | £262,670 | 6% |
35 Properties |
| 2014 | £245,738 | 14% |
76 Properties |
| 2013 | £210,995 | -5% |
49 Properties |
| 2012 | £220,554 | -16% |
62 Properties |
| 2011 | £254,973 | 5% |
45 Properties |
| 2010 | £243,418 | 15% |
29 Properties |
| 2009 | £205,830 | -15% |
15 Properties |
| 2008 | £235,870 | 1% |
26 Properties |
| 2007 | £234,364 | 6% |
47 Properties |
| 2006 | £220,336 | 1% |
58 Properties |
| 2005 | £217,050 | -5% |
27 Properties |
| 2004 | £228,506 | 10% |
30 Properties |
| 2003 | £205,895 | 20% |
55 Properties |
| 2002 | £165,524 | 19% |
26 Properties |
| 2001 | £133,762 | 30% |
45 Properties |
| 2000 | £94,008 | -1% |
43 Properties |
| 1999 | £94,601 | 2% |
47 Properties |
| 1998 | £93,181 | -6% |
40 Properties |
| 1997 | £99,165 | 16% |
66 Properties |
| 1996 | £83,257 | -6% |
40 Properties |
| 1995 | £88,225 | - |
31 Properties |
Property Price per Property Type in Lambley
Here you can find historic sold price data in order to help with your property search.
The average Property Paid Price for specific property types in the last three years are:
| Property Type | Average Sold Price | Sold Properties |
|---|---|---|
| Semi Detached House | £305,970.00 | 17 Semi Detached Houses |
| Detached House | £427,236.00 | 48 Detached Houses |
| Terraced House | £211,769.00 | 13 Terraced Houses |
| Flat | £147,166.00 | 3 Flats |

