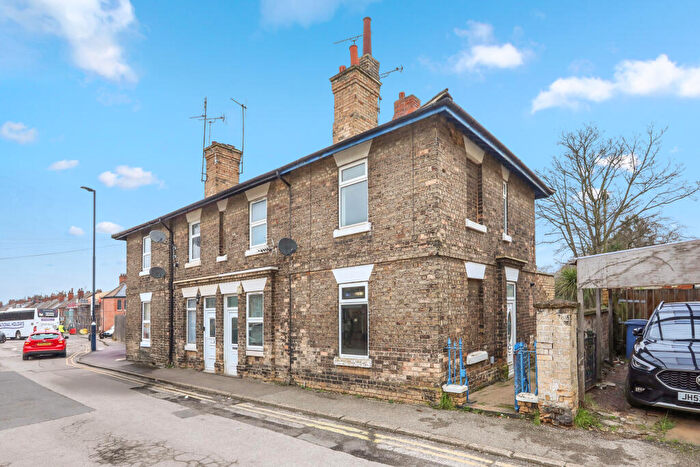
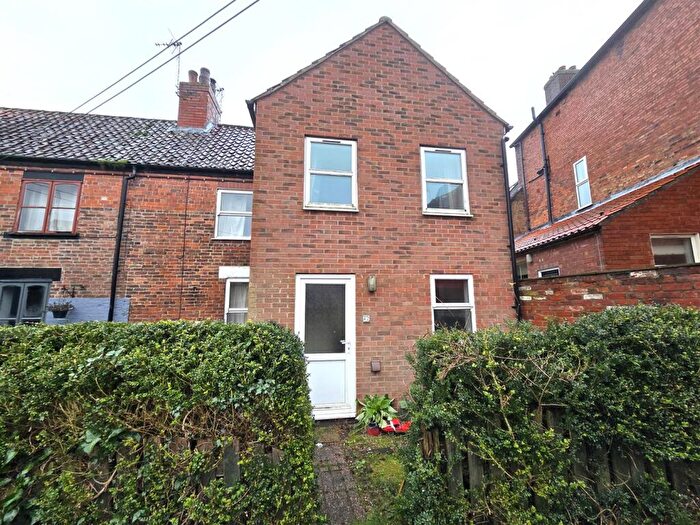
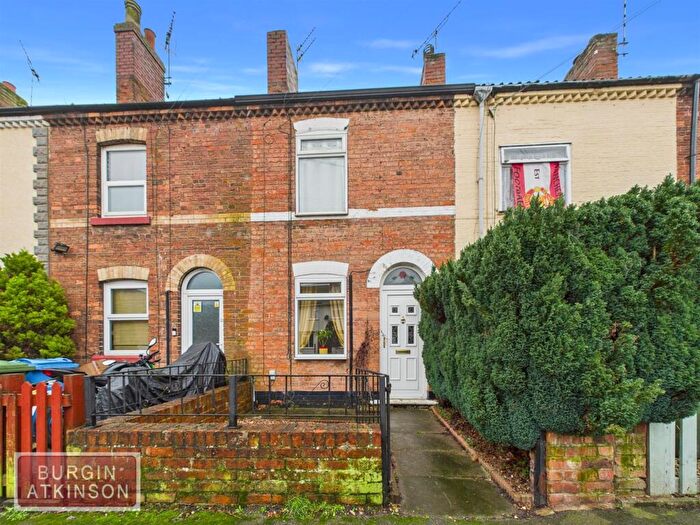
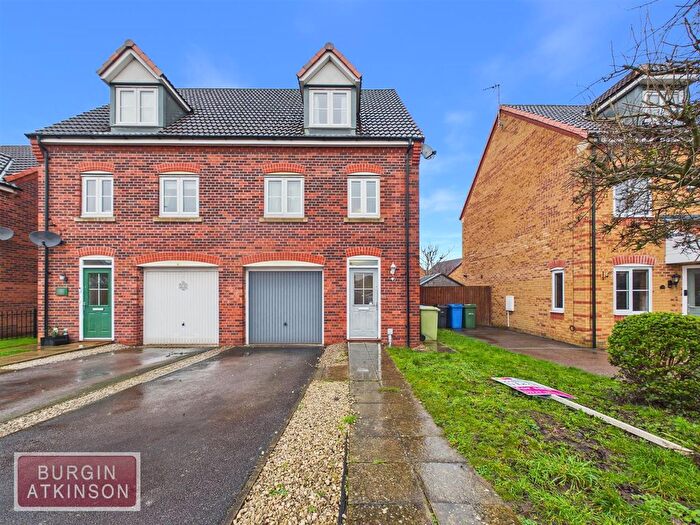
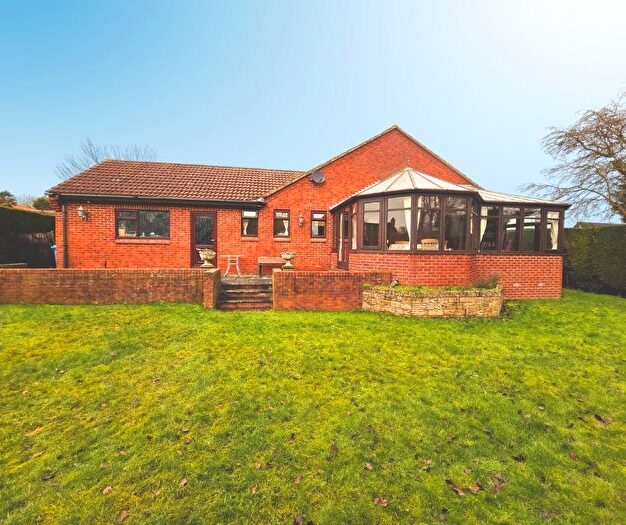
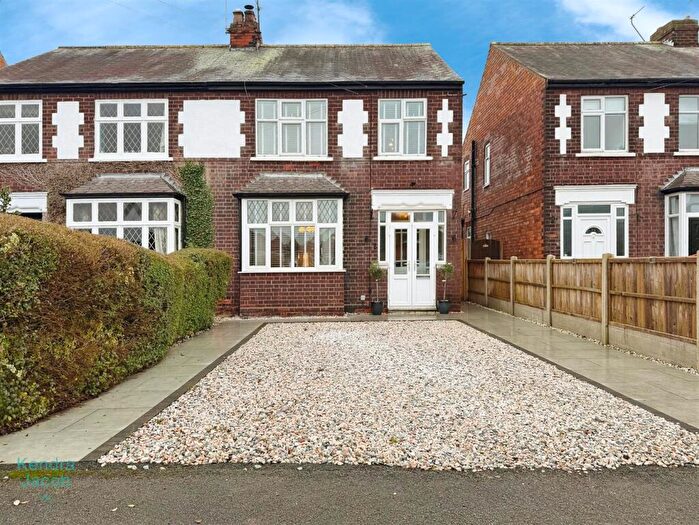
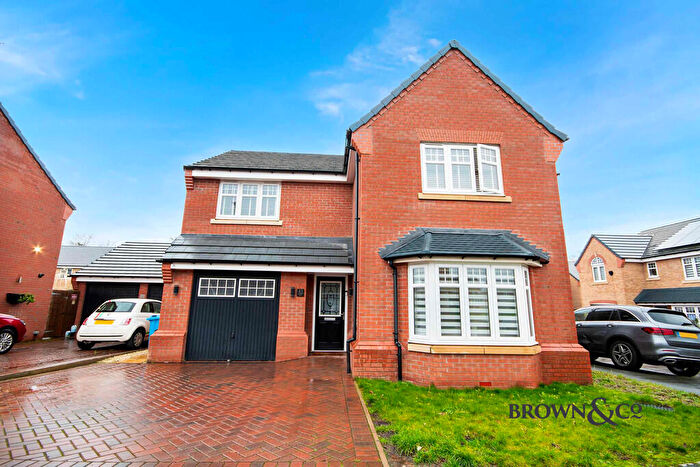
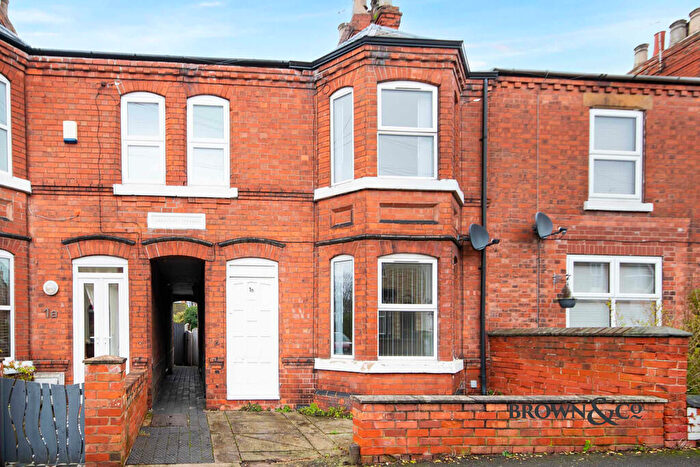
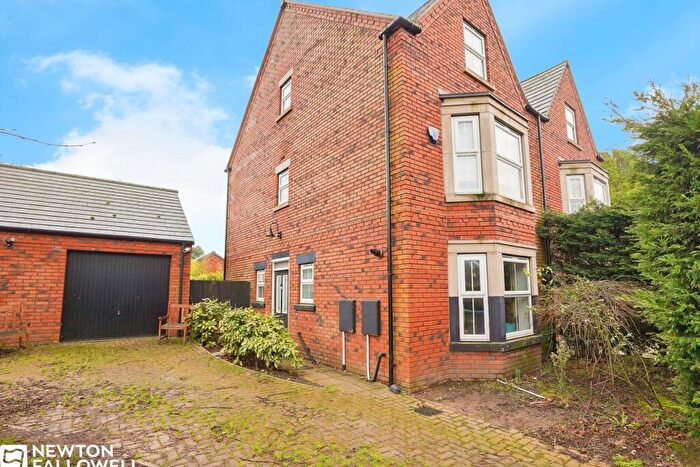
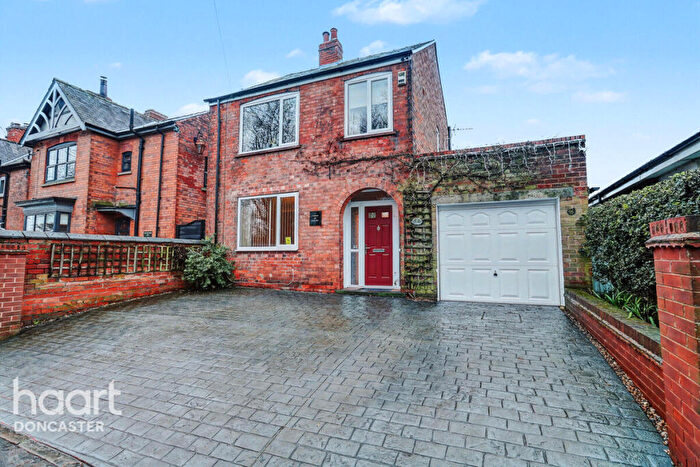
Houses for sale & to rent in East Markham, Retford
House Prices in East Markham
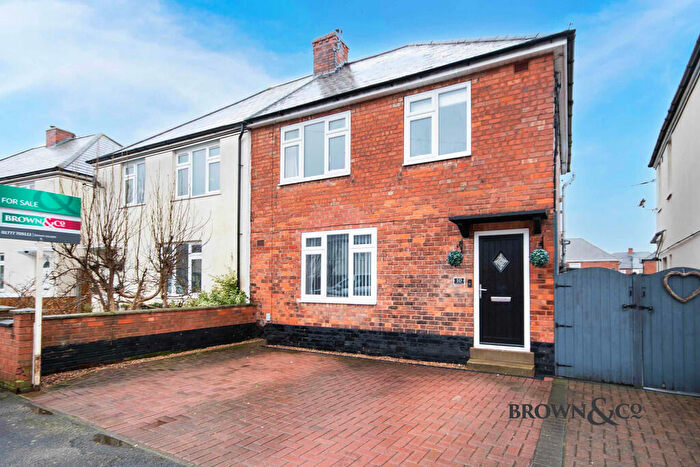
Properties in East Markham have an average house price of £328,537.00 and had 26 Property Transactions within the last 3 years¹.
East Markham is an area in Retford, Nottinghamshire with 342 households², where the most expensive property was sold for £770,000.00.
Properties for sale in East Markham
Roads and Postcodes in East Markham
Navigate through our locations to find the location of your next house in East Markham, Retford for sale or to rent.
| Streets | Postcodes |
|---|---|
| Chapel Drive | DN22 0PF |
| Church Lane | DN22 0QB DN22 8DN DN22 8EB |
| Clinton Rise | DN22 0QJ |
| Gamston | DN22 0QD DN22 0QH |
| Great North Road | DN22 0QS |
| Hather Close | DN22 0QF |
| Haughton Meadows | DN22 8DZ |
| Haughton Mill Cottages | DN22 8DY |
| Hillside View | DN22 8DU |
| Holme Lane | DN22 0QY |
| Lawson Close | DN22 8EE |
| Main Street | DN22 8DT DN22 8DW |
| Manor Close | DN22 0RP |
| Meadow Lane | DN22 8DS |
| Meden Bank | DN22 8DX |
| Mill Lane | DN22 0QP |
| Old London Road | DN22 8ED DN22 0TE |
| Rectory Lane | DN22 0QG DN22 0QQ |
| Rectory Walk | DN22 0QE |
| Stanboard Lane | DN22 0PE |
| The Avenue | DN22 8DD |
| Woodyard Lane | DN22 0FY |
| Yew Tree Close | DN22 0FZ DN22 0PZ |
| DN22 0PS DN22 0PY DN22 0QA DN22 0QN DN22 0QR DN22 0QT DN22 0QU DN22 0QW DN22 8BL DN22 8DF DN22 8DH DN22 0PG DN22 0PP DN22 0PR DN22 0PT DN22 0PX DN22 0QX DN22 0QZ DN22 0RB DN22 0RU DN22 8DB DN22 8DG DN22 8DP DN22 8DQ DN22 8EA |
Transport near East Markham
-
Retford Station
-
Worksop Station
-
Shireoaks Station
-
Whitwell (Derbys) Station
-
Gainsborough Lea Road Station
-
Langwith Station
-
Creswell (Derbys) Station
-
Shirebrook (Derbys) Station
-
Gainsborough Central Station
-
Saxilby Station
- FAQ
- Price Paid By Year
- Property Type Price
Frequently asked questions about East Markham
What is the average price for a property for sale in East Markham?
The average price for a property for sale in East Markham is £328,537. This amount is 45% higher than the average price in Retford. There are 3,704 property listings for sale in East Markham.
What streets have the most expensive properties for sale in East Markham?
The streets with the most expensive properties for sale in East Markham are Haughton Meadows at an average of £750,000, Great North Road at an average of £572,500 and Main Street at an average of £452,500.
What streets have the most affordable properties for sale in East Markham?
The streets with the most affordable properties for sale in East Markham are Lawson Close at an average of £121,000, Mill Lane at an average of £130,472 and Church Lane at an average of £188,750.
Which train stations are available in or near East Markham?
Some of the train stations available in or near East Markham are Retford, Worksop and Shireoaks.
Property Price Paid in East Markham by Year
The average sold property price by year was:
| Year | Average Sold Price | Price Change |
Sold Properties
|
|---|---|---|---|
| 2025 | £246,620 | -55% |
8 Properties |
| 2024 | £381,944 | 9% |
9 Properties |
| 2023 | £347,944 | -4% |
9 Properties |
| 2022 | £362,600 | -8% |
5 Properties |
| 2021 | £391,666 | -48% |
9 Properties |
| 2020 | £581,071 | 45% |
7 Properties |
| 2019 | £318,921 | 8% |
11 Properties |
| 2018 | £293,611 | 22% |
9 Properties |
| 2017 | £227,722 | -42% |
9 Properties |
| 2016 | £322,300 | 32% |
10 Properties |
| 2015 | £220,466 | -6% |
15 Properties |
| 2014 | £232,750 | 14% |
10 Properties |
| 2013 | £201,118 | -92% |
8 Properties |
| 2012 | £385,750 | 38% |
4 Properties |
| 2011 | £239,406 | -50% |
8 Properties |
| 2010 | £358,142 | 45% |
7 Properties |
| 2009 | £197,625 | -36% |
8 Properties |
| 2008 | £268,730 | -32% |
13 Properties |
| 2007 | £353,772 | 35% |
11 Properties |
| 2006 | £229,399 | -13% |
12 Properties |
| 2005 | £258,250 | 17% |
10 Properties |
| 2004 | £215,480 | 5% |
5 Properties |
| 2003 | £205,079 | 29% |
17 Properties |
| 2002 | £145,790 | 33% |
19 Properties |
| 2001 | £98,112 | -11% |
12 Properties |
| 2000 | £108,433 | 1% |
15 Properties |
| 1999 | £107,694 | 9% |
17 Properties |
| 1998 | £98,214 | 15% |
7 Properties |
| 1997 | £83,769 | 1% |
10 Properties |
| 1996 | £82,798 | 10% |
15 Properties |
| 1995 | £74,730 | - |
13 Properties |
Property Price per Property Type in East Markham
Here you can find historic sold price data in order to help with your property search.
The average Property Paid Price for specific property types in the last three years are:
| Property Type | Average Sold Price | Sold Properties |
|---|---|---|
| Semi Detached House | £315,258.00 | 6 Semi Detached Houses |
| Detached House | £397,194.00 | 15 Detached Houses |
| Terraced House | £138,500.00 | 5 Terraced Houses |

