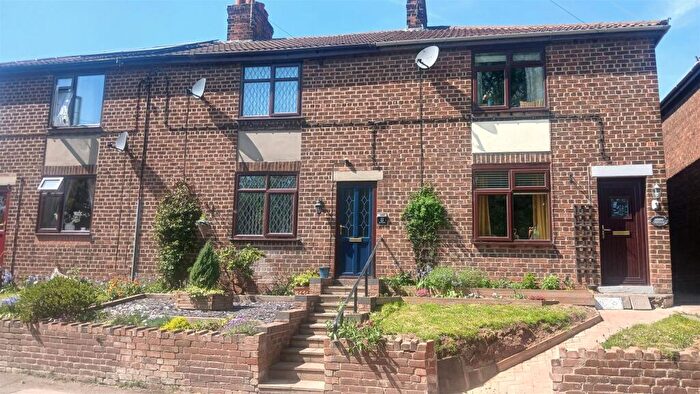
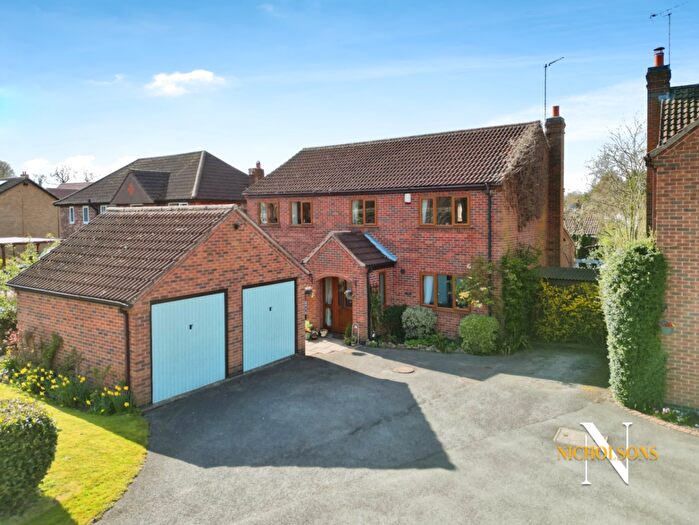
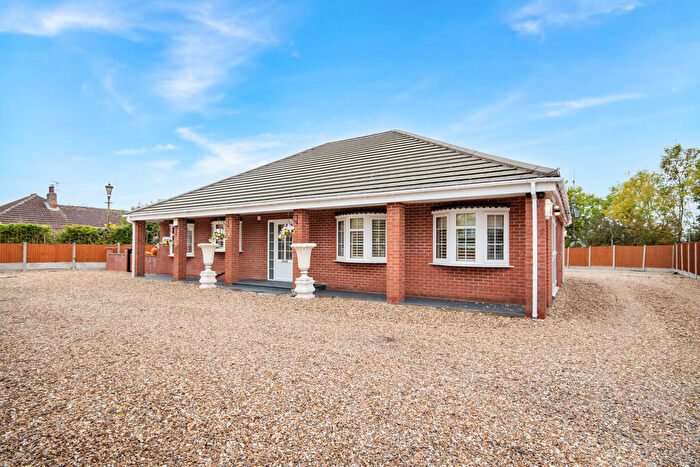
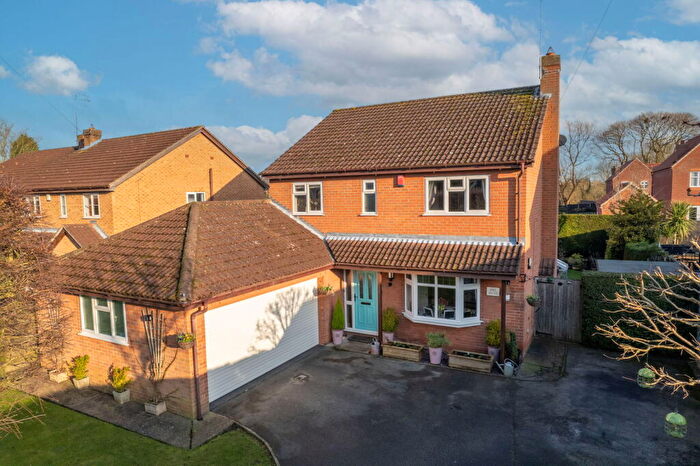
Houses for sale & to rent in East Markham, Newark
House Prices in East Markham
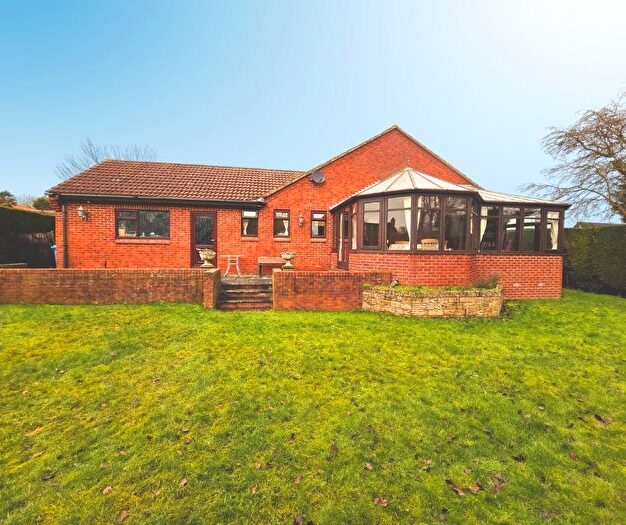
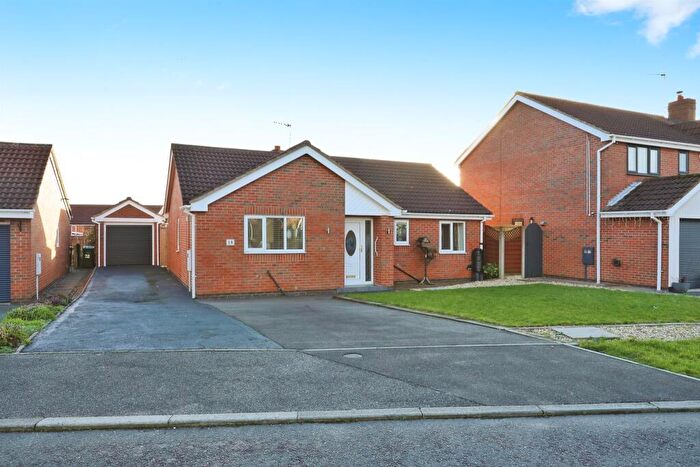
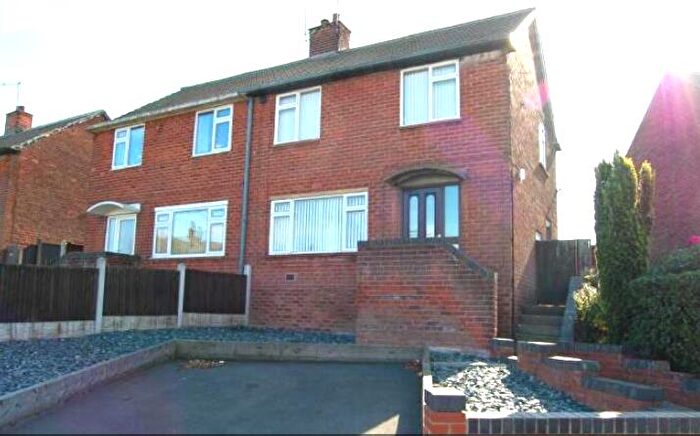
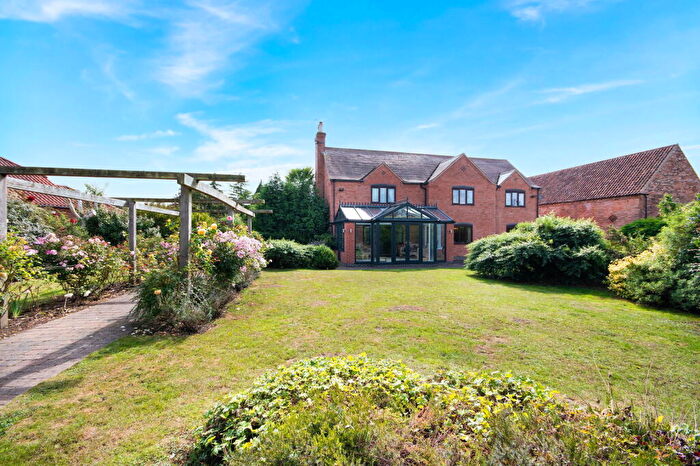
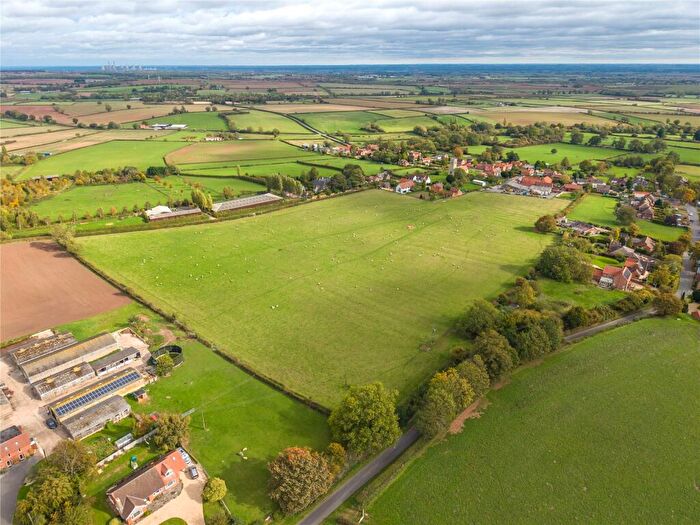
Properties in East Markham have an average house price of £375,774.00 and had 59 Property Transactions within the last 3 years¹.
East Markham is an area in Newark, Nottinghamshire with 645 households², where the most expensive property was sold for £915,000.00.
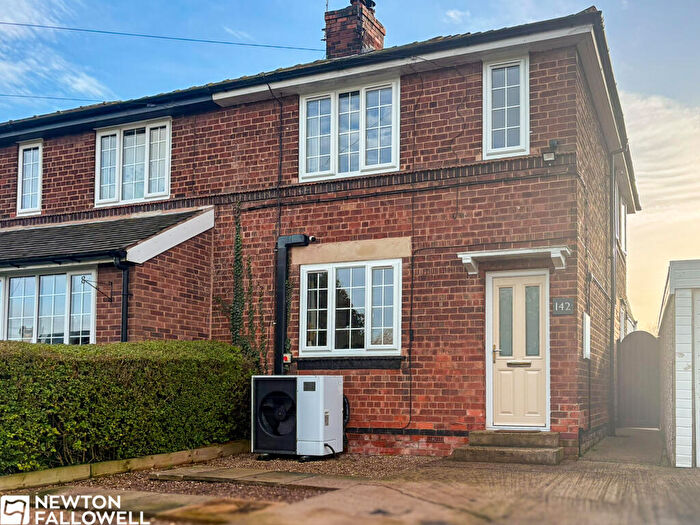
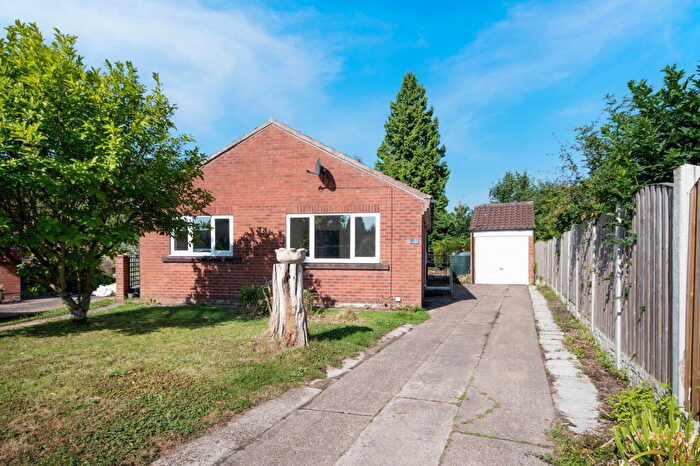
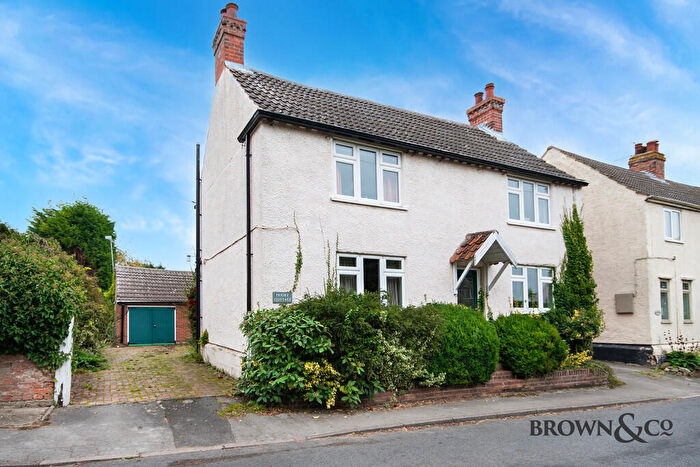
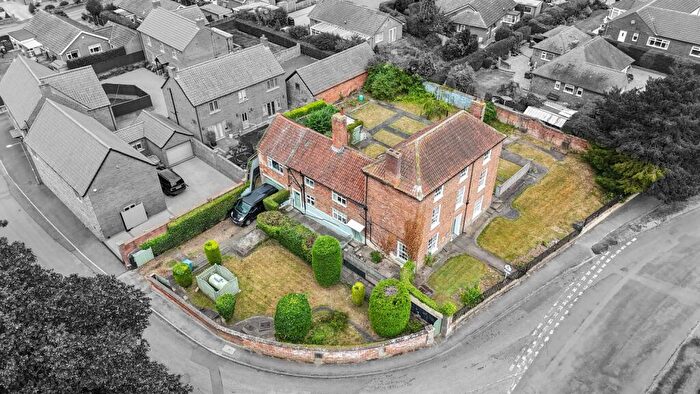
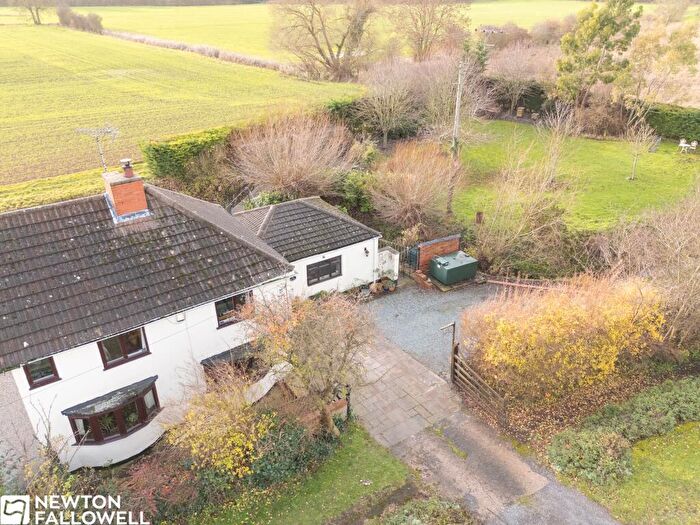
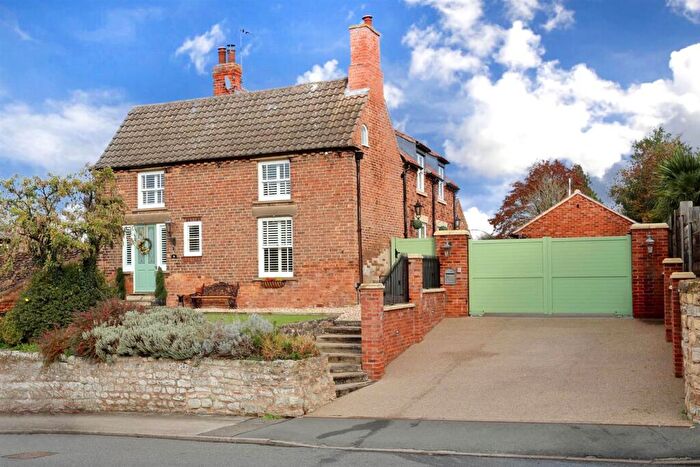
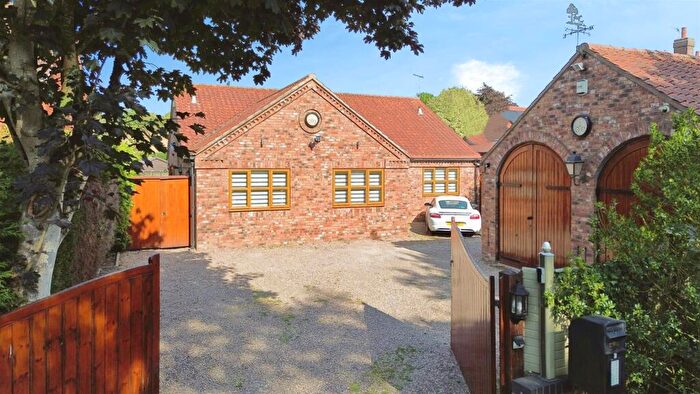
Properties for sale in East Markham
Roads and Postcodes in East Markham
Navigate through our locations to find the location of your next house in East Markham, Newark for sale or to rent.
| Streets | Postcodes |
|---|---|
| Askham Road | NG22 0RG NG22 0RQ |
| Bacon Lane | NG22 0GU |
| Beckland Hill | NG22 0QP |
| Bramley Close | NG22 0WX |
| Church Lane | NG22 0RU |
| Church Street | NG22 0QG NG22 0SA |
| Cleveland Hill | NG22 0PH NG22 0PL |
| College Court | NG22 0RY |
| College Lane | NG22 0QZ |
| Crossways | NG22 0SF |
| East View | NG22 0QR NG22 0QS |
| Eastcroft Lane | NG22 0RL NG22 0RN |
| Farm Lane | NG22 0QH |
| Great Lane | NG22 0QN |
| Hall Close | NG22 0RB |
| Hall Lane | NG22 0RA |
| High Street | NG22 0QJ NG22 0QL NG22 0RE |
| Judes Park | NG22 0FF |
| Kirke Close | NG22 0SQ |
| Lincoln Road | NG22 0SH NG22 0SL NG22 0SN NG22 0SR NG22 0SS NG22 0SW NG22 0SP |
| Low Street | NG22 0QQ |
| Main Street | NG22 0GT NG22 0PP |
| Mark Lane | NG22 0QU |
| Markham Clinton Pumping Station | NG22 0PR |
| Markham Road | NG22 0RJ |
| Old Hall Lane | NG22 0RF |
| Ollerton Road | NG22 0PG |
| Orchard Grove | NG22 0RZ |
| Orchardside Road | NG22 0FP |
| Parson Lane | NG22 0GW |
| Plantation Avenue | NG22 0SE |
| Plantation Road | NG22 0SD NG22 0RD |
| Priestgate | NG22 0QT |
| Queens Close | NG22 0QY |
| Rufford Close | NG22 0ST |
| Sibthorpe Hill | NG22 0PJ |
| South Croft | NG22 0RW |
| Springvale Road | NG22 0BT |
| Stocks Fold | NG22 0RX |
| The Avenue | NG22 0PW |
| The Sidings | NG22 0RH |
| Top Cart Gaps | NG22 0TE |
| Top Street | NG22 0RP NG22 0RR |
| Town Street | NG22 0RS |
| Trinity Crescent | NG22 0SG |
| Tuxford Road | NG22 0QD |
| Welwyn Close | NG22 0TT |
| Wood Lane | NG22 0GX NG22 0RT |
| York Paddock | NG22 0QX |
| York Street | NG22 0QW |
| NG22 0PN NG22 0PS NG22 0SB NG22 0SU |
Transport near East Markham
- FAQ
- Price Paid By Year
- Property Type Price
Frequently asked questions about East Markham
What is the average price for a property for sale in East Markham?
The average price for a property for sale in East Markham is £375,774. This amount is 51% higher than the average price in Newark. There are 552 property listings for sale in East Markham.
What streets have the most expensive properties for sale in East Markham?
The streets with the most expensive properties for sale in East Markham are Main Street at an average of £892,700, Lincoln Road at an average of £658,750 and York Street at an average of £507,750.
What streets have the most affordable properties for sale in East Markham?
The streets with the most affordable properties for sale in East Markham are East View at an average of £178,250, Plantation Avenue at an average of £203,333 and Sibthorpe Hill at an average of £210,000.
Which train stations are available in or near East Markham?
Some of the train stations available in or near East Markham are Retford, Collingham and Saxilby.
Property Price Paid in East Markham by Year
The average sold property price by year was:
| Year | Average Sold Price | Price Change |
Sold Properties
|
|---|---|---|---|
| 2025 | £408,297 | 14% |
21 Properties |
| 2024 | £350,758 | -5% |
24 Properties |
| 2023 | £369,875 | -3% |
14 Properties |
| 2022 | £382,462 | 5% |
25 Properties |
| 2021 | £363,239 | 10% |
33 Properties |
| 2020 | £327,818 | -11% |
22 Properties |
| 2019 | £364,233 | -11% |
15 Properties |
| 2018 | £405,854 | 28% |
24 Properties |
| 2017 | £291,277 | -2% |
27 Properties |
| 2016 | £297,681 | 25% |
11 Properties |
| 2015 | £223,407 | -27% |
19 Properties |
| 2014 | £283,452 | 14% |
23 Properties |
| 2013 | £245,050 | 3% |
20 Properties |
| 2012 | £237,038 | 14% |
13 Properties |
| 2011 | £204,266 | -9% |
24 Properties |
| 2010 | £223,531 | -5% |
16 Properties |
| 2009 | £233,770 | 2% |
12 Properties |
| 2008 | £230,181 | -10% |
22 Properties |
| 2007 | £252,792 | 2% |
27 Properties |
| 2006 | £247,469 | 15% |
18 Properties |
| 2005 | £209,210 | - |
19 Properties |
| 2004 | £209,222 | 13% |
22 Properties |
| 2003 | £182,025 | 8% |
50 Properties |
| 2002 | £167,836 | 21% |
26 Properties |
| 2001 | £133,340 | 15% |
42 Properties |
| 2000 | £113,440 | 15% |
36 Properties |
| 1999 | £96,914 | -16% |
30 Properties |
| 1998 | £112,183 | 12% |
24 Properties |
| 1997 | £98,935 | 29% |
27 Properties |
| 1996 | £70,620 | -9% |
25 Properties |
| 1995 | £77,134 | - |
22 Properties |
Property Price per Property Type in East Markham
Here you can find historic sold price data in order to help with your property search.
The average Property Paid Price for specific property types in the last three years are:
| Property Type | Average Sold Price | Sold Properties |
|---|---|---|
| Semi Detached House | £222,583.00 | 12 Semi Detached Houses |
| Detached House | £436,806.00 | 43 Detached Houses |
| Terraced House | £179,250.00 | 4 Terraced Houses |

