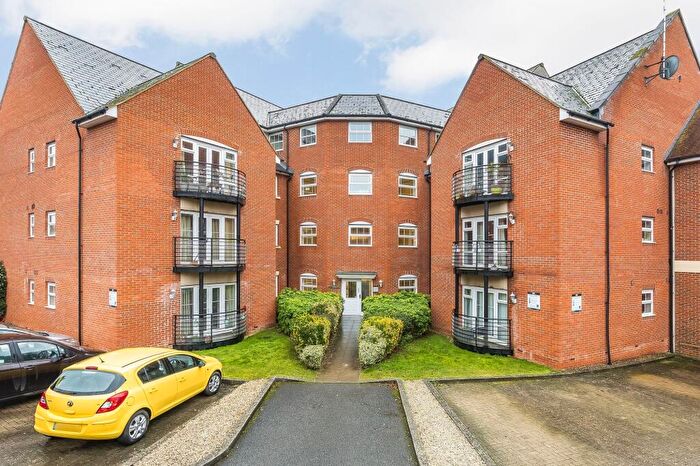
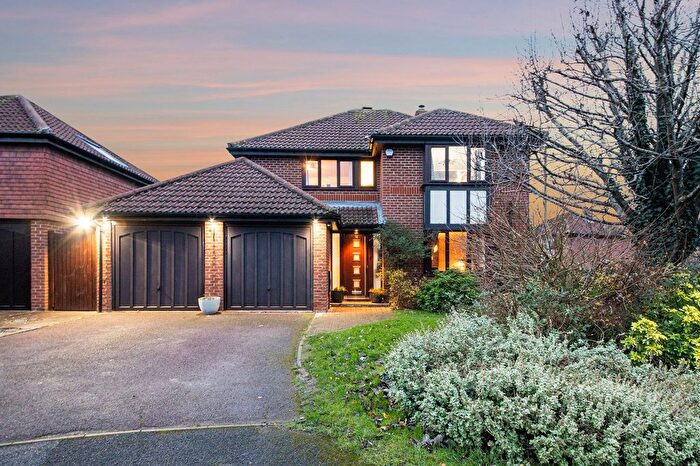
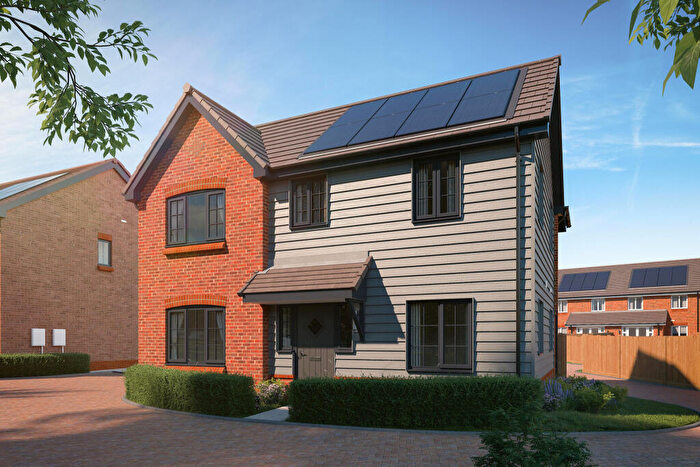
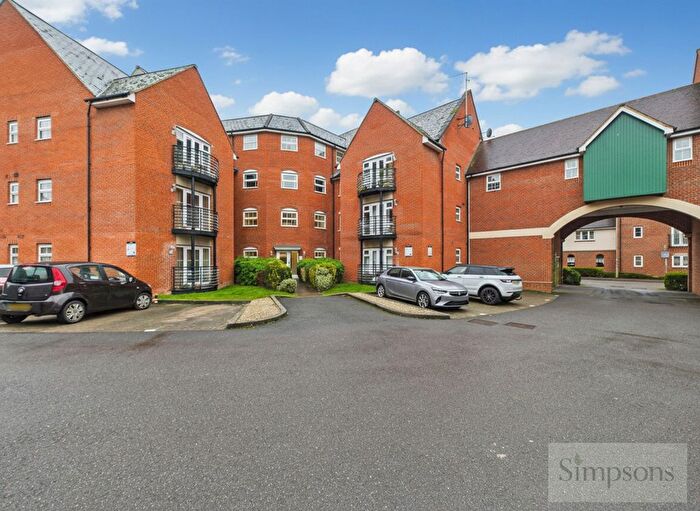
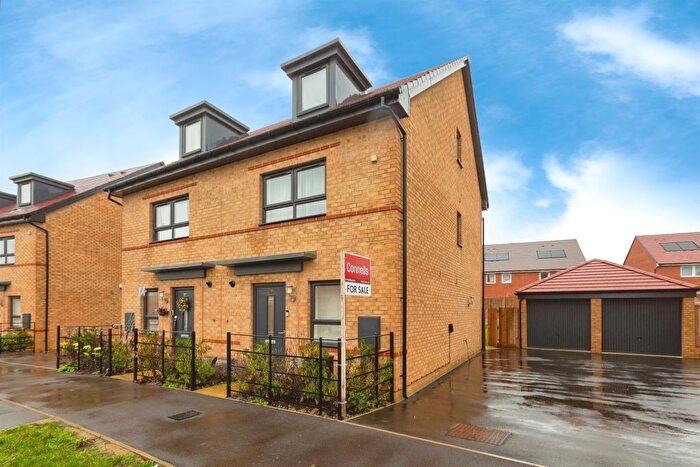
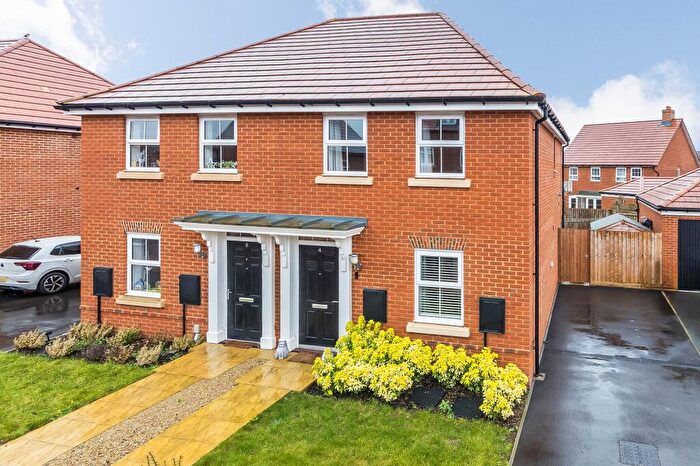
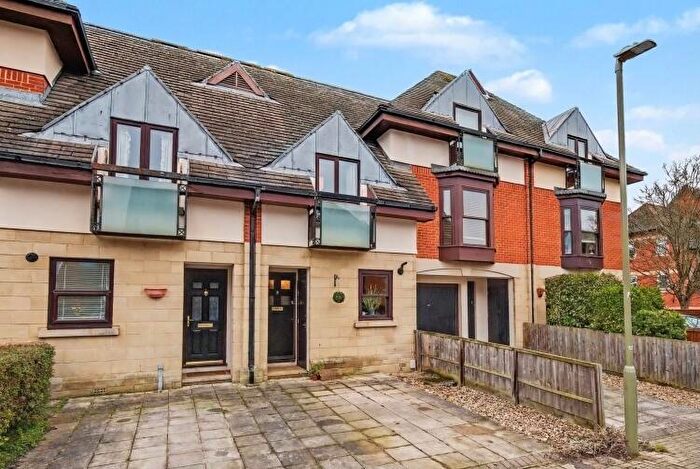
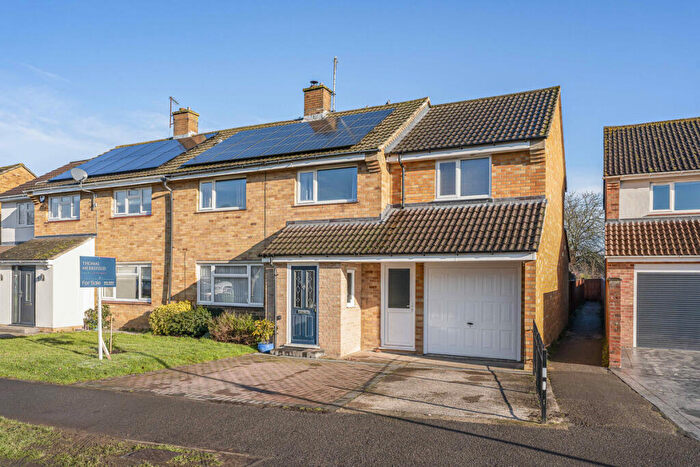
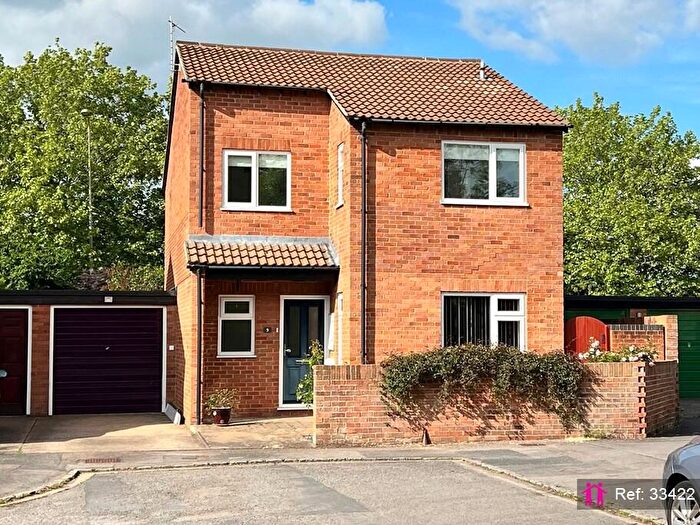
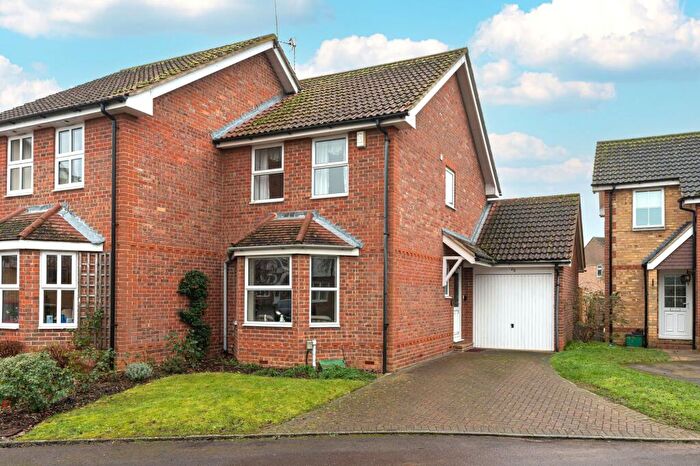
Houses for sale & to rent in Abingdon Dunmore, Abingdon
House Prices in Abingdon Dunmore
Properties in Abingdon Dunmore have an average house price of £426,709.00 and had 151 Property Transactions within the last 3 years¹.
Abingdon Dunmore is an area in Abingdon, Oxfordshire with 1,877 households², where the most expensive property was sold for £1,395,000.00.
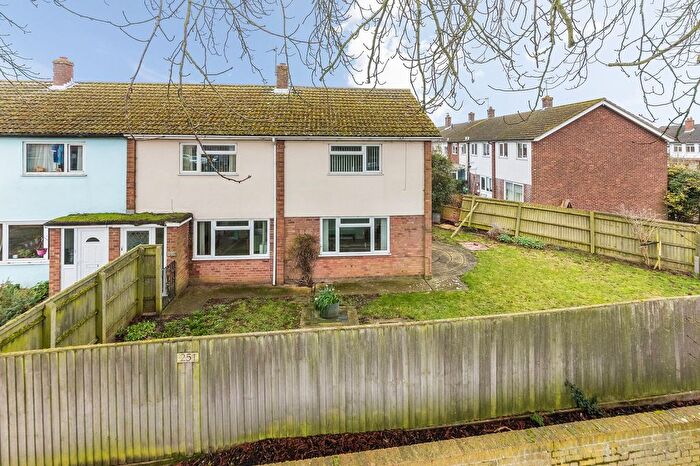
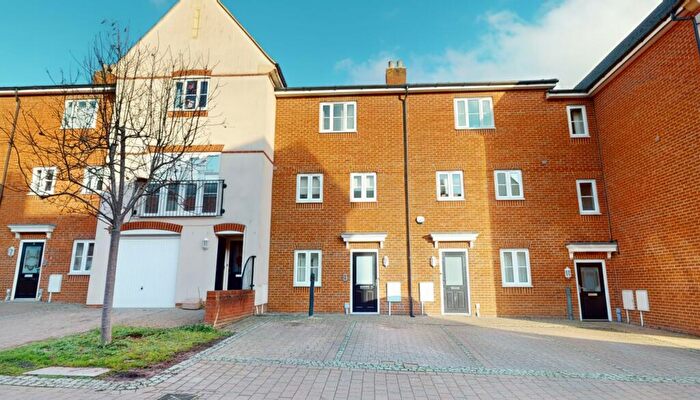
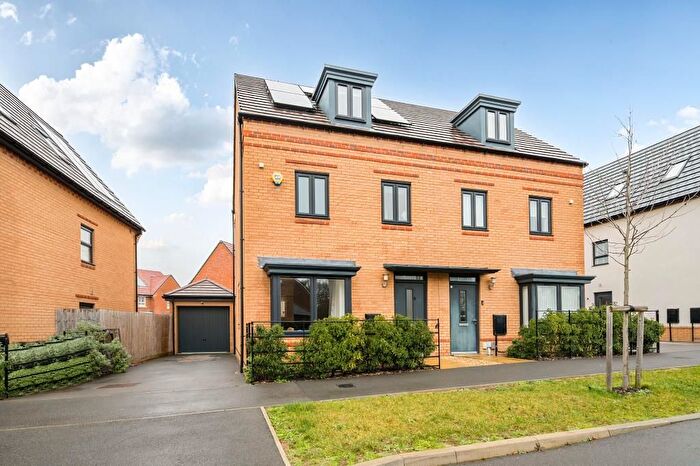
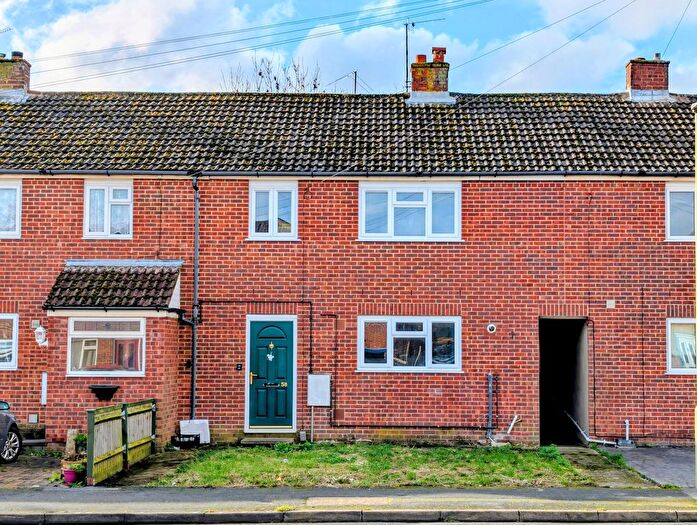
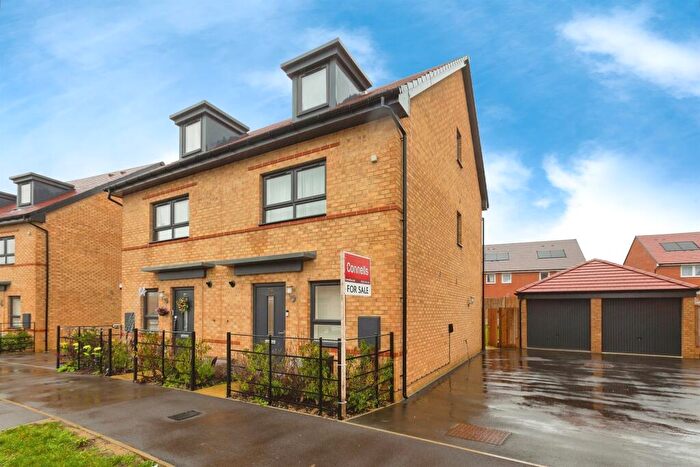
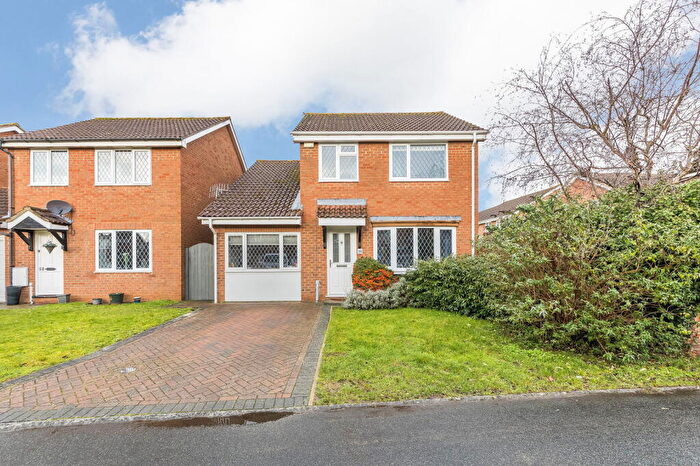
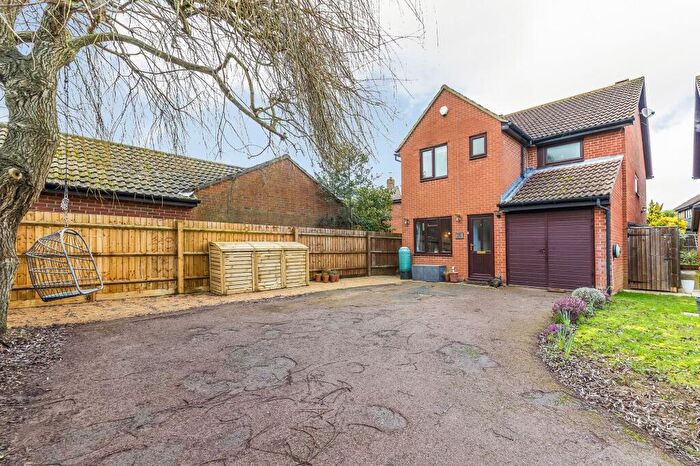
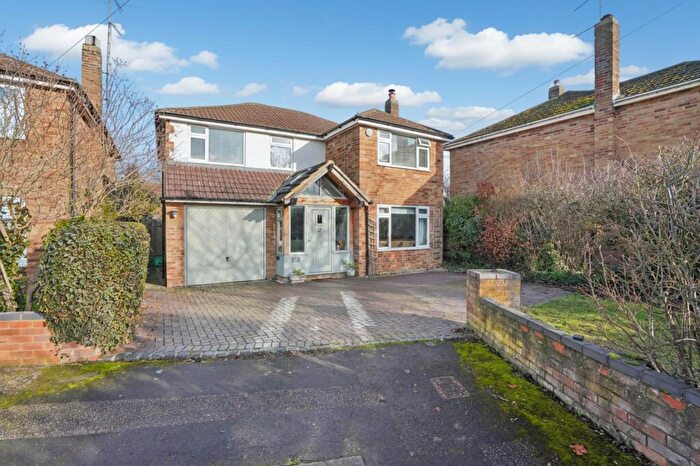
Properties for sale in Abingdon Dunmore
Roads and Postcodes in Abingdon Dunmore
Navigate through our locations to find the location of your next house in Abingdon Dunmore, Abingdon for sale or to rent.
| Streets | Postcodes |
|---|---|
| Aird Row | OX14 1FG |
| Alexander Close | OX14 1XA OX14 1XB OX14 1XD |
| Allder Close | OX14 1YG |
| Appleford Drive | OX14 2BS OX14 2DB |
| Argyle Drive | OX14 1RD |
| Austin Place | OX14 1LT OX14 1LU OX14 1LX OX14 1LY OX14 1NL |
| Baileys Crescent | OX14 1TJ |
| Ballard Chase | OX14 1XQ |
| Beech Lane | OX14 1QF |
| Benson Road | OX14 1LN |
| Beverley Close | OX14 1LA OX14 1LB |
| Blyth Park | OX14 1RS |
| Boulter Drive | OX14 1XF OX14 1XG OX14 1XP |
| Cox Way | OX14 1SX |
| Cullerne Close | OX14 1XH OX14 1XJ |
| Day Close | OX14 1RN |
| Dearlove Close | OX14 1LP |
| Dunmore Road | OX14 1LH OX14 1PU |
| Eden Croft | OX14 1QJ |
| Eldridge Close | OX14 1YQ |
| Farm Road | OX14 1LZ OX14 1NA OX14 1NB OX14 1NE |
| Foster Road | OX14 1YN OX14 1YW |
| Franklyn Close | OX14 1YF |
| Gibson Close | OX14 1XS OX14 1XT |
| Hanson Road | OX14 1YL |
| Hemmings Lane | OX14 1SA |
| Hillview Road | OX14 1ND |
| Hobby Green | OX14 1FW |
| Holland Road | OX14 1PH |
| Knollys Close | OX14 1XN |
| Kysbie Close | OX14 1XY OX14 1XZ |
| Langley Road | OX14 1YA OX14 1YB OX14 1YD |
| Larners Way | OX14 1TG |
| Lewis Gardens | OX14 1RW |
| Lovelace Close | OX14 1XW |
| Loyd Close | OX14 1XR |
| Mandeville Close | OX14 2BD |
| Mobbs Row | OX14 1SZ |
| North Avenue | OX14 1QN OX14 1QW |
| Northfield Road | OX14 1QL |
| Oxford Road | OX14 2AE OX14 2AF OX14 2AG |
| Parsons Mead | OX14 1LL OX14 1LR OX14 1LS OX14 1LW |
| Picklers Hill | OX14 2BA OX14 2BB |
| Prince Grove | OX14 1XE |
| Prosser Way | OX14 1ZL |
| Rose Avenue | OX14 1XX |
| Sellwood Road | OX14 1PE OX14 1PF OX14 1PG OX14 1PZ |
| South Avenue | OX14 1QH OX14 1QR OX14 1QS OX14 1QT OX14 1QU OX14 1QX OX14 1QY |
| Spenlove Close | OX14 1YE |
| Terrington Close | OX14 1PQ |
| Vernon Place | OX14 1RU |
| Walker Grove | OX14 1SB |
| West Avenue | OX14 1QP |
| Wheatcroft Close | OX14 2BE |
| Willow Court | OX14 1ZB |
| Wivell Drive | OX14 1ZF |
| Woodley Close | OX14 1YH OX14 1YJ |
| Wootton Road | OX14 1LJ |
| OX14 1RH OX14 1RJ OX14 1ZE |
Transport near Abingdon Dunmore
- FAQ
- Price Paid By Year
- Property Type Price
Frequently asked questions about Abingdon Dunmore
What is the average price for a property for sale in Abingdon Dunmore?
The average price for a property for sale in Abingdon Dunmore is £426,709. This amount is 3% lower than the average price in Abingdon. There are 1,292 property listings for sale in Abingdon Dunmore.
What streets have the most expensive properties for sale in Abingdon Dunmore?
The streets with the most expensive properties for sale in Abingdon Dunmore are Picklers Hill at an average of £1,148,300, Lovelace Close at an average of £701,000 and Wheatcroft Close at an average of £647,500.
What streets have the most affordable properties for sale in Abingdon Dunmore?
The streets with the most affordable properties for sale in Abingdon Dunmore are Eldridge Close at an average of £182,500, Spenlove Close at an average of £216,820 and Woodley Close at an average of £227,500.
Which train stations are available in or near Abingdon Dunmore?
Some of the train stations available in or near Abingdon Dunmore are Radley, Culham and Appleford.
Property Price Paid in Abingdon Dunmore by Year
The average sold property price by year was:
| Year | Average Sold Price | Price Change |
Sold Properties
|
|---|---|---|---|
| 2025 | £443,378 | 10% |
46 Properties |
| 2024 | £400,859 | -10% |
56 Properties |
| 2023 | £440,604 | 5% |
49 Properties |
| 2022 | £417,573 | 1% |
57 Properties |
| 2021 | £414,216 | 7% |
80 Properties |
| 2020 | £384,146 | -0,1% |
71 Properties |
| 2019 | £384,422 | 5% |
68 Properties |
| 2018 | £366,723 | -4% |
67 Properties |
| 2017 | £381,133 | 7% |
75 Properties |
| 2016 | £353,935 | -3% |
65 Properties |
| 2015 | £365,524 | 13% |
87 Properties |
| 2014 | £317,287 | 15% |
74 Properties |
| 2013 | £270,316 | -5% |
79 Properties |
| 2012 | £283,315 | 18% |
59 Properties |
| 2011 | £231,913 | -16% |
70 Properties |
| 2010 | £268,653 | 10% |
63 Properties |
| 2009 | £242,595 | -10% |
73 Properties |
| 2008 | £266,011 | -0,4% |
45 Properties |
| 2007 | £267,148 | 9% |
99 Properties |
| 2006 | £243,766 | 14% |
125 Properties |
| 2005 | £209,528 | -1% |
95 Properties |
| 2004 | £212,475 | 6% |
123 Properties |
| 2003 | £199,894 | 18% |
115 Properties |
| 2002 | £164,904 | -1% |
107 Properties |
| 2001 | £165,950 | 22% |
140 Properties |
| 2000 | £129,883 | 7% |
140 Properties |
| 1999 | £120,642 | 12% |
165 Properties |
| 1998 | £106,469 | 18% |
126 Properties |
| 1997 | £87,118 | 7% |
121 Properties |
| 1996 | £81,402 | -7% |
135 Properties |
| 1995 | £87,401 | - |
84 Properties |
Property Price per Property Type in Abingdon Dunmore
Here you can find historic sold price data in order to help with your property search.
The average Property Paid Price for specific property types in the last three years are:
| Property Type | Average Sold Price | Sold Properties |
|---|---|---|
| Semi Detached House | £393,145.00 | 44 Semi Detached Houses |
| Detached House | £551,410.00 | 63 Detached Houses |
| Terraced House | £334,393.00 | 30 Terraced Houses |
| Flat | £168,864.00 | 14 Flats |


