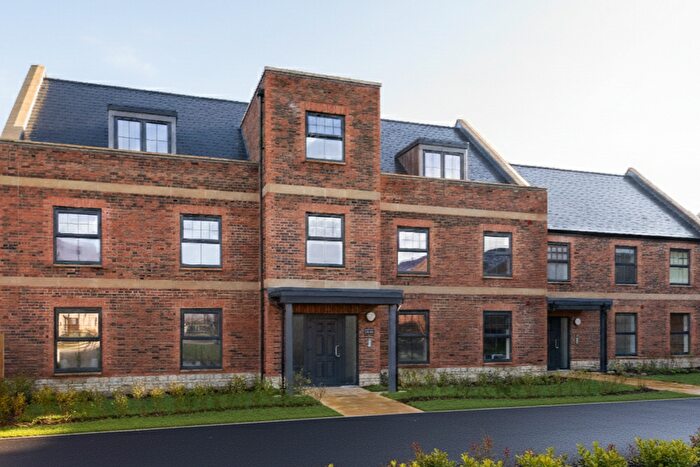
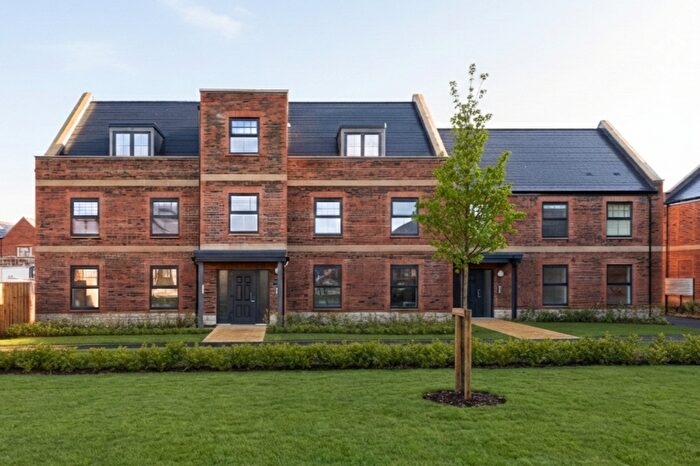
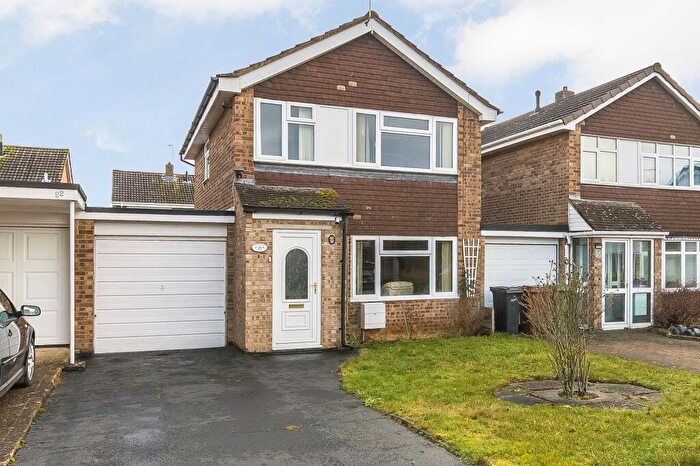
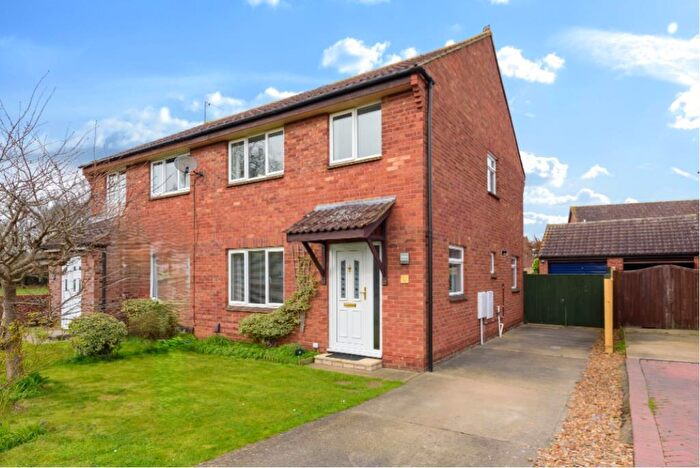
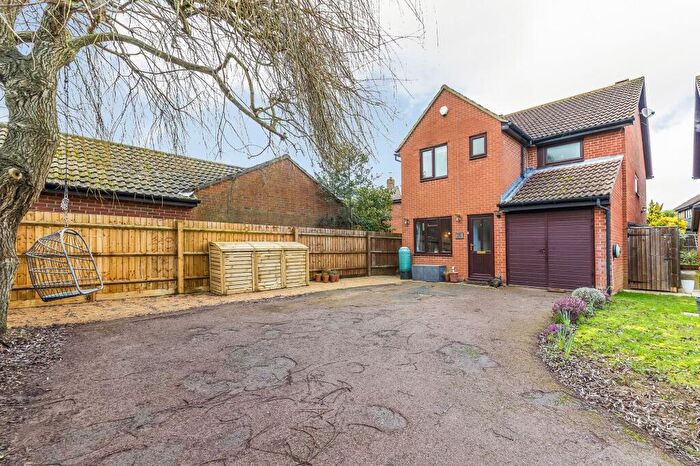
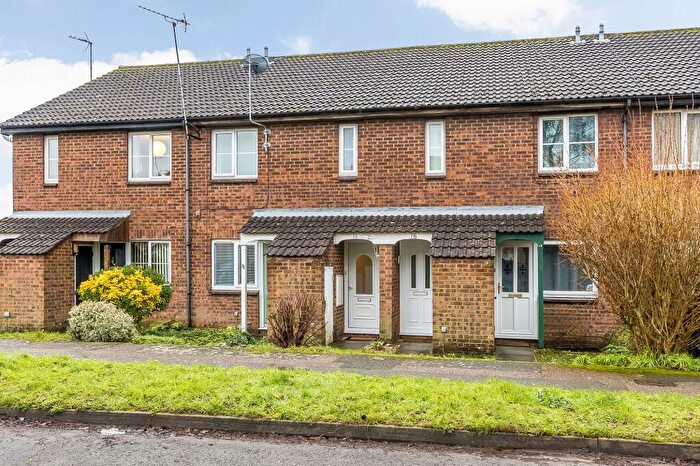
Houses for sale & to rent in Abingdon Peachcroft, Abingdon
House Prices in Abingdon Peachcroft
Properties in Abingdon Peachcroft have an average house price of £405,042.00 and had 134 Property Transactions within the last 3 years¹.
Abingdon Peachcroft is an area in Abingdon, Oxfordshire with 1,695 households², where the most expensive property was sold for £1,185,000.00.
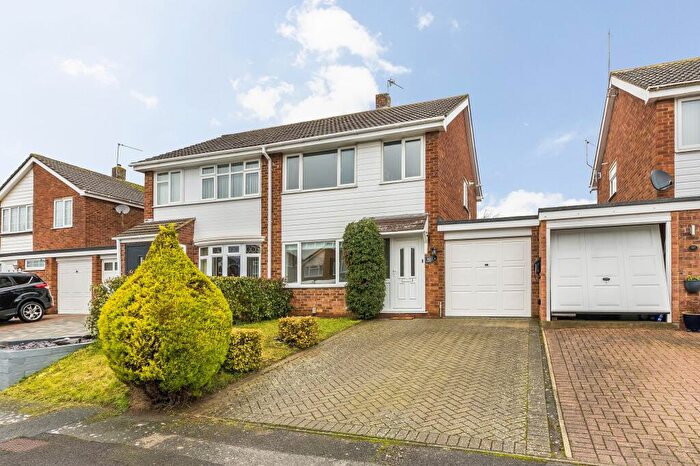
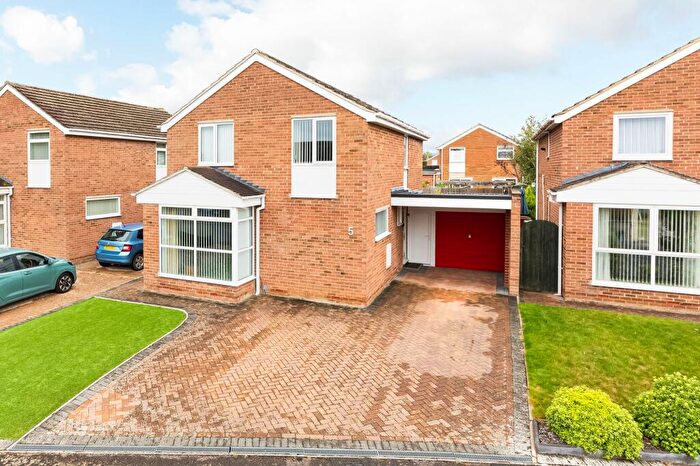
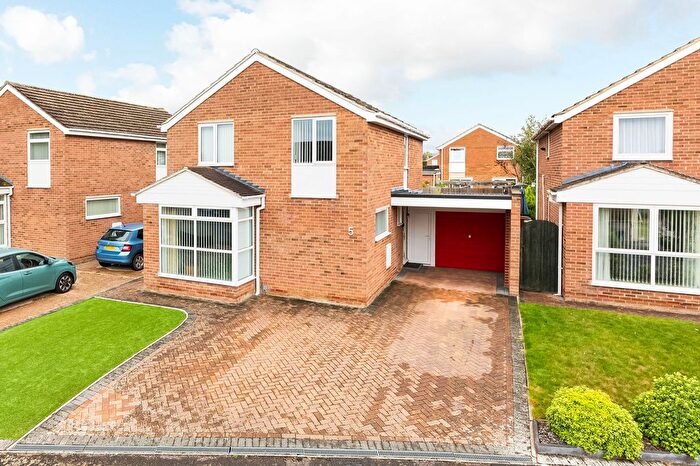
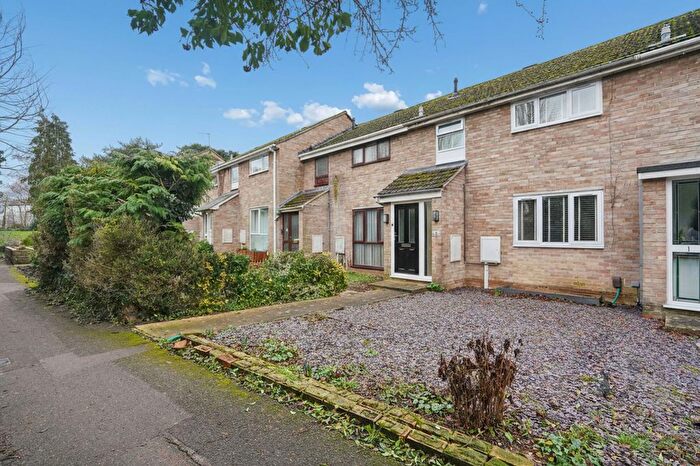
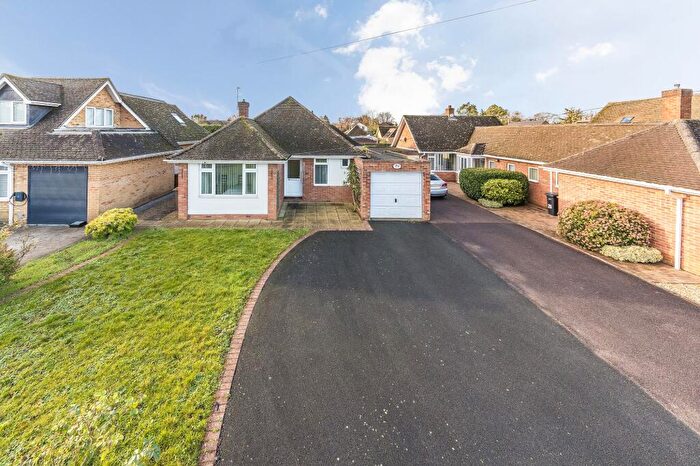
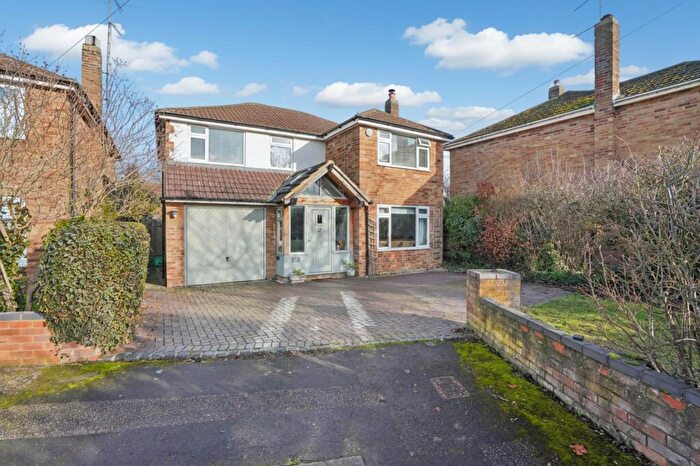
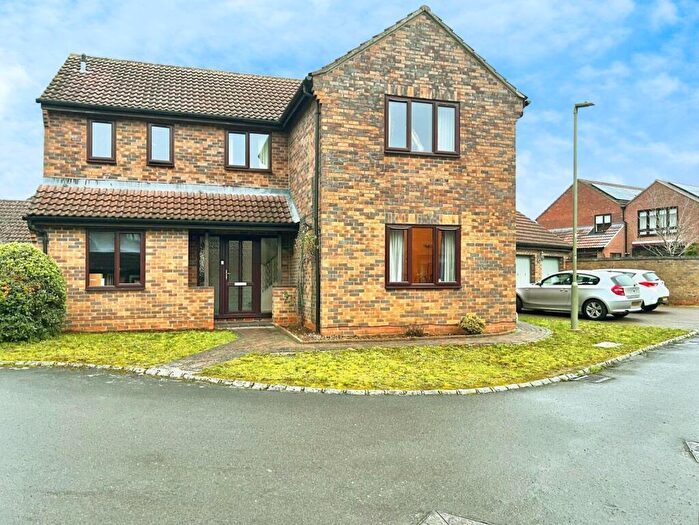
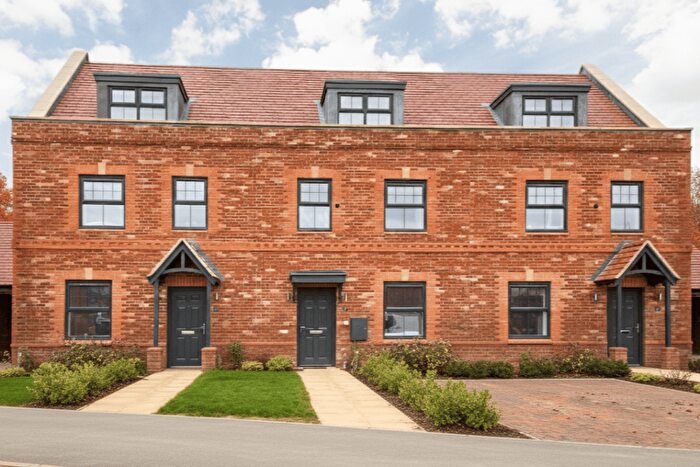
Properties for sale in Abingdon Peachcroft
Roads and Postcodes in Abingdon Peachcroft
Navigate through our locations to find the location of your next house in Abingdon Peachcroft, Abingdon for sale or to rent.
| Streets | Postcodes |
|---|---|
| Abingdon Lock | OX14 3NW |
| Abingdon Science Park | OX14 3PH OX14 3YP |
| Amyce Close | OX14 2QY |
| Audlett Drive | OX14 3PJ |
| Barfleur Close | OX14 2RF |
| Barrow Hill Close | OX14 2LX |
| Barton Lane | OX14 3NB OX14 3PZ OX14 3YT |
| Beagle Close | OX14 2NU |
| Boreford Road | OX14 2QX OX14 2QT OX14 2QU |
| Bowgrave Copse | OX14 2NL |
| Boxwell Close | OX14 2QN |
| Brode Close | OX14 2QJ |
| Bucklers Bury Road | OX14 2RD |
| Cameron Avenue | OX14 3SR |
| Carse Close | OX14 2RA |
| Champs Close | OX14 2NB |
| Chandlers Close | OX14 2NN |
| Charney Avenue | OX14 2NY OX14 2NZ |
| Cherwell Close | OX14 3TD |
| Clematis Place | OX14 3QG |
| Corn Avill Close | OX14 2ND |
| Covent Close | OX14 2RG |
| Duffield Close | OX14 2RS |
| Eason Drive | OX14 3YD |
| Elizabeth Avenue | OX14 2NP OX14 2NR OX14 2NS |
| Eney Close | OX14 2LZ |
| Ethelhelm Close | OX14 2RE |
| Evenlode Park | OX14 3SZ |
| Gardiner Close | OX14 3YA |
| Ginge Close | OX14 2PY |
| Glyme Close | OX14 3SY |
| Gordon Drive | OX14 3SW |
| Hamble Drive | OX14 3TE OX14 3TF |
| Hean Close | OX14 2QF |
| Heathcote Place | OX14 3YQ |
| Hedgemead Avenue | OX14 2NE OX14 2NJ OX14 2NW |
| Henor Mill Close | OX14 2QP |
| Holywell Close | OX14 2PU |
| Hound Close | OX14 2LU |
| Isis Close | OX14 3TA |
| Kennet Road | OX14 3SS OX14 3ST OX14 3SU |
| Lindsay Drive | OX14 2RR OX14 2RT |
| Loddon Close | OX14 3TB |
| Lumberd Road | OX14 2QG OX14 2QH OX14 2QQ |
| Lynges Close | OX14 2QW |
| Norbrook Close | OX14 2PZ |
| Norris Close | OX14 2RJ OX14 2RL OX14 2RN OX14 2RP OX14 2RW |
| Otwell Close | OX14 2QR |
| Pagisters Road | OX14 2LY |
| Peachcroft Road | OX14 2NA OX14 2RU OX14 2SB |
| Peachcroft Shopping Centre | OX14 2QA |
| Penn Close | OX14 2NX |
| Pykes Close | OX14 2QL |
| Pytenry Close | OX14 2RQ |
| Radley Road | OX14 3SL OX14 3SN OX14 3SQ OX14 3SH |
| Rushmead Copse | OX14 2NH |
| Sandford Close | OX14 2PX |
| Sewell Close | OX14 3YJ |
| Shrieves Close | OX14 2RB |
| St Andrews Close | OX14 2NT |
| St Peters Road | OX14 3SJ |
| Stockey End | OX14 2NF |
| The Chestnuts | OX14 3YN |
| The Copse | OX14 3YW |
| The Quadrant | OX14 3YS |
| Thistlecroft Close | OX14 2QS |
| Trinity Close | OX14 2QE |
| Waxes Close | OX14 2NG |
| Wick Close | OX14 2NQ |
| Windrush Way | OX14 3SX |
| Yeld Hall Road | OX14 2QZ |
Transport near Abingdon Peachcroft
- FAQ
- Price Paid By Year
- Property Type Price
Frequently asked questions about Abingdon Peachcroft
What is the average price for a property for sale in Abingdon Peachcroft?
The average price for a property for sale in Abingdon Peachcroft is £405,042. This amount is 8% lower than the average price in Abingdon. There are 1,079 property listings for sale in Abingdon Peachcroft.
What streets have the most expensive properties for sale in Abingdon Peachcroft?
The streets with the most expensive properties for sale in Abingdon Peachcroft are The Chestnuts at an average of £1,054,500, The Copse at an average of £850,000 and Eason Drive at an average of £778,750.
What streets have the most affordable properties for sale in Abingdon Peachcroft?
The streets with the most affordable properties for sale in Abingdon Peachcroft are Lindsay Drive at an average of £276,833, Isis Close at an average of £301,833 and Hean Close at an average of £305,000.
Which train stations are available in or near Abingdon Peachcroft?
Some of the train stations available in or near Abingdon Peachcroft are Radley, Culham and Appleford.
Property Price Paid in Abingdon Peachcroft by Year
The average sold property price by year was:
| Year | Average Sold Price | Price Change |
Sold Properties
|
|---|---|---|---|
| 2025 | £420,477 | 7% |
45 Properties |
| 2024 | £391,774 | -3% |
51 Properties |
| 2023 | £404,571 | 5% |
38 Properties |
| 2022 | £384,323 | 3% |
52 Properties |
| 2021 | £372,513 | 11% |
80 Properties |
| 2020 | £331,828 | -0,4% |
38 Properties |
| 2019 | £333,061 | -10% |
48 Properties |
| 2018 | £364,759 | 6% |
60 Properties |
| 2017 | £343,762 | -7% |
50 Properties |
| 2016 | £369,525 | 15% |
54 Properties |
| 2015 | £313,155 | 11% |
80 Properties |
| 2014 | £278,009 | -6% |
66 Properties |
| 2013 | £293,481 | 11% |
75 Properties |
| 2012 | £261,518 | 5% |
63 Properties |
| 2011 | £249,233 | 3% |
63 Properties |
| 2010 | £240,763 | 14% |
62 Properties |
| 2009 | £206,642 | -23% |
51 Properties |
| 2008 | £253,854 | 7% |
48 Properties |
| 2007 | £237,137 | 8% |
86 Properties |
| 2006 | £218,572 | 3% |
98 Properties |
| 2005 | £211,771 | 0,4% |
75 Properties |
| 2004 | £211,027 | 12% |
116 Properties |
| 2003 | £186,054 | 8% |
89 Properties |
| 2002 | £170,852 | 15% |
93 Properties |
| 2001 | £144,721 | 10% |
125 Properties |
| 2000 | £130,065 | 17% |
101 Properties |
| 1999 | £107,479 | 14% |
129 Properties |
| 1998 | £92,885 | 9% |
111 Properties |
| 1997 | £84,403 | 7% |
102 Properties |
| 1996 | £78,237 | 9% |
104 Properties |
| 1995 | £71,002 | - |
87 Properties |
Property Price per Property Type in Abingdon Peachcroft
Here you can find historic sold price data in order to help with your property search.
The average Property Paid Price for specific property types in the last three years are:
| Property Type | Average Sold Price | Sold Properties |
|---|---|---|
| Semi Detached House | £362,572.00 | 62 Semi Detached Houses |
| Detached House | £555,250.00 | 36 Detached Houses |
| Terraced House | £341,915.00 | 33 Terraced Houses |
| Flat | £174,666.00 | 3 Flats |

