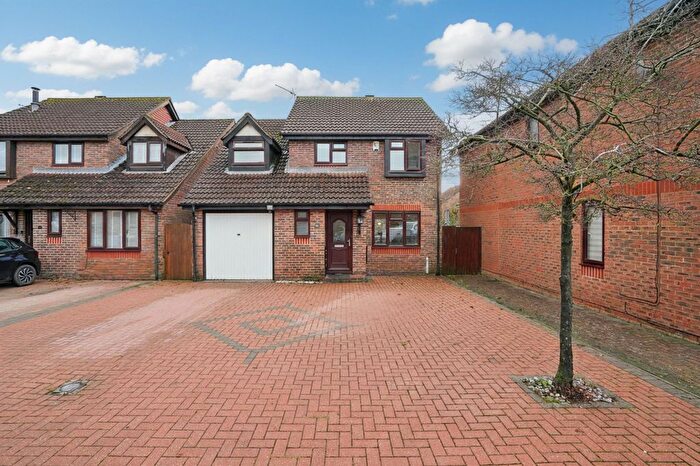
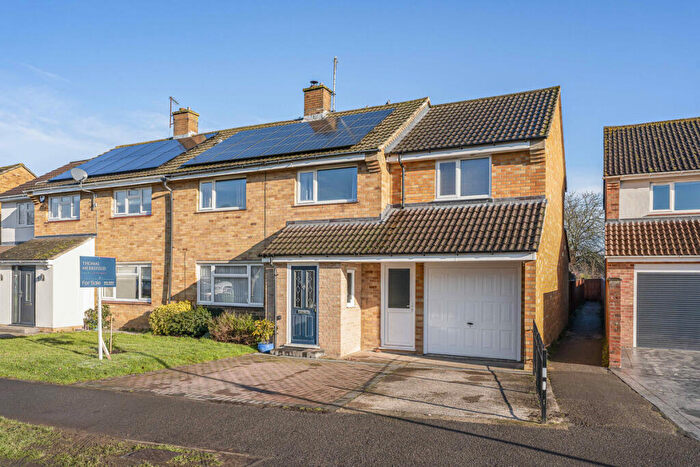
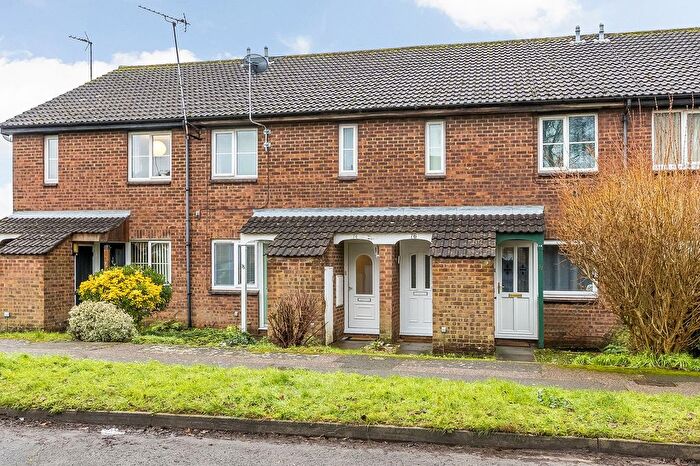
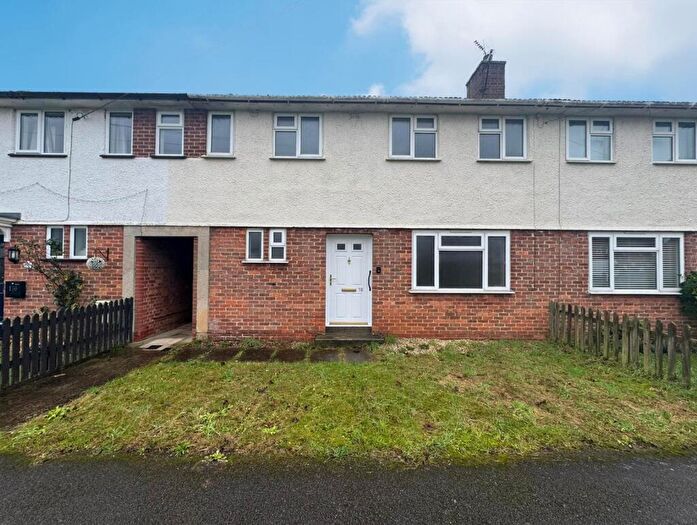
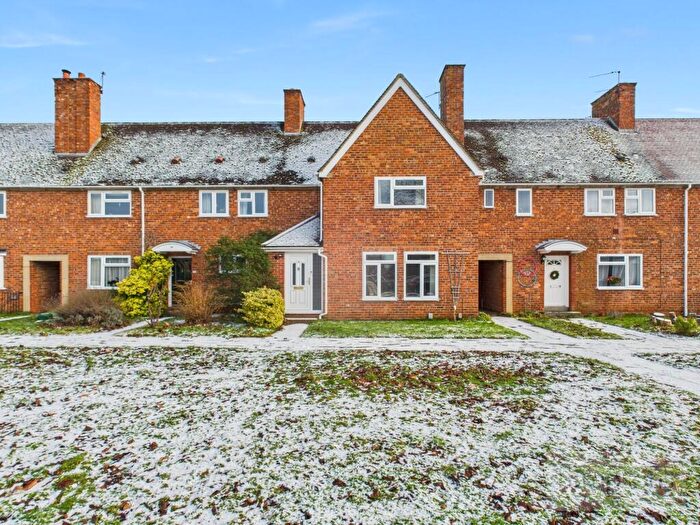
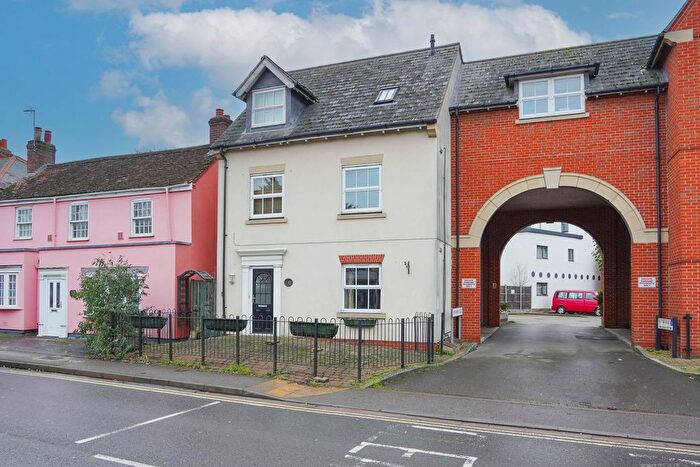
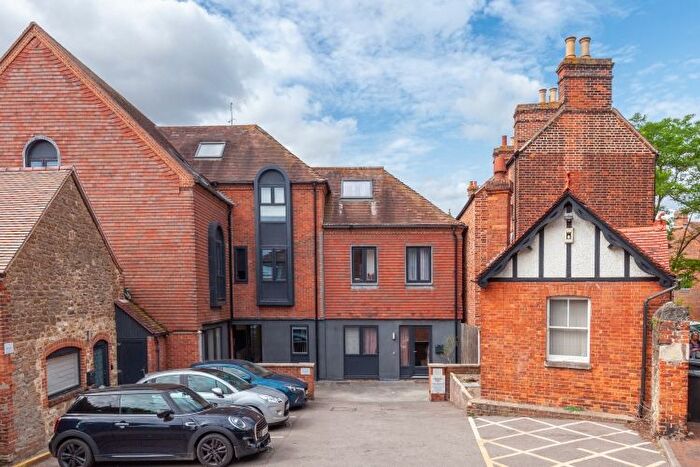
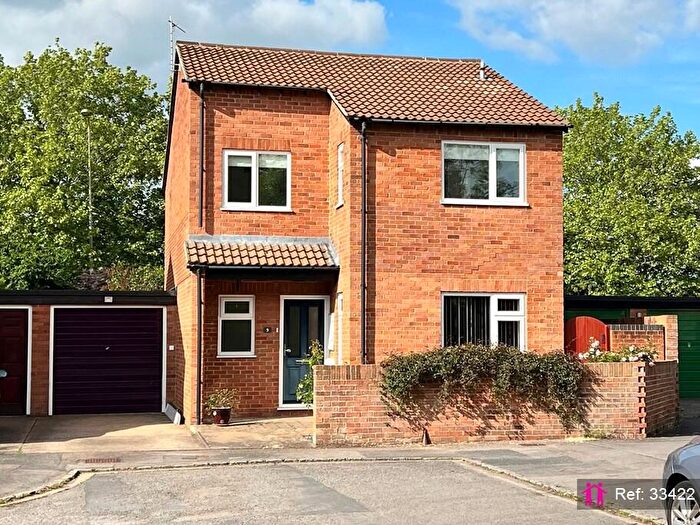
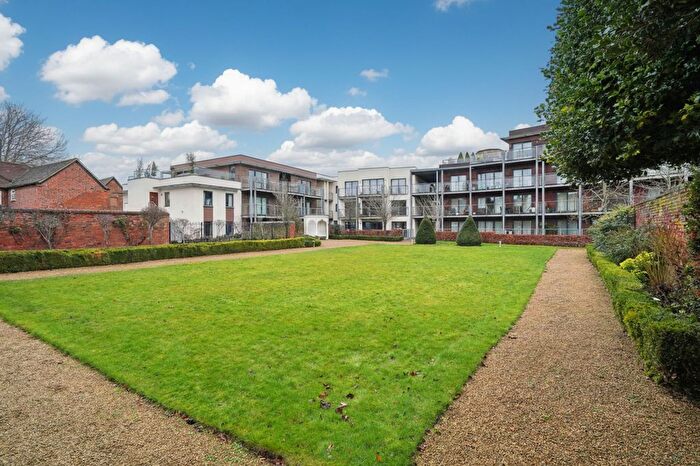
Houses for sale & to rent in Abingdon Northcourt, Abingdon
House Prices in Abingdon Northcourt
Properties in Abingdon Northcourt have an average house price of £440,722.00 and had 235 Property Transactions within the last 3 years¹.
Abingdon Northcourt is an area in Abingdon, Oxfordshire with 1,899 households², where the most expensive property was sold for £1,650,000.00.
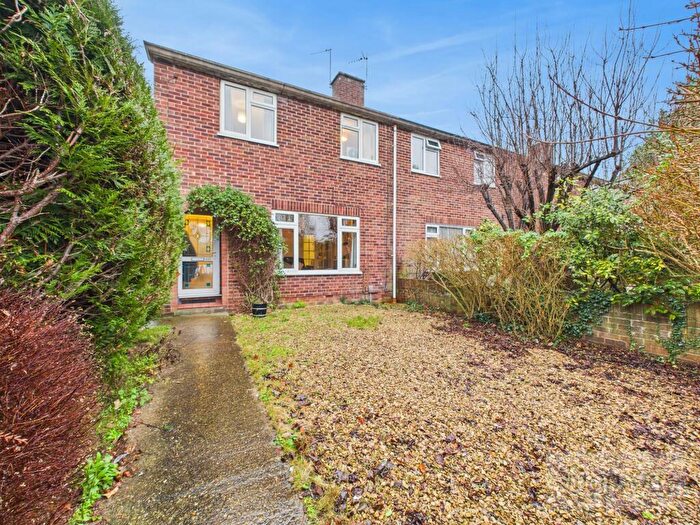
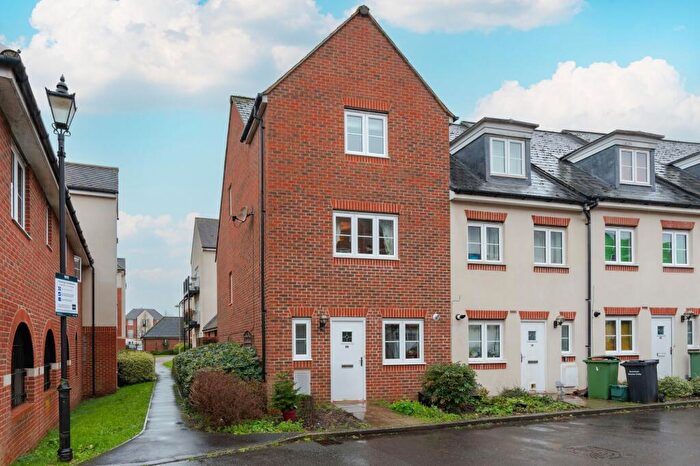
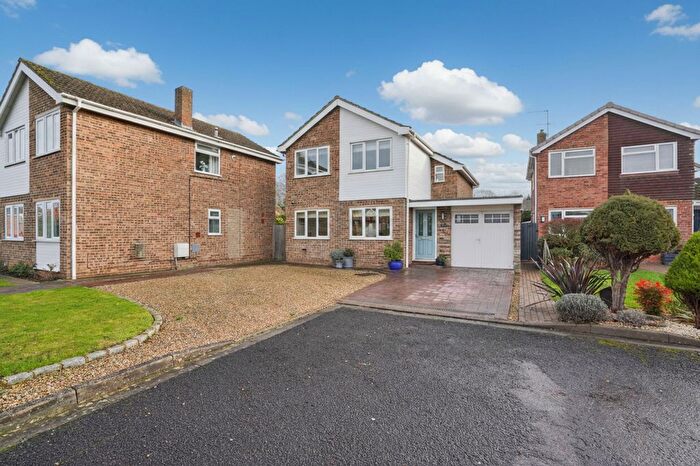
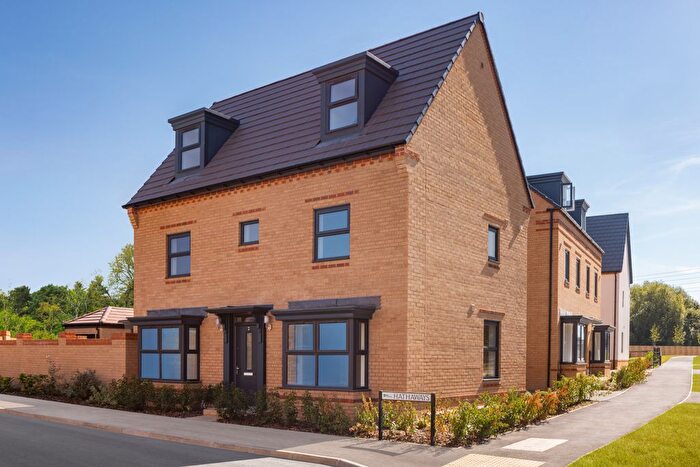
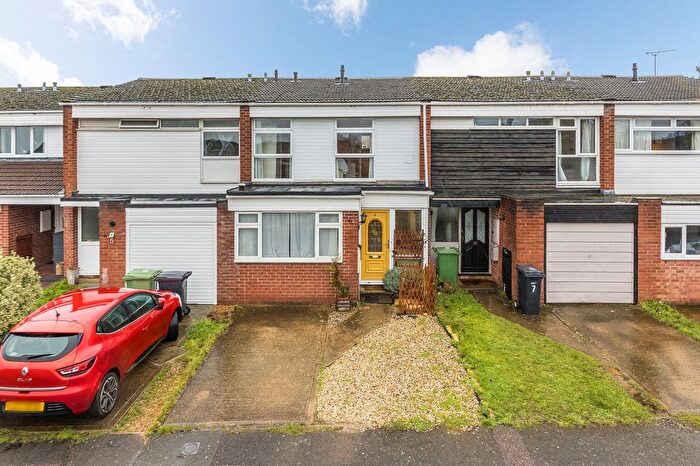
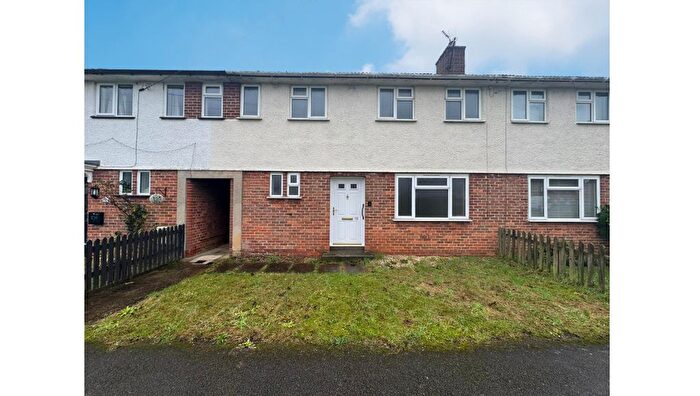
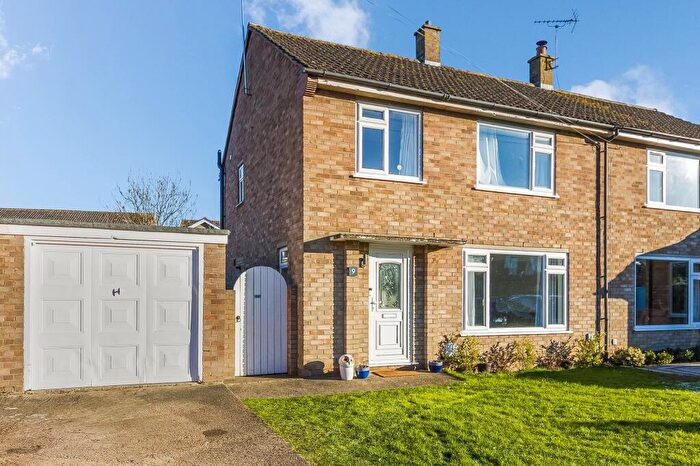
Properties for sale in Abingdon Northcourt
Roads and Postcodes in Abingdon Northcourt
Navigate through our locations to find the location of your next house in Abingdon Northcourt, Abingdon for sale or to rent.
| Streets | Postcodes |
|---|---|
| Appleford Drive | OX14 2AQ OX14 2BT OX14 2BU OX14 2BX OX14 2BZ OX14 2DA |
| Ashenden Close | OX14 1QE |
| Borough Walk | OX14 1HW |
| Bowyer Road | OX14 2EP OX14 2EW |
| Boxhill Road | OX14 2EL OX14 2ET OX14 2EU |
| Boxhill Walk | OX14 1HD |
| Brookside | OX14 1PD |
| Buscot Drive | OX14 2BJ OX14 2BL |
| Cheyney Walk | OX14 1HN |
| Childrey Way | OX14 2DG |
| Chilton Close | OX14 2AP |
| Clevelands | OX14 2EG OX14 2EQ |
| Compton Drive | OX14 2DD OX14 2DF |
| Culham Close | OX14 2AS |
| Darrell Way | OX14 1HG OX14 1HL OX14 1HQ |
| Dorchester Crescent | OX14 2AH |
| Fairfield Place | OX14 1HA |
| Finmore Close | OX14 1HF |
| Galley Field | OX14 3RS OX14 3RT OX14 3RU |
| Garford Close | OX14 2BY |
| Geoffrey Barbour Road | OX14 2ER OX14 2ES |
| Harcourt Way | OX14 1NU OX14 1NX |
| Harwell Close | OX14 2AR |
| Hendred Way | OX14 2AN OX14 2AW |
| Herons Walk | OX14 1NY |
| Hunter Close | OX14 2PE |
| John Mason Road | OX14 2EN |
| Lammas Close | OX14 1PB |
| Lenthall Road | OX14 1HE |
| Lyford Way | OX14 2DE |
| Lyon Close | OX14 1PT |
| Mattock Way | OX14 2PB OX14 2PD OX14 2PQ |
| Norman Avenue | OX14 2HJ OX14 2HL OX14 2HQ |
| Northcourt Lane | OX14 1PN OX14 1QA |
| Northcourt Mews | OX14 1GW |
| Northcourt Road | OX14 1NN OX14 1NR OX14 1NS OX14 1PJ OX14 1PL OX14 1PW |
| Northcourt Walk | OX14 2EJ |
| Oxford Road | OX14 2AA OX14 2AB OX14 2AD OX14 2ED OX14 2EE |
| Radley Road | OX14 3PL OX14 3PN OX14 3PR OX14 3RP OX14 3RX OX14 3SG |
| Rainbow Way | OX14 2PF |
| Rutherford Close | OX14 2AT |
| Sadlers Court | OX14 2PA |
| Shelley Close | OX14 1PP OX14 1PR |
| St Johns Road | OX14 2HA |
| St Marys Green | OX14 1HJ |
| St Nicholas Green | OX14 1HH |
| Staniland Court | OX14 1QZ |
| Summer Fields | OX14 2PG |
| Swinburne Road | OX14 2HD OX14 2HE OX14 2HF OX14 2HG |
| Tatham Road | OX14 1QB OX14 1QD |
| The Grove | OX14 2DQ |
| Upton Close | OX14 2AL |
| Warwick Close | OX14 2HN |
| Welford Gardens | OX14 2BH OX14 2BN OX14 2BP OX14 2BW |
| Whitelock Road | OX14 1NZ OX14 1PA |
Transport near Abingdon Northcourt
- FAQ
- Price Paid By Year
- Property Type Price
Frequently asked questions about Abingdon Northcourt
What is the average price for a property for sale in Abingdon Northcourt?
The average price for a property for sale in Abingdon Northcourt is £440,722. This amount is 0.9% lower than the average price in Abingdon. There are 1,775 property listings for sale in Abingdon Northcourt.
What streets have the most expensive properties for sale in Abingdon Northcourt?
The streets with the most expensive properties for sale in Abingdon Northcourt are Norman Avenue at an average of £1,054,037, Tatham Road at an average of £769,333 and St Johns Road at an average of £760,000.
What streets have the most affordable properties for sale in Abingdon Northcourt?
The streets with the most affordable properties for sale in Abingdon Northcourt are Sadlers Court at an average of £213,571, Staniland Court at an average of £256,750 and St Marys Green at an average of £270,000.
Which train stations are available in or near Abingdon Northcourt?
Some of the train stations available in or near Abingdon Northcourt are Radley, Culham and Appleford.
Property Price Paid in Abingdon Northcourt by Year
The average sold property price by year was:
| Year | Average Sold Price | Price Change |
Sold Properties
|
|---|---|---|---|
| 2025 | £388,090 | -19% |
33 Properties |
| 2024 | £462,595 | 3% |
74 Properties |
| 2023 | £448,231 | 3% |
54 Properties |
| 2022 | £436,842 | 7% |
74 Properties |
| 2021 | £407,639 | -0,2% |
66 Properties |
| 2020 | £408,266 | 11% |
66 Properties |
| 2019 | £363,700 | -5% |
66 Properties |
| 2018 | £382,706 | 0,4% |
57 Properties |
| 2017 | £381,051 | 4% |
77 Properties |
| 2016 | £366,922 | 6% |
60 Properties |
| 2015 | £343,628 | 10% |
84 Properties |
| 2014 | £310,975 | 6% |
71 Properties |
| 2013 | £292,134 | -11% |
64 Properties |
| 2012 | £324,761 | 9% |
80 Properties |
| 2011 | £295,042 | 0,2% |
64 Properties |
| 2010 | £294,470 | 21% |
55 Properties |
| 2009 | £233,603 | -22% |
69 Properties |
| 2008 | £285,640 | -1% |
58 Properties |
| 2007 | £287,335 | 14% |
93 Properties |
| 2006 | £247,271 | 17% |
84 Properties |
| 2005 | £204,689 | -3% |
63 Properties |
| 2004 | £211,141 | -8% |
113 Properties |
| 2003 | £227,078 | 26% |
61 Properties |
| 2002 | £169,007 | 10% |
98 Properties |
| 2001 | £151,479 | 8% |
81 Properties |
| 2000 | £139,316 | 23% |
65 Properties |
| 1999 | £106,812 | 5% |
80 Properties |
| 1998 | £101,269 | 15% |
64 Properties |
| 1997 | £85,798 | 6% |
74 Properties |
| 1996 | £80,757 | 8% |
67 Properties |
| 1995 | £74,028 | - |
67 Properties |
Property Price per Property Type in Abingdon Northcourt
Here you can find historic sold price data in order to help with your property search.
The average Property Paid Price for specific property types in the last three years are:
| Property Type | Average Sold Price | Sold Properties |
|---|---|---|
| Semi Detached House | £417,969.00 | 89 Semi Detached Houses |
| Detached House | £687,842.00 | 49 Detached Houses |
| Terraced House | £400,907.00 | 61 Terraced Houses |
| Flat | £228,083.00 | 36 Flats |

