Houses for sale & to rent in Hendreds, Abingdon
House Prices in Hendreds
Properties in Hendreds have an average house price of £463,083.00 and had 107 Property Transactions within the last 3 years¹.
Hendreds is an area in Abingdon, Oxfordshire with 810 households², where the most expensive property was sold for £1,750,000.00.
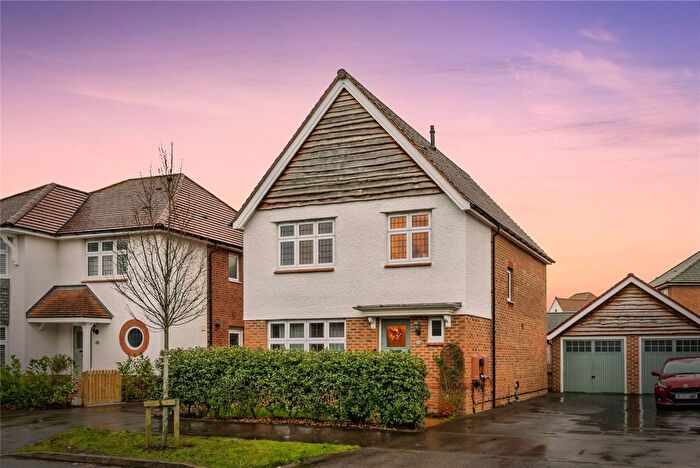
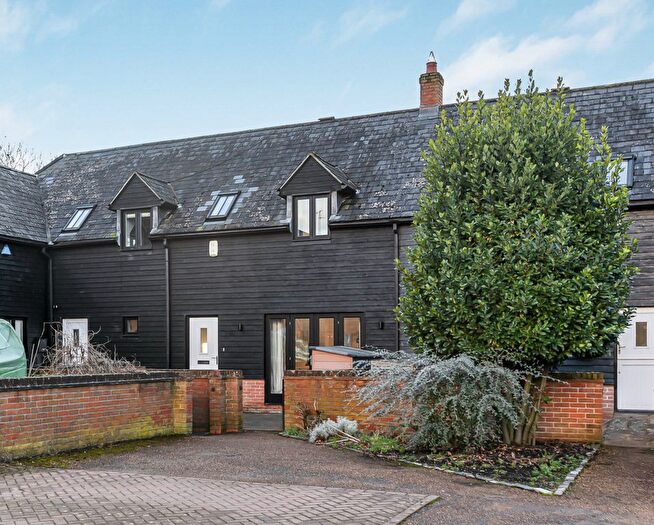
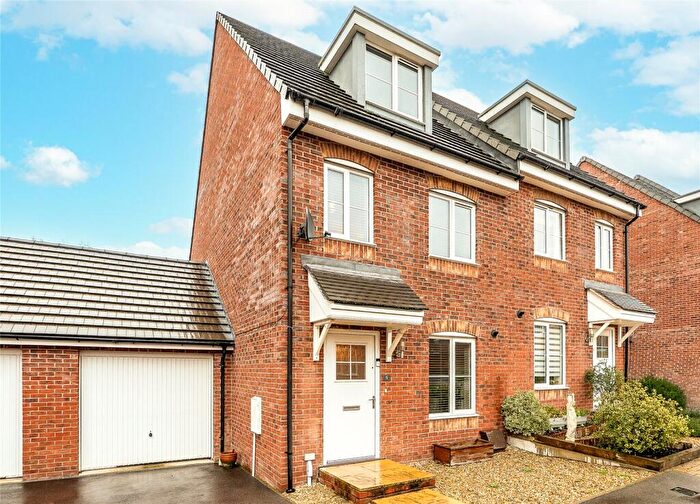
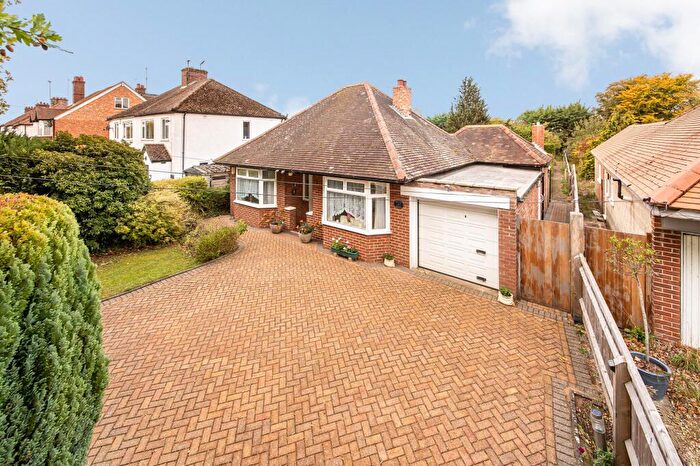
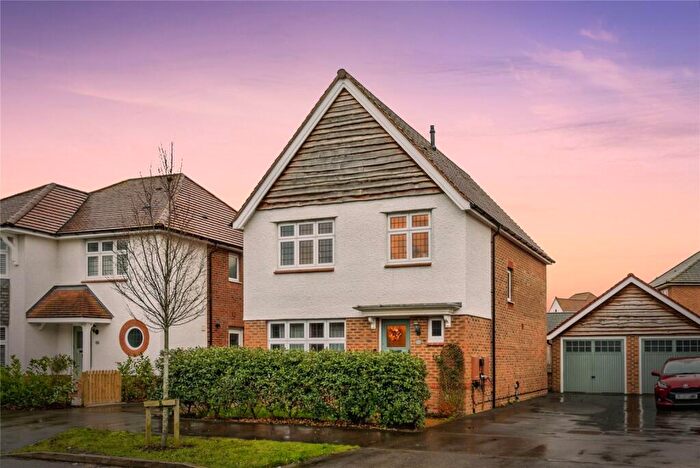
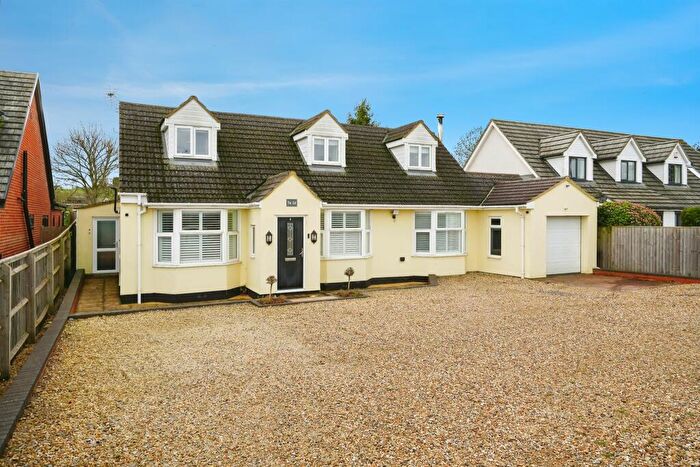
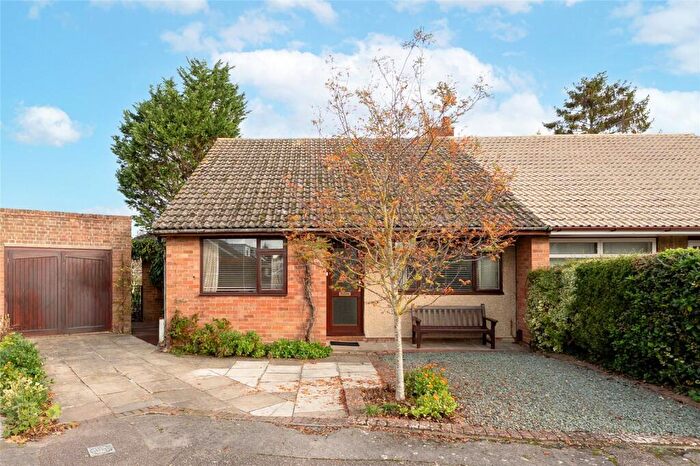
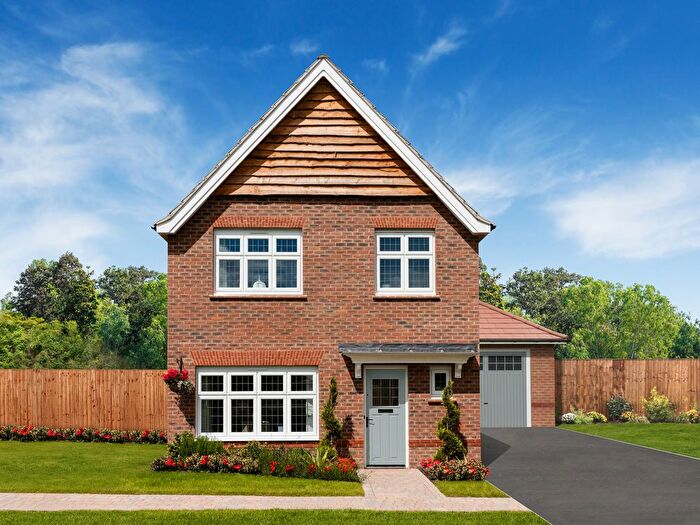
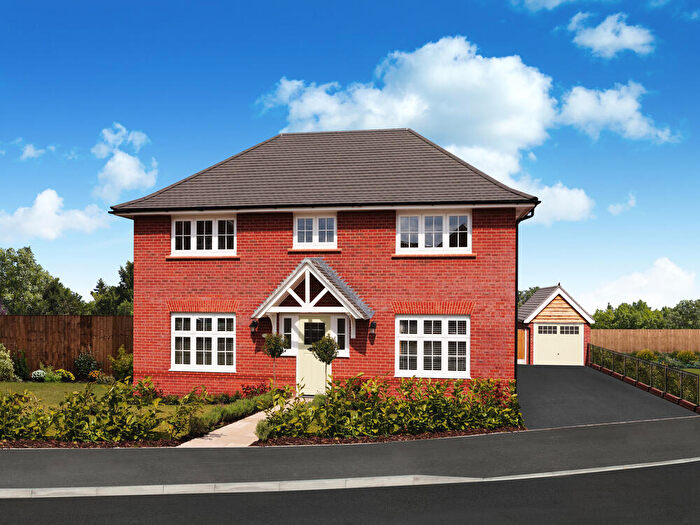
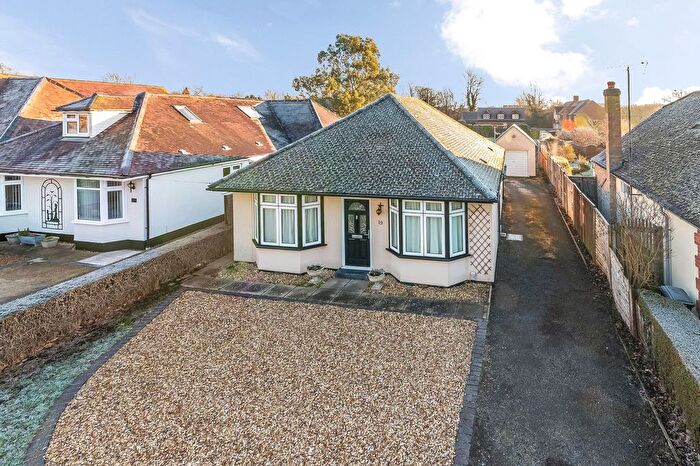
Properties for sale in Hendreds
Roads and Postcodes in Hendreds
Navigate through our locations to find the location of your next house in Hendreds, Abingdon for sale or to rent.
| Streets | Postcodes |
|---|---|
| Abingdon Road | OX13 6RW |
| Barnett Road | OX13 6AJ |
| Bartlett Place | OX14 4BG |
| Beetham Close | OX13 6GP |
| Brewer Close | OX13 6SX |
| Castle Street | OX13 6SR |
| Chadwick Avenue | OX13 6HY OX13 6RJ |
| Comice Way | OX14 4BU |
| Dalton Close | OX13 6GY |
| Duke Of York Avenue | OX14 4DU |
| Field Gardens | OX13 6TE OX13 6TF |
| Franks Lane | OX13 6SF |
| Grandy Crescent | OX13 6GL |
| Graydon Close | OX13 6GQ |
| Hanney Road | OX13 6AH OX13 6AL OX13 6AN OX13 6AP OX13 6AQ |
| Havers Avenue | OX14 4DZ |
| High Street | OX13 6RS OX13 6RZ |
| Lambe Avenue | OX14 4DT |
| Mackenzie Avenue | OX14 4LS |
| Mere Dyke Road | OX13 6AX |
| Midwinter Avenue | OX14 4XA OX14 4XB OX14 4XD |
| Mill Street | OX13 6SP |
| Milton Heights | OX14 4DR |
| Milton Hill | OX13 6AB OX13 6AG OX13 6BD OX14 4DP OX13 6AD OX13 6AE OX13 6AF |
| Milton Lane | OX13 6SA |
| Mitchell Way | OX13 6GH OX13 6GJ |
| Newall Close | OX13 6RT |
| North Way | OX13 6AY |
| Pugsden Lane | OX13 6RY |
| Pulford Way | OX13 6GN |
| Russet Drive | OX14 4BF |
| School Close | OX13 6AZ |
| Squire Lane | OX13 6GR |
| St Michaels Way | OX13 6BA |
| Station Approach | OX13 6RU |
| Station Yard | OX13 6RX |
| Steventon Hill | OX13 6AA |
| Stirrup Way | OX13 6GS |
| Stocks Lane | OX13 6SG OX13 6SS |
| Stonebridge Road | OX13 6AS OX13 6AU |
| Tatlings Road | OX13 6AT |
| Tedder Close | OX13 6TD |
| The Causeway | OX13 6SE OX13 6SJ OX13 6SQ |
| The Green | OX13 6RP OX13 6RR |
| The Lanterns | OX13 6FA |
| Timsbury Court | OX13 6FB |
| Torpy Close | OX13 6GZ |
| Trenchard Avenue | OX14 4DS |
| Vicarage Road | OX13 6SL |
Transport near Hendreds
- FAQ
- Price Paid By Year
- Property Type Price
Frequently asked questions about Hendreds
What is the average price for a property for sale in Hendreds?
The average price for a property for sale in Hendreds is £463,083. This amount is 5% higher than the average price in Abingdon. There are 894 property listings for sale in Hendreds.
What streets have the most expensive properties for sale in Hendreds?
The streets with the most expensive properties for sale in Hendreds are The Green at an average of £1,336,000, Vicarage Road at an average of £609,100 and Castle Street at an average of £572,500.
What streets have the most affordable properties for sale in Hendreds?
The streets with the most affordable properties for sale in Hendreds are Field Gardens at an average of £195,000, Midwinter Avenue at an average of £252,450 and Duke Of York Avenue at an average of £260,000.
Which train stations are available in or near Hendreds?
Some of the train stations available in or near Hendreds are Didcot Parkway, Appleford and Culham.
Property Price Paid in Hendreds by Year
The average sold property price by year was:
| Year | Average Sold Price | Price Change |
Sold Properties
|
|---|---|---|---|
| 2025 | £507,961 | 12% |
27 Properties |
| 2024 | £445,231 | -1% |
40 Properties |
| 2023 | £450,642 | -0,3% |
40 Properties |
| 2022 | £452,073 | -10% |
40 Properties |
| 2021 | £496,937 | 15% |
37 Properties |
| 2020 | £420,744 | 4% |
76 Properties |
| 2019 | £405,982 | 24% |
61 Properties |
| 2018 | £310,576 | -10% |
26 Properties |
| 2017 | £342,636 | -7% |
29 Properties |
| 2016 | £364,950 | -2% |
26 Properties |
| 2015 | £372,179 | 25% |
34 Properties |
| 2014 | £278,151 | -6% |
41 Properties |
| 2013 | £294,620 | -13% |
34 Properties |
| 2012 | £331,888 | -5% |
18 Properties |
| 2011 | £348,666 | 3% |
24 Properties |
| 2010 | £338,797 | -5% |
20 Properties |
| 2009 | £355,195 | 23% |
21 Properties |
| 2008 | £272,928 | 9% |
14 Properties |
| 2007 | £249,269 | 3% |
39 Properties |
| 2006 | £241,971 | 8% |
53 Properties |
| 2005 | £223,665 | 8% |
44 Properties |
| 2004 | £205,277 | 14% |
35 Properties |
| 2003 | £176,696 | -9% |
38 Properties |
| 2002 | £193,337 | 15% |
37 Properties |
| 2001 | £164,531 | 19% |
58 Properties |
| 2000 | £132,884 | 7% |
67 Properties |
| 1999 | £123,261 | 23% |
71 Properties |
| 1998 | £94,647 | 8% |
37 Properties |
| 1997 | £86,879 | - |
47 Properties |
| 1996 | £86,895 | 12% |
40 Properties |
| 1995 | £76,861 | - |
31 Properties |
Property Price per Property Type in Hendreds
Here you can find historic sold price data in order to help with your property search.
The average Property Paid Price for specific property types in the last three years are:
| Property Type | Average Sold Price | Sold Properties |
|---|---|---|
| Semi Detached House | £407,766.00 | 31 Semi Detached Houses |
| Detached House | £559,696.00 | 58 Detached Houses |
| Terraced House | £285,431.00 | 11 Terraced Houses |
| Flat | £186,714.00 | 7 Flats |

