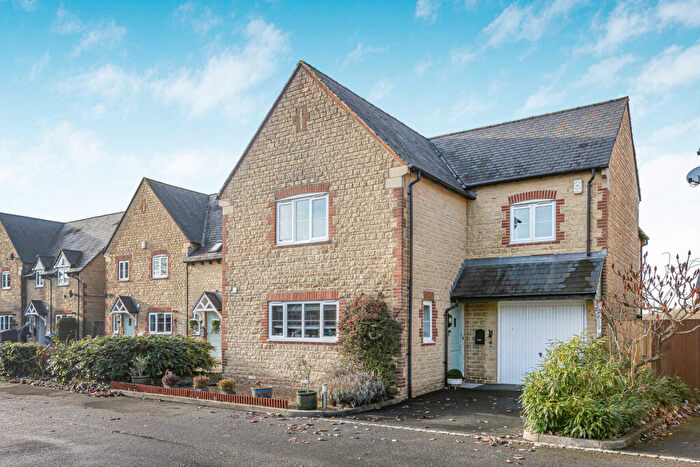
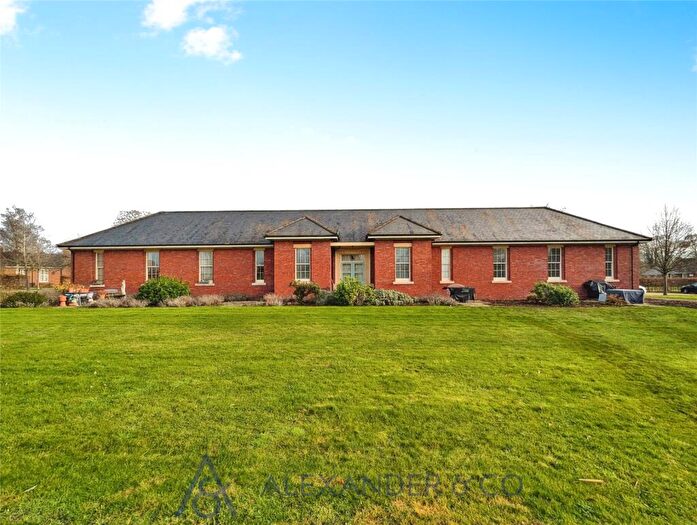
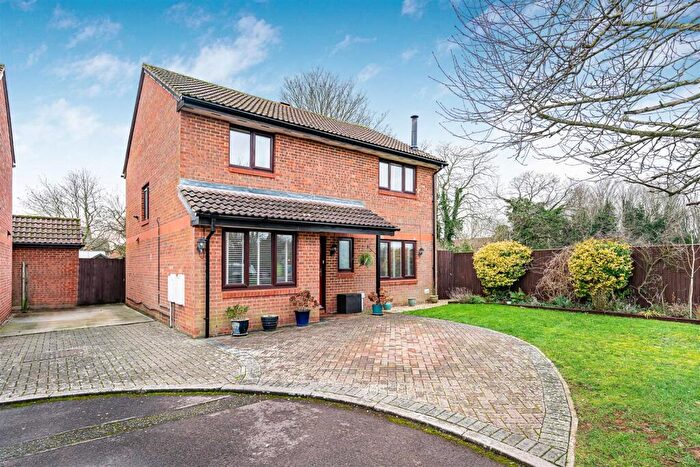
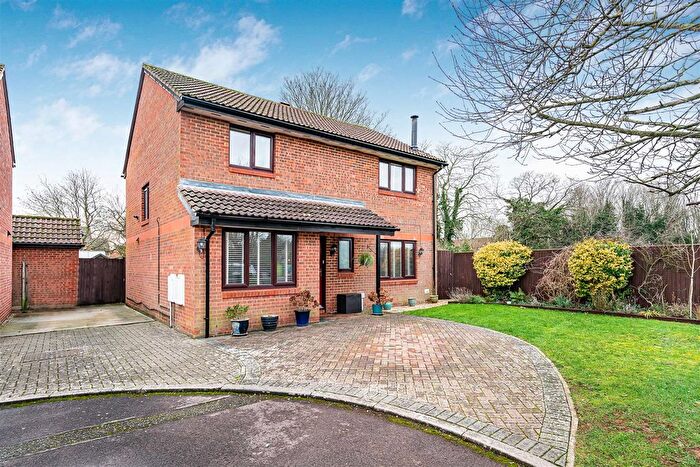
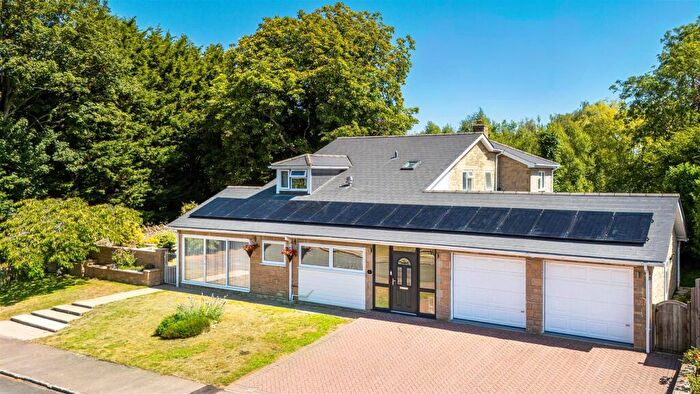
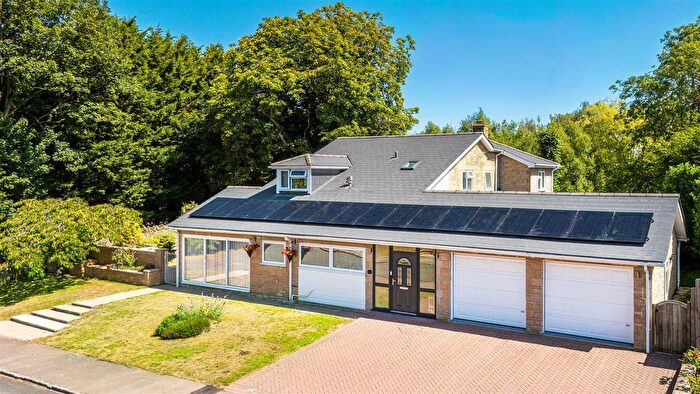
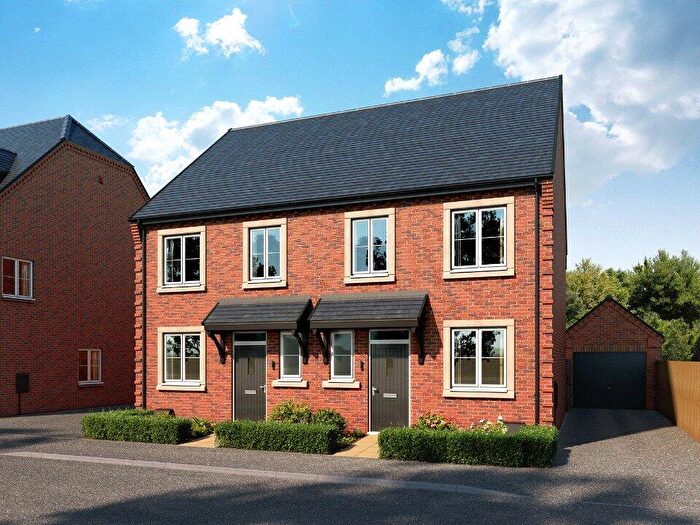
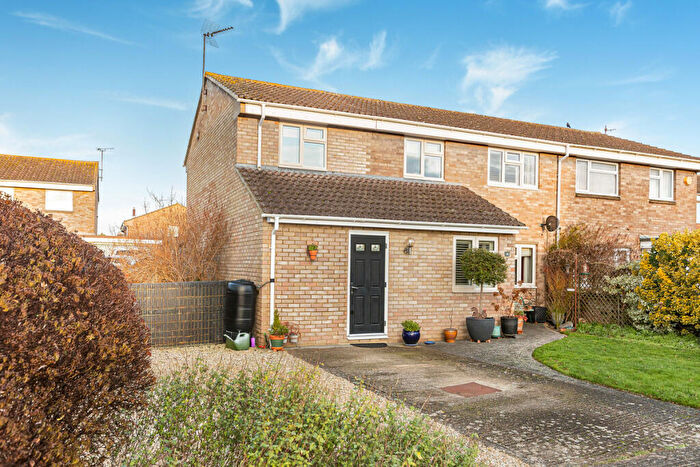
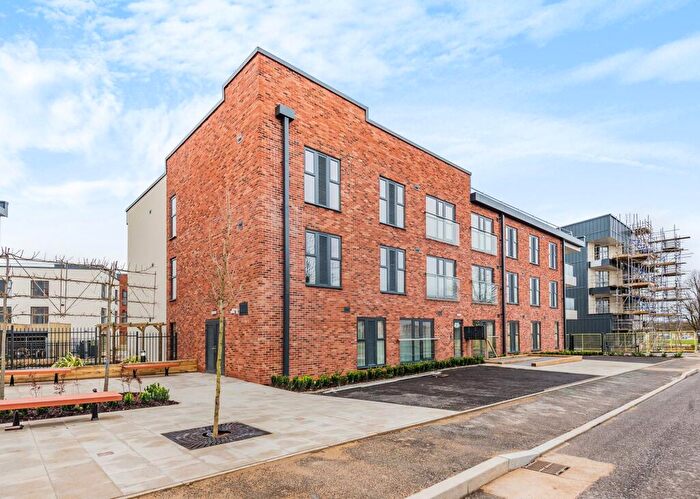
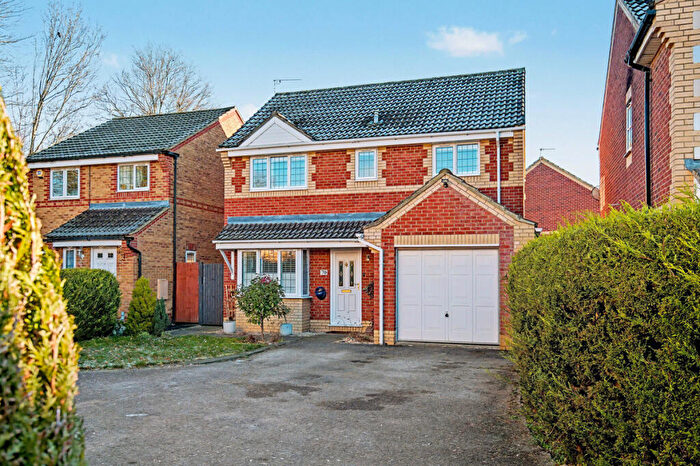
Houses for sale & to rent in Fringford and Heyfords, Bicester
House Prices in Fringford and Heyfords
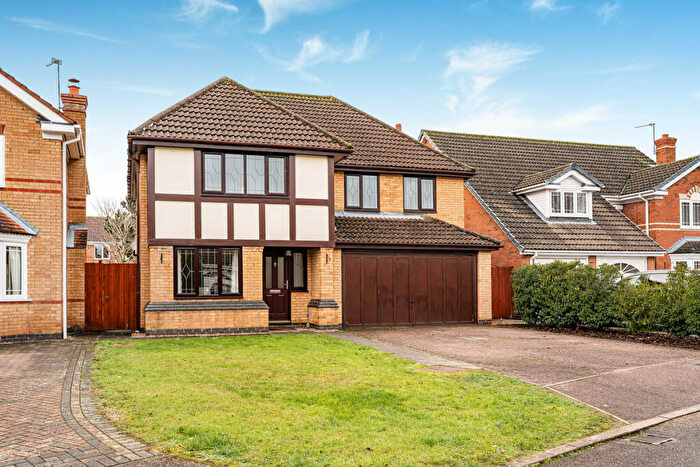
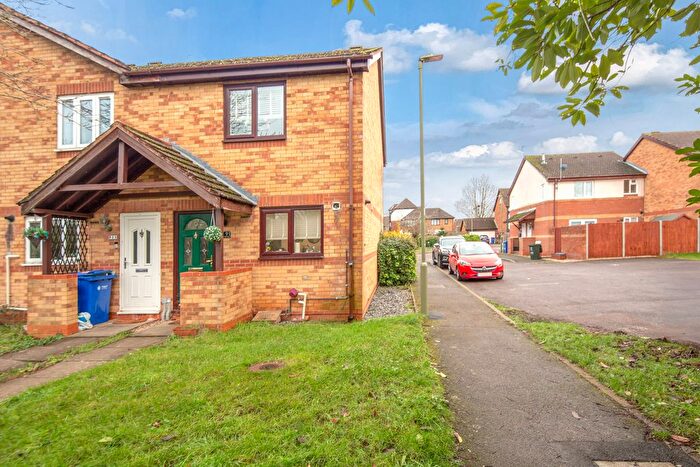
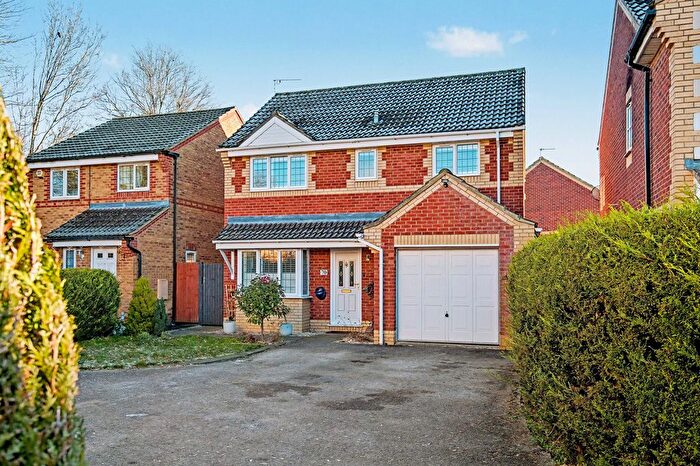
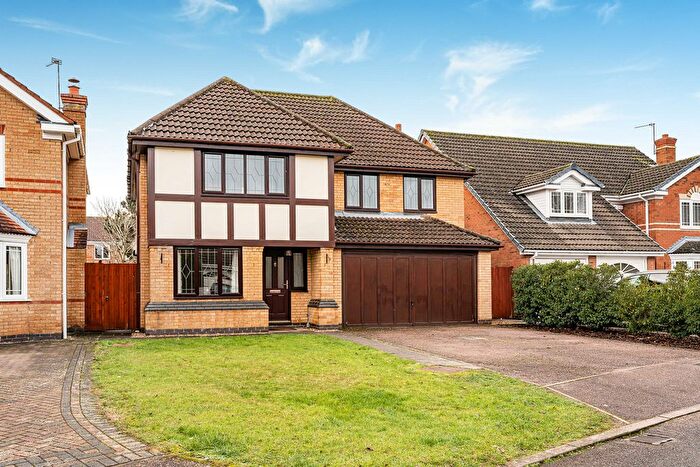
Properties in Fringford and Heyfords have an average house price of £604,305.00 and had 179 Property Transactions within the last 3 years¹.
Fringford and Heyfords is an area in Bicester, Oxfordshire with 506 households², where the most expensive property was sold for £31,500,000.00.
Properties for sale in Fringford and Heyfords
Roads and Postcodes in Fringford and Heyfords
Navigate through our locations to find the location of your next house in Fringford and Heyfords, Bicester for sale or to rent.
| Streets | Postcodes |
|---|---|
| Northampton Road | OX27 7RD |
| Allen Row | OX25 5BH |
| Amott Road | OX25 5BJ |
| Ardley Road | OX27 7AD OX27 7HW |
| Augustan Road | OX26 1BB |
| Bader Drive | OX25 5TN |
| Bainton Road | OX27 7LS |
| Barrat Road | OX25 5BQ |
| Bayliss Drive | OX25 5AY |
| Baynards Green | OX27 7SR |
| Bicester Road | OX27 7LP OX27 7NE OX27 7NF OX27 9BS |
| Bourne End | OX25 5AE |
| Brice Road | OX25 5TE |
| Brimstone Close | OX25 2DY |
| Broad Way | OX25 5AD |
| Camp Road | OX25 5AG OX25 5BP OX25 5BS OX25 5BZ OX25 5LU OX25 5DP |
| Carswell Circle | OX25 5TX OX25 5TY |
| Charles Shouler Way | OX25 2DS |
| Chatham Close | OX25 5DD |
| Cherry Close | OX27 9AW |
| Cheshire Drive | OX25 5TQ |
| Chesterton Court | OX26 1UP |
| Chesterton Fields | OX26 1TB |
| Cooper Close | OX25 5AZ |
| Corbett Close | OX25 5AS |
| Dacey Drive | OX25 5AA |
| Dale Way | OX25 5BA |
| Dards Road | OX25 5DT |
| Dow Street | OX25 5TD |
| Eady Road | OX25 5TU |
| East Castle Street | OX25 5BW |
| Flavian Close | OX26 1DF |
| Freehold Street | OX25 5NP |
| Frost Court | OX25 5AT |
| Fynn Court | OX25 5AR |
| Geminus Road | OX26 1BJ |
| Gibson Drive | OX25 5TJ |
| Goldman Drive | OX25 5AW |
| Gordon Road | OX25 5TF |
| Hampden Square | OX25 5AH OX25 5AJ |
| Harris Road | OX25 5LZ OX25 5TR |
| Hart Walk | OX25 5AF |
| Heyford Leys | OX25 5LX |
| Heyford Park | OX25 5HA OX25 5HD OX25 5HE OX25 5HJ OX25 5DQ |
| Heyford Road | OX25 5LA |
| Homestead Crescent | OX25 5DL |
| Howard Road | OX25 5BD |
| Hunter Street | OX25 5DE |
| Izzard Road | OX25 5AB |
| James Close | OX25 5BF |
| Keele Close | OX25 5AU |
| Kirtlington Road | OX26 1TG |
| Lally Drive | OX25 5BN |
| Lander Close | OX26 1DH |
| Lincoln Road | OX25 5DH |
| Lindh Road | OX25 5BT |
| Main Road | OX27 7PE |
| Main Street | OX27 8EB |
| Mansfield Yard | OX27 8DN |
| Maunde Close | OX26 1DJ |
| Mcguire Road | OX25 5DU |
| Middleton Park | OX25 4AG OX25 4AH OX25 4AJ OX25 4JF OX25 4JG |
| Middleton Stoney Road | OX27 7AA |
| Mill Road | OX27 9BL |
| Miller Close | OX25 5AQ |
| Nash Road | OX25 5BL |
| Nettleton Drive | OX25 5TP |
| Norreys Drive | OX26 1DL |
| Offutt Drive | OX25 5BU |
| Ower Drive | OX25 5DS |
| Oxford Road | OX25 2NY |
| Peacock Road | OX25 2DT |
| Penrose Gardens | OX26 1DG |
| Portal Drive North | OX25 5TH |
| Portal Drive South | OX25 5TT |
| Raven Close | OX25 5AN |
| Reid Place | OX25 5TW |
| Ringlet Close | OX25 2DU |
| Roper Road | OX25 5TS |
| Schilling Street | OX25 5DA |
| School Lane | OX25 4GX OX27 8RX |
| Shelswell Park | OX27 8EG OX27 8EH OX27 8EQ |
| Simpson Drive | OX25 5BB |
| Soden Road | OX25 5LR |
| Stableford Lane | OX26 1EH |
| Station Road | OX25 5PB |
| Stoke Lyne Road | OX27 9AU |
| Stratton Audley Park | OX27 9AD OX27 9AH |
| Stratton Audley Road | OX27 8FT OX27 8SA |
| Stratton Road | OX27 8RT |
| Tait Drive | OX25 5TL |
| The Street | OX27 8SE |
| Trenchard Circle | OX25 5TB |
| Tusmore Park | OX27 7SN OX27 7SP OX27 7SW |
| Valley View | OX25 5PQ |
| Vespasian Way | OX26 1BA |
| Walker Road | OX25 5BG |
| Wellesley Close | OX25 5AP |
| Wellington Road | OX25 5AL |
| Wendlebury Road | OX25 2PA |
| West Castle Street | OX25 5BX |
| Westover Street | OX25 5BY |
| Whitley Drive | OX25 5TG |
| Williams Road | OX25 5AX |
| Wilson Close | OX25 5BE |
| OX25 4AB OX25 4AP OX25 4TA OX25 4TB OX26 1TA OX26 1TD OX26 1TF OX26 1TH OX26 1TW OX26 1UH OX26 1UY OX26 1XA OX27 7HP OX27 7HR OX27 7NH OX27 7PH OX27 7PJ OX27 7SH OX27 7SJ OX27 8AG OX27 8AP OX27 8AR OX27 8AW OX27 8DU OX27 8EE OX27 8EF OX27 8RH OX27 8RR OX27 8SF OX27 8ST OX27 8SU OX27 8UT OX27 9AB OX27 9AE OX27 9AJ OX27 7AG |
Transport near Fringford and Heyfords
- FAQ
- Price Paid By Year
- Property Type Price
Frequently asked questions about Fringford and Heyfords
What is the average price for a property for sale in Fringford and Heyfords?
The average price for a property for sale in Fringford and Heyfords is £604,305. This amount is 51% higher than the average price in Bicester. There are 6,222 property listings for sale in Fringford and Heyfords.
What streets have the most expensive properties for sale in Fringford and Heyfords?
The streets with the most expensive properties for sale in Fringford and Heyfords are Hampden Square at an average of £4,214,125, Howard Road at an average of £672,500 and Penrose Gardens at an average of £596,375.
What streets have the most affordable properties for sale in Fringford and Heyfords?
The streets with the most affordable properties for sale in Fringford and Heyfords are Allen Row at an average of £135,000, Nash Road at an average of £239,571 and West Castle Street at an average of £247,800.
Which train stations are available in or near Fringford and Heyfords?
Some of the train stations available in or near Fringford and Heyfords are Bicester North, Bicester Village and Heyford.
Property Price Paid in Fringford and Heyfords by Year
The average sold property price by year was:
| Year | Average Sold Price | Price Change |
Sold Properties
|
|---|---|---|---|
| 2025 | £430,734 | 0,4% |
16 Properties |
| 2024 | £428,820 | -201% |
47 Properties |
| 2023 | £1,291,956 | 67% |
36 Properties |
| 2022 | £432,673 | -2% |
80 Properties |
| 2021 | £442,403 | -5% |
116 Properties |
| 2020 | £465,668 | 18% |
51 Properties |
| 2019 | £380,256 | -8% |
102 Properties |
| 2018 | £410,083 | 4% |
56 Properties |
| 2017 | £393,555 | 11% |
76 Properties |
| 2016 | £350,712 | -13% |
150 Properties |
| 2015 | £394,552 | -2% |
82 Properties |
| 2014 | £402,788 | 13% |
22 Properties |
| 2010 | £350,000 | 14% |
1 Property |
| 2006 | £302,416 | 17% |
6 Properties |
| 2002 | £249,950 | 63% |
1 Property |
| 1995 | £91,500 | - |
1 Property |
Property Price per Property Type in Fringford and Heyfords
Here you can find historic sold price data in order to help with your property search.
The average Property Paid Price for specific property types in the last three years are:
| Property Type | Average Sold Price | Sold Properties |
|---|---|---|
| Semi Detached House | £769,629.00 | 77 Semi Detached Houses |
| Detached House | £601,870.00 | 56 Detached Houses |
| Terraced House | £340,618.00 | 41 Terraced Houses |
| Flat | £247,800.00 | 5 Flats |

