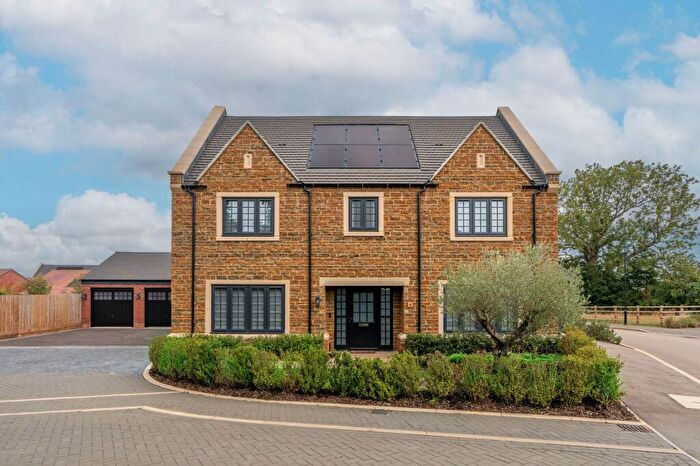
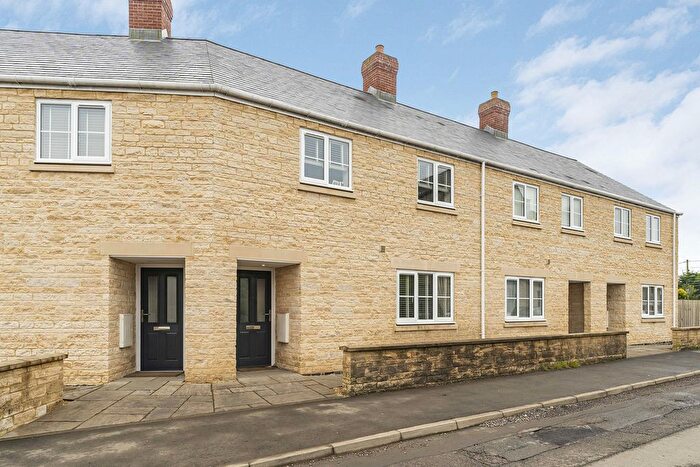
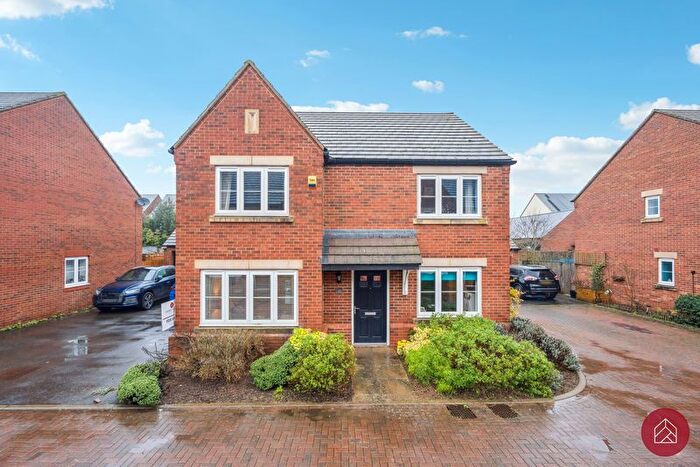
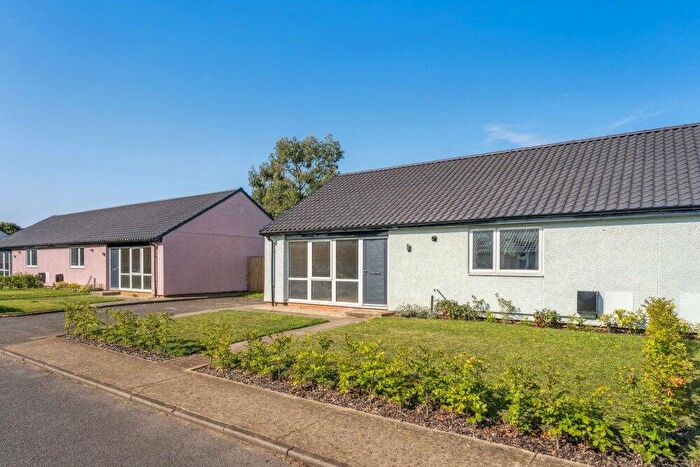
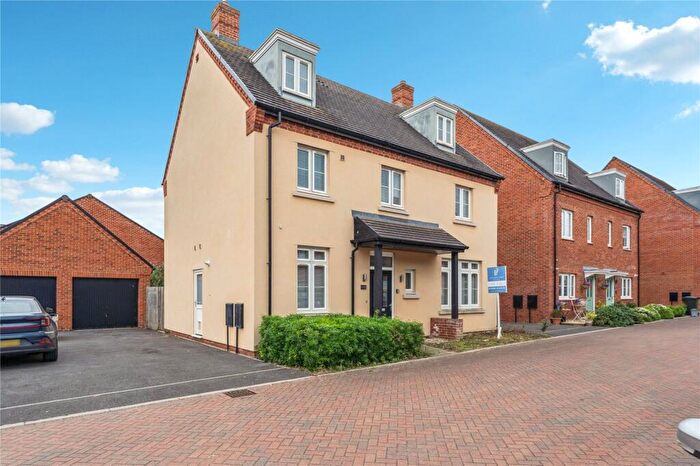
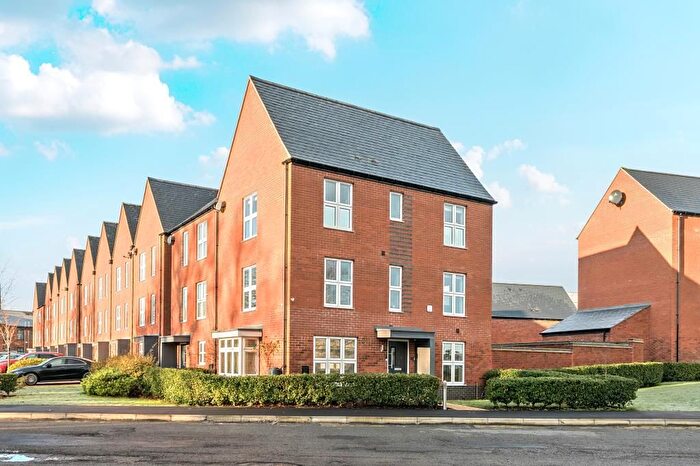
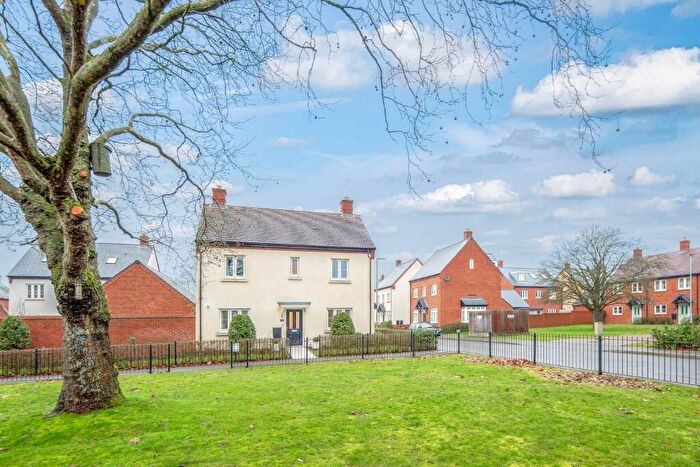
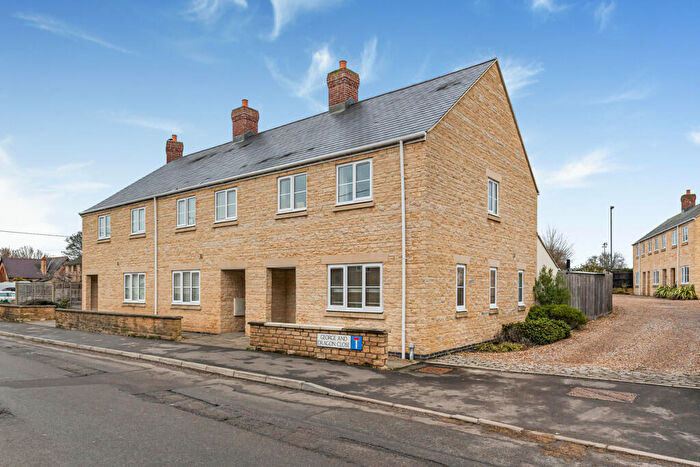
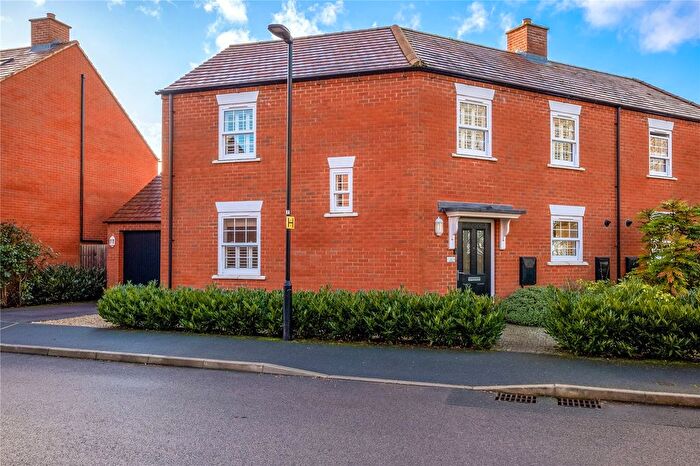
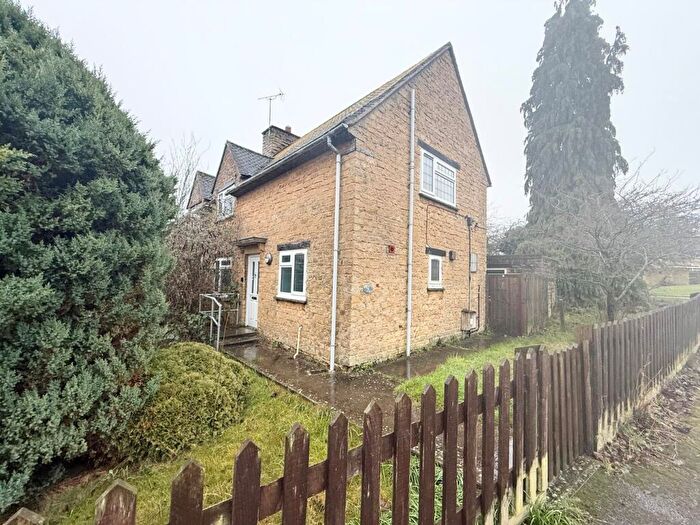
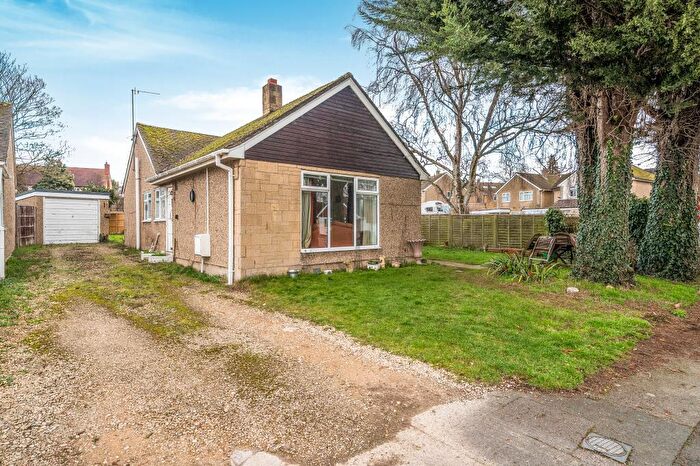
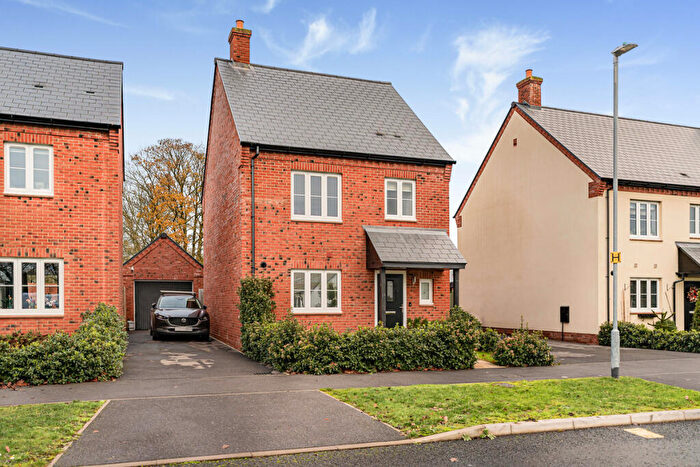
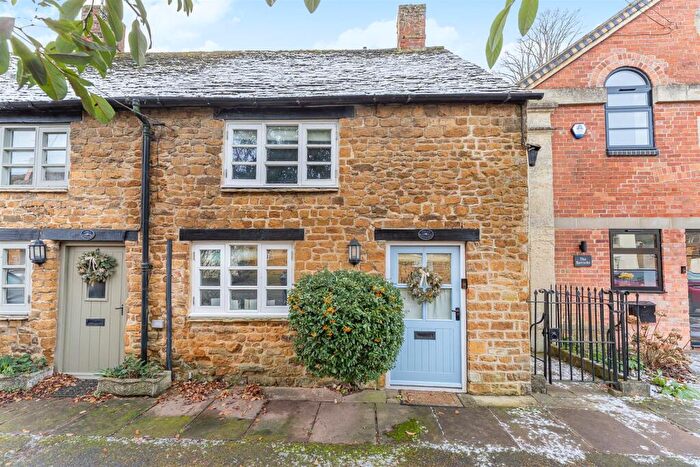
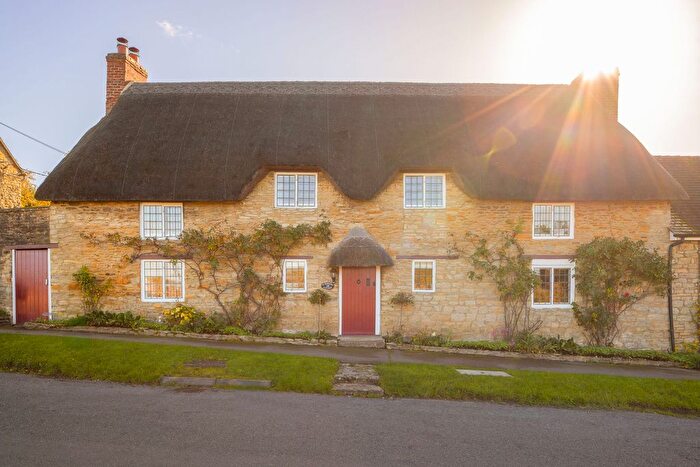
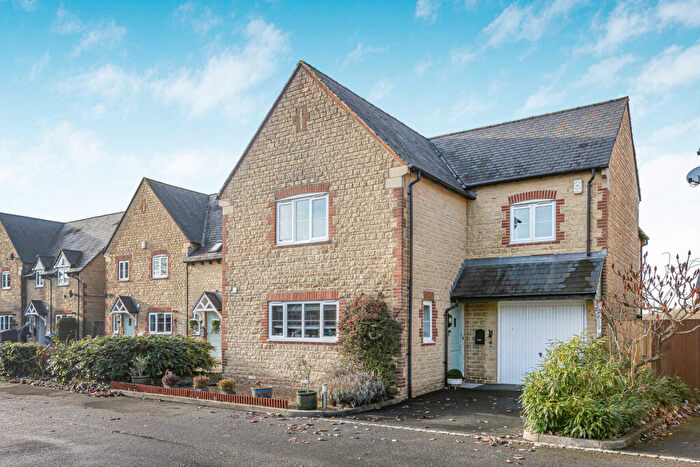
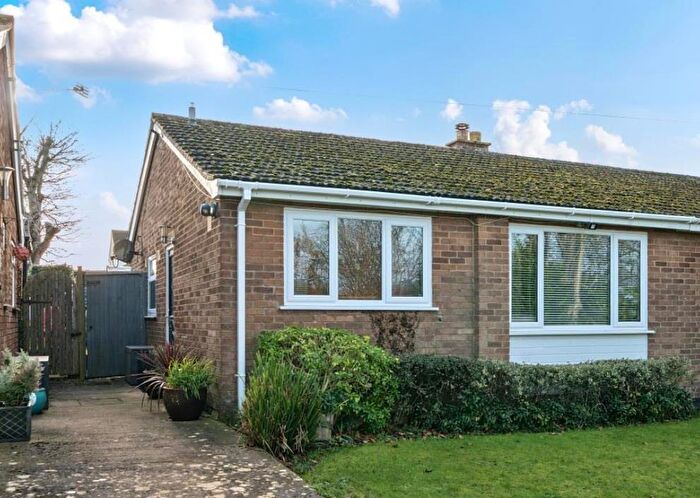
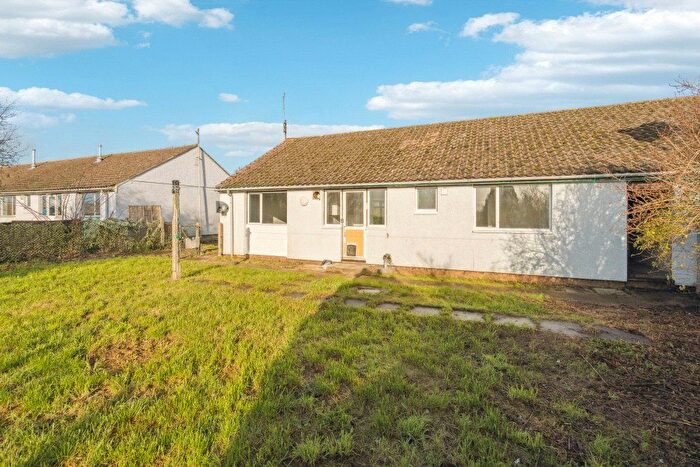
Houses for sale & to rent in The Astons And Heyfords, Bicester
House Prices in The Astons And Heyfords
Properties in The Astons And Heyfords have an average house price of £584,017.00 and had 147 Property Transactions within the last 3 years¹.
The Astons And Heyfords is an area in Bicester, Oxfordshire with 1,550 households², where the most expensive property was sold for £2,175,000.00.
Properties for sale in The Astons And Heyfords
Roads and Postcodes in The Astons And Heyfords
Navigate through our locations to find the location of your next house in The Astons And Heyfords, Bicester for sale or to rent.
| Streets | Postcodes |
|---|---|
| Allens Lane | OX25 5NQ |
| Ardley Road | OX25 6LP |
| Aston View | OX25 6NH OX25 6NP |
| Bates Lane | OX27 7JT OX27 7JU |
| Bovewell | OX27 7JB |
| Bradshaw Close | OX25 4SA |
| Bromeswell Close | OX25 5NU |
| Camp Road | OX25 5LJ OX25 5LS |
| Chapel Row | OX27 7JR |
| Cherwell Bank | OX25 5NX |
| Church Lane | OX25 5NZ OX27 7JQ |
| Church Street | OX25 6NB |
| Church Walk | OX25 5LQ |
| College Square | OX25 5NG |
| Cotswold Court | OX27 7LQ |
| Cow Lane | OX25 4SG |
| Daisy Hill | OX25 6LB |
| Dane Hill | OX25 6JD OX25 6JE |
| Dashwood Rise | OX25 6JQ |
| Dovecote Lane | OX25 6NA |
| East Street | OX27 7PX OX27 7PZ OX27 7QF OX27 7QH |
| Fenway | OX25 4SS |
| Fewcott Road | OX27 7QA |
| Fewcott View | OX27 7QP |
| Field Court | OX25 6LD |
| Fir Lane | OX25 4SF |
| Forge Place | OX27 7QQ |
| Fox Lane | OX27 7JW |
| Foxhill Lane | OX27 7JZ |
| Freehold Street | OX25 5NS OX25 5NT |
| Fritwell Road | OX25 6NJ |
| Glebe Court | OX25 6JY |
| Grange Park | OX25 4SR |
| Greenway | OX25 4NF |
| Hall Close | OX25 6HR |
| Harrisville Lane | OX25 4RP |
| Heyford Road | OX25 4SH OX25 4SN OX25 4ST OX25 4SU OX25 6LN OX25 6LW |
| High Street | OX25 5LE OX25 5LL OX27 7JJ OX27 7JN OX27 7JP OX27 7LJ |
| Hill Farm Lane | OX25 6JH |
| Hodgson Close | OX27 7QB |
| Home Farm Lane | OX25 5PR |
| Hopcrofts Holt | OX25 5QQ |
| Jubilee Close | OX25 4RZ |
| Kathleen Cottages | OX25 5LN |
| Kirtlington Road | OX25 4NB OX25 5NA |
| Knaptons Croft | OX25 5NR |
| Larsen Road | OX25 5TA |
| Lawrence Fields | OX25 4SX |
| Longfields | OX25 6LA |
| Lower Heyford Road | OX25 4ND |
| Magnolia Cottage | OX25 6HU |
| Main Street | OX25 6JL |
| Market Square | OX25 5NY |
| Mays Close | OX27 7QN |
| Middle Barton Road | OX25 6JN |
| Mill Lane | OX25 5LH OX25 5PG |
| Nizewell Head | OX25 4SJ |
| North Aston Road | OX25 5QA OX25 6JF OX25 6JG |
| North Side | OX25 4SE |
| North Street | OX27 7QJ OX27 7QL OX27 7QR OX27 7QS OX27 7QX |
| Old School Lane | OX27 7PY |
| Orchard Lane | OX25 5LD |
| Orchard Place | OX25 5JX |
| Paines Hill | OX25 4SQ |
| Rising Hill | OX25 5LF |
| School Cottages | OX25 6HT |
| School Lane | OX25 5LT |
| Shepherds Hill | OX25 4TH |
| Somerton Road | OX25 5JU OX25 5LB OX25 6HX OX25 6HZ OX25 6JA |
| South Side | OX25 4RR OX25 4RT OX25 4RU OX25 4RY OX25 4SD |
| South Street | OX25 4NE |
| St Marys Walk | OX25 6AA |
| Station Road | OX25 5PD OX25 5PE OX25 5PF |
| The Crescent | OX25 4SL |
| The Dickredge | OX25 4RS |
| The Green | OX25 5LG |
| The Hill | OX27 7JE |
| The Lane | OX25 5PA OX27 7QW |
| The Paddocks | OX27 7LG |
| The Turnpike | OX27 7JA |
| Tower Farm Cottages | OX27 7HY |
| Town Well End | OX27 7QD |
| Troy Cottages | OX25 6NG |
| Walnut Rise | OX25 6LZ |
| Water Lane | OX25 4SB |
| Water Street | OX25 6NE |
| West View | OX25 6NQ |
| Wharf Lane | OX27 7LD |
| OX25 5PX OX25 5PY OX25 5PZ OX25 5RH OX25 6JR OX25 6JS OX25 6JT OX25 6JX OX25 6LL OX25 6LT OX25 6ND OX25 6NL OX27 7HS OX27 7HX OX27 7HZ OX27 7JD OX27 7JF OX27 7JH OX27 7JL OX27 7LA |
Transport near The Astons And Heyfords
-
Heyford Station
-
Tackley Station
-
King's Sutton Station
-
Bicester North Station
-
Bicester Village Station
-
Banbury Station
-
Islip Station
-
Combe Station
-
Hanborough Station
-
Oxford Parkway Station
- FAQ
- Price Paid By Year
- Property Type Price
Frequently asked questions about The Astons And Heyfords
What is the average price for a property for sale in The Astons And Heyfords?
The average price for a property for sale in The Astons And Heyfords is £584,017. This amount is 45% higher than the average price in Bicester. There are 1,028 property listings for sale in The Astons And Heyfords.
What streets have the most expensive properties for sale in The Astons And Heyfords?
The streets with the most expensive properties for sale in The Astons And Heyfords are Mill Lane at an average of £1,350,000, South Street at an average of £1,297,600 and Hopcrofts Holt at an average of £1,225,000.
What streets have the most affordable properties for sale in The Astons And Heyfords?
The streets with the most affordable properties for sale in The Astons And Heyfords are The Crescent at an average of £295,500, Nizewell Head at an average of £360,950 and Jubilee Close at an average of £362,500.
Which train stations are available in or near The Astons And Heyfords?
Some of the train stations available in or near The Astons And Heyfords are Heyford, Tackley and King's Sutton.
Property Price Paid in The Astons And Heyfords by Year
The average sold property price by year was:
| Year | Average Sold Price | Price Change |
Sold Properties
|
|---|---|---|---|
| 2025 | £620,670 | -6% |
39 Properties |
| 2024 | £655,249 | 29% |
60 Properties |
| 2023 | £465,198 | -49% |
48 Properties |
| 2022 | £691,254 | 26% |
50 Properties |
| 2021 | £509,108 | -2% |
102 Properties |
| 2020 | £516,750 | 21% |
53 Properties |
| 2019 | £408,197 | -15% |
49 Properties |
| 2018 | £469,290 | 2% |
62 Properties |
| 2017 | £458,028 | 1% |
50 Properties |
| 2016 | £452,127 | -0,1% |
55 Properties |
| 2015 | £452,750 | 6% |
73 Properties |
| 2014 | £427,657 | -5% |
69 Properties |
| 2013 | £448,710 | 12% |
64 Properties |
| 2012 | £393,421 | -4% |
45 Properties |
| 2011 | £407,650 | 5% |
51 Properties |
| 2010 | £386,842 | 15% |
54 Properties |
| 2009 | £329,677 | -10% |
45 Properties |
| 2008 | £363,182 | 3% |
46 Properties |
| 2007 | £353,803 | 1% |
102 Properties |
| 2006 | £351,720 | -1% |
99 Properties |
| 2005 | £355,483 | 9% |
66 Properties |
| 2004 | £324,651 | 12% |
80 Properties |
| 2003 | £284,261 | -0,2% |
76 Properties |
| 2002 | £284,888 | 29% |
90 Properties |
| 2001 | £203,127 | -14% |
103 Properties |
| 2000 | £230,959 | 14% |
72 Properties |
| 1999 | £198,534 | 27% |
93 Properties |
| 1998 | £144,329 | -4% |
88 Properties |
| 1997 | £150,727 | 18% |
68 Properties |
| 1996 | £122,978 | 19% |
66 Properties |
| 1995 | £99,785 | - |
52 Properties |
Property Price per Property Type in The Astons And Heyfords
Here you can find historic sold price data in order to help with your property search.
The average Property Paid Price for specific property types in the last three years are:
| Property Type | Average Sold Price | Sold Properties |
|---|---|---|
| Semi Detached House | £422,636.00 | 33 Semi Detached Houses |
| Detached House | £746,363.00 | 83 Detached Houses |
| Terraced House | £352,166.00 | 24 Terraced Houses |
| Flat | £214,785.00 | 7 Flats |

