Houses for sale & to rent in Launton, Bicester
House Prices in Launton
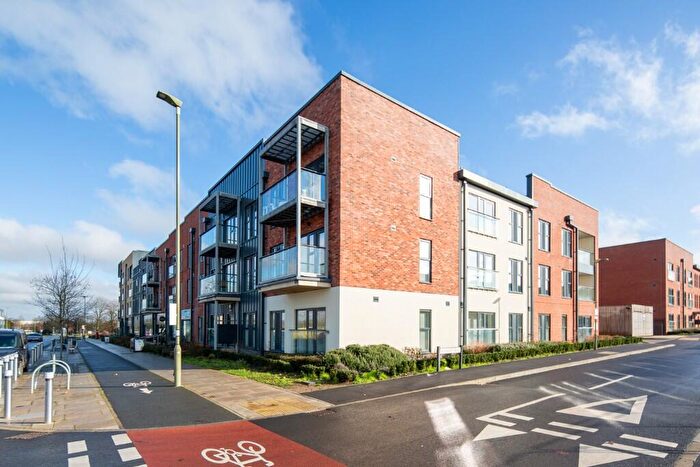
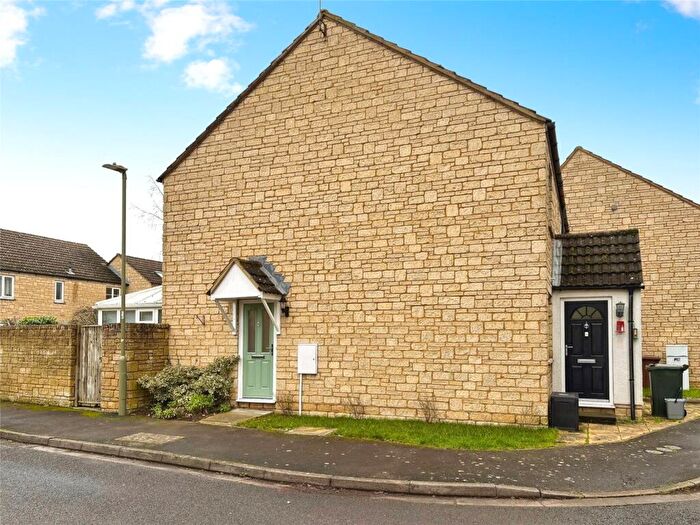
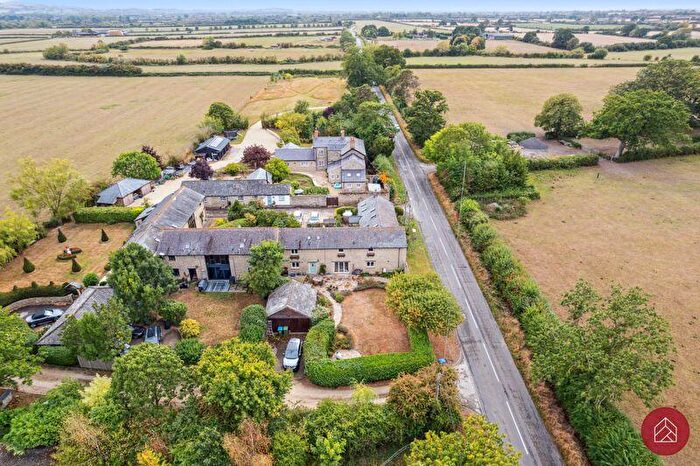
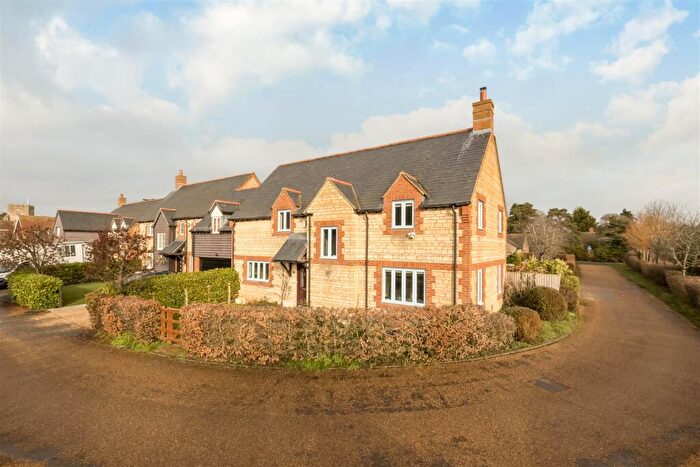
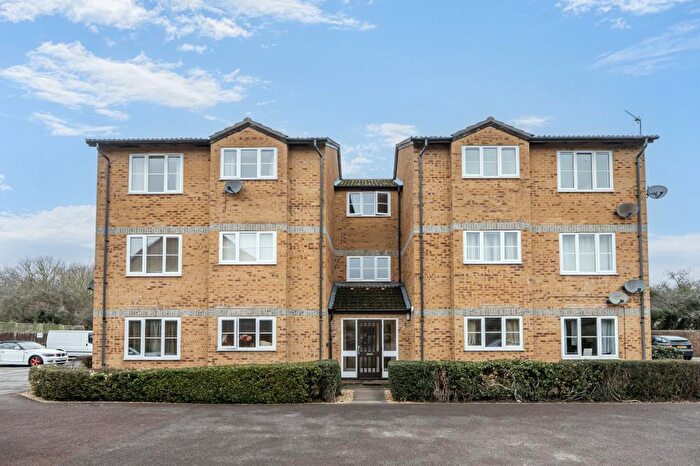
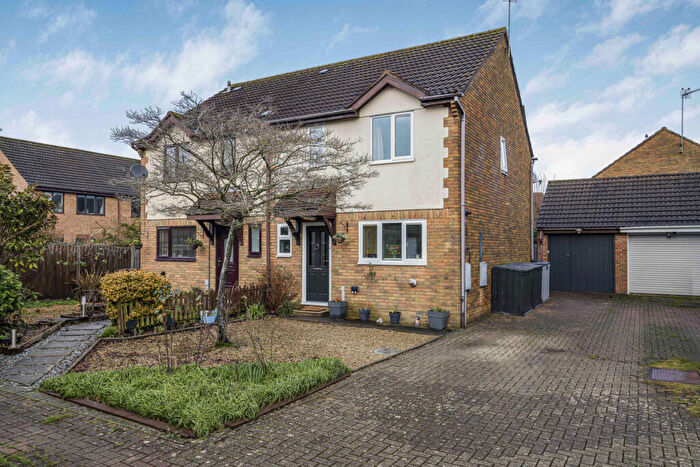
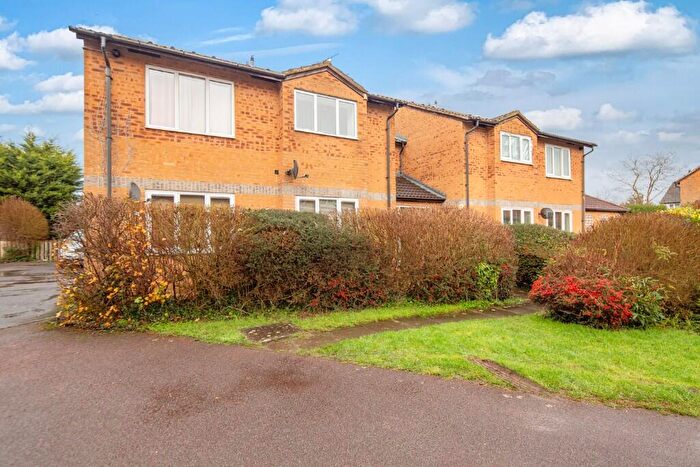
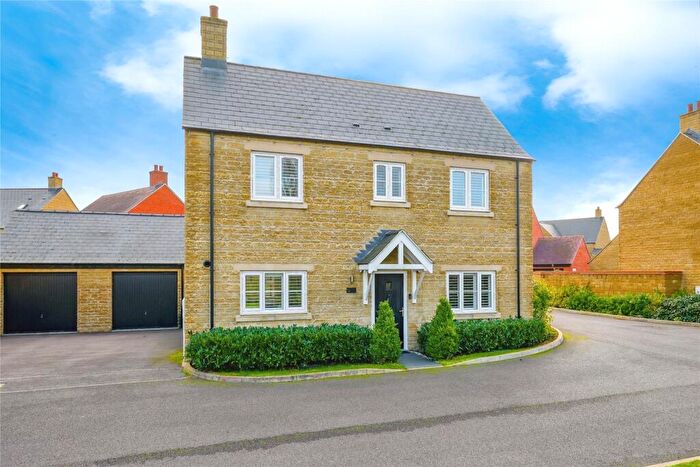
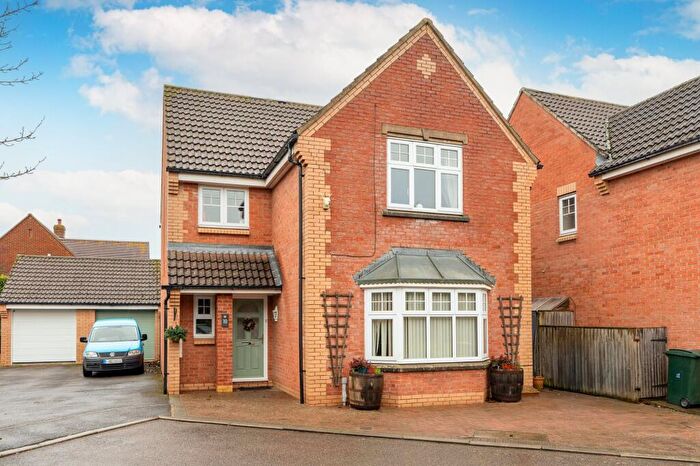
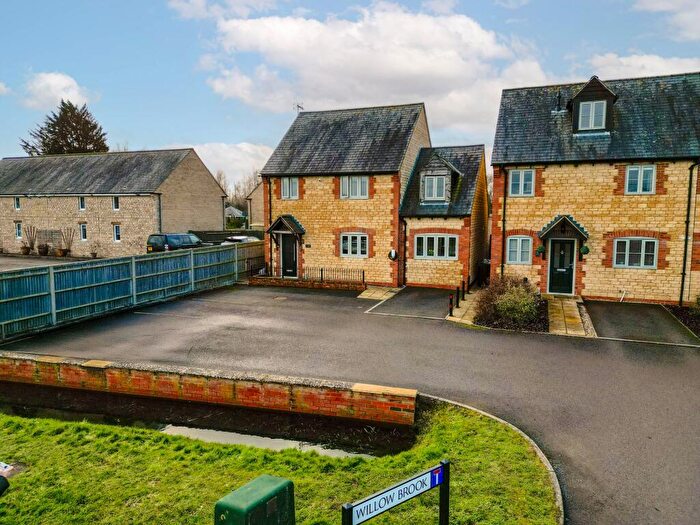
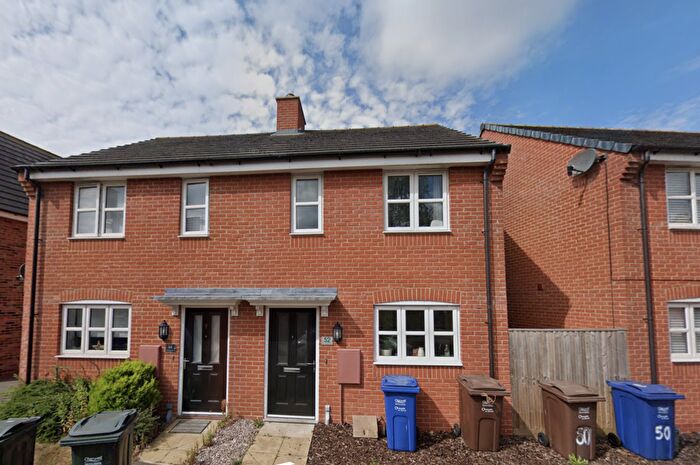
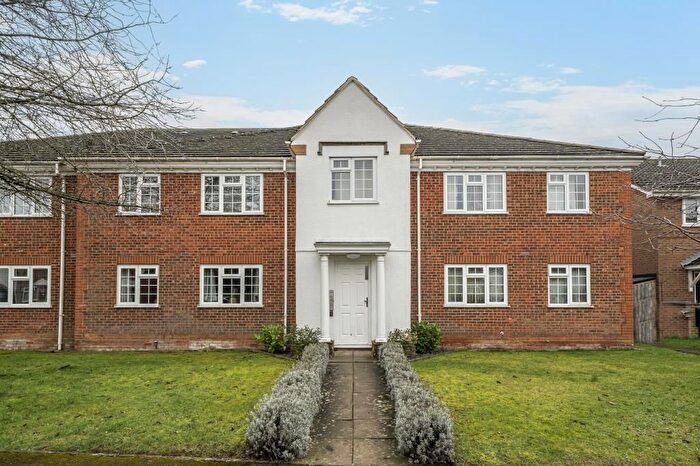
Properties in Launton have an average house price of £445,581.00 and had 87 Property Transactions within the last 3 years¹.
Launton is an area in Bicester, Oxfordshire with 1,057 households², where the most expensive property was sold for £1,830,000.00.
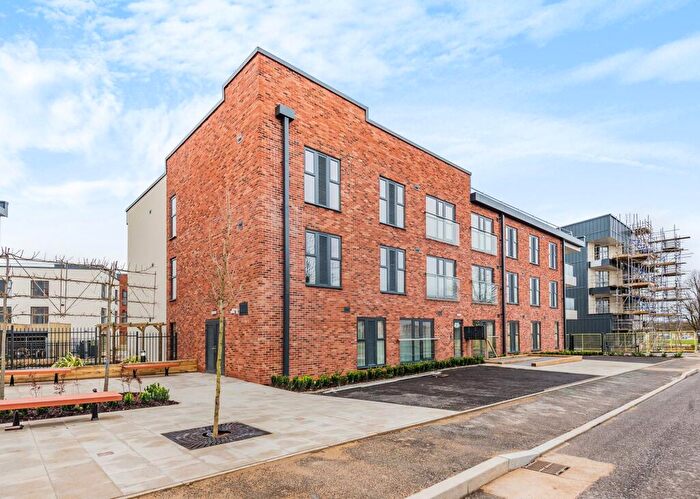
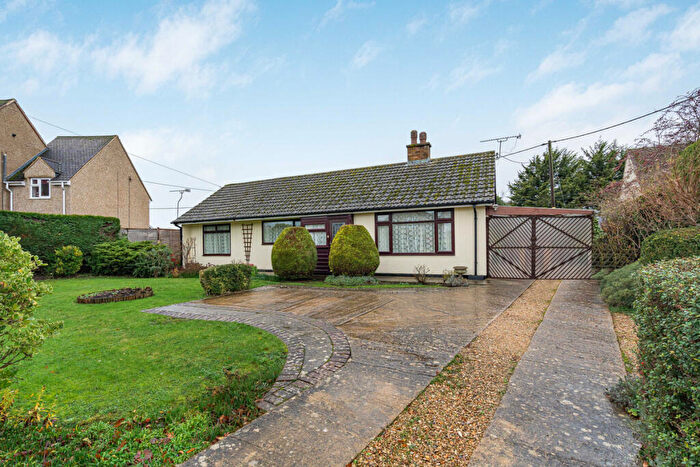
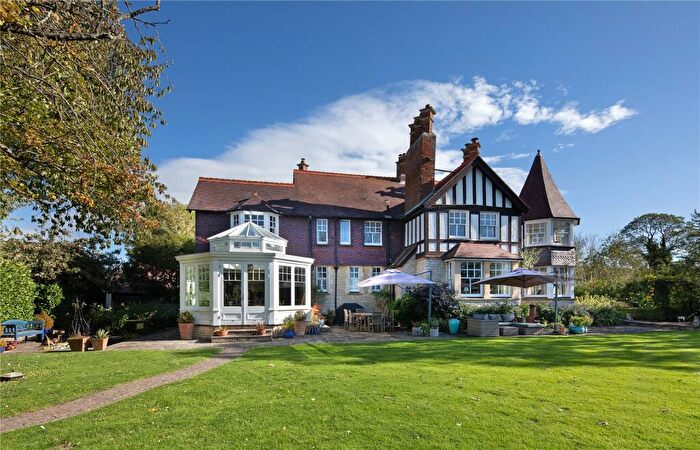
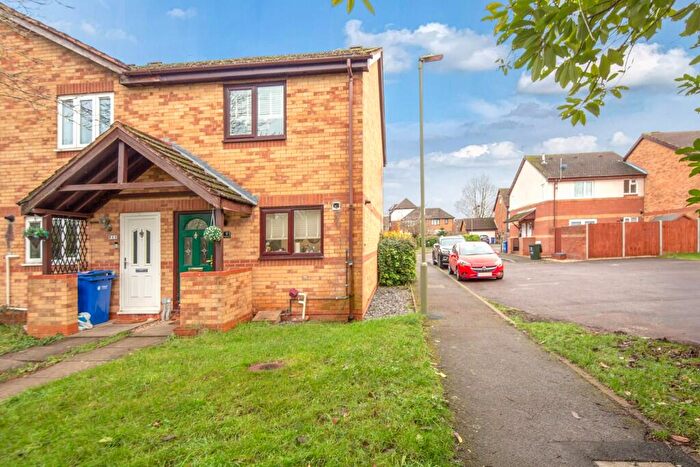
Properties for sale in Launton
Roads and Postcodes in Launton
Navigate through our locations to find the location of your next house in Launton, Bicester for sale or to rent.
| Streets | Postcodes |
|---|---|
| Ancil Avenue | OX26 5DJ OX26 5DL |
| Arncott Road | OX25 1PS |
| Bicester Road | OX26 5DP OX26 5DQ |
| Blackthorn Hill | OX25 1TJ |
| Blackthorn Road | OX26 5DA |
| Blenheim Drive | OX26 5EA |
| Buchanan Road | OX25 1PE OX25 1PH OX25 1PQ |
| Chestnut Close | OX26 5DE |
| Constables Croft | OX25 1PG |
| Drinkwater Close | OX25 1PR |
| East Brook Close | OX25 1PD |
| East View | OX25 1TB |
| Elm Tree Close | OX25 1TS |
| Forest Close | OX26 5DD |
| Green Lane | OX25 1PA |
| Green View | OX26 5DT |
| Harper Close | OX25 1QW |
| Hillside Close | OX25 1PF |
| Hopcraft Close | OX25 1QL |
| Lower End | OX25 1QD |
| Lower Road | OX25 1TG OX25 1TH OX25 1TQ |
| Ludgershall Road | OX25 1PU |
| Marsh Gibbon Road | OX25 1QF |
| Mill Lane | OX25 1PB |
| Murcott Road | OX25 1PL OX25 1QH |
| Norris Road | OX25 1NZ |
| Orchard Close | OX25 1QT |
| Ploughley Road | OX25 1NY |
| Sharpes Cottages | OX26 5BU |
| Sherwood Close | OX26 5DR |
| Skinner Road | OX26 5DH |
| Station Road | OX25 1TA OX26 5DS OX26 5DU OX26 5DX OX26 5EE OX26 5EF |
| Swan Close | OX25 1TU |
| Sycamore Road | OX26 5DY OX26 5DZ |
| Teale Close | OX25 1QJ |
| Thame Road | OX25 1PT OX25 1PX OX25 1PY OX25 1QB OX25 1TE OX25 1TF |
| The Glades | OX26 5ED |
| The Poplars | OX26 5DW |
| The Spinney | OX25 6EP |
| The Village Close | OX25 1QU |
| Vicarage Lane | OX25 1QA |
| Weir Farm Close | OX25 1WA |
| Weir Lane | OX25 1UL |
| West End | OX26 5DF OX26 5DG |
| West End Close | OX26 5EB |
| Willow Brook | OX25 1AD |
| Woodpiece Road | OX25 1PJ |
| OX25 1QE OX25 1QG |
Transport near Launton
-
Bicester Village Station
-
Bicester North Station
-
Islip Station
-
Tackley Station
-
Oxford Parkway Station
-
Heyford Station
-
Haddenham and Thame Parkway Station
- FAQ
- Price Paid By Year
- Property Type Price
Frequently asked questions about Launton
What is the average price for a property for sale in Launton?
The average price for a property for sale in Launton is £445,581. This amount is 11% higher than the average price in Bicester. There are 920 property listings for sale in Launton.
What streets have the most expensive properties for sale in Launton?
The streets with the most expensive properties for sale in Launton are Vicarage Lane at an average of £1,565,000, Ploughley Road at an average of £1,065,000 and The Spinney at an average of £985,000.
What streets have the most affordable properties for sale in Launton?
The streets with the most affordable properties for sale in Launton are Harper Close at an average of £209,125, The Glades at an average of £253,000 and Green Lane at an average of £258,750.
Which train stations are available in or near Launton?
Some of the train stations available in or near Launton are Bicester Village, Bicester North and Islip.
Property Price Paid in Launton by Year
The average sold property price by year was:
| Year | Average Sold Price | Price Change |
Sold Properties
|
|---|---|---|---|
| 2025 | £417,355 | -12% |
38 Properties |
| 2024 | £467,192 | -0,1% |
22 Properties |
| 2023 | £467,699 | 13% |
27 Properties |
| 2022 | £404,625 | -18% |
48 Properties |
| 2021 | £477,543 | 15% |
64 Properties |
| 2020 | £403,674 | 11% |
33 Properties |
| 2019 | £357,802 | -5% |
38 Properties |
| 2018 | £376,986 | -13% |
36 Properties |
| 2017 | £426,195 | 14% |
41 Properties |
| 2016 | £366,120 | 12% |
37 Properties |
| 2015 | £322,376 | 10% |
42 Properties |
| 2014 | £290,600 | -3% |
64 Properties |
| 2013 | £298,408 | -2% |
49 Properties |
| 2012 | £305,140 | -3% |
32 Properties |
| 2011 | £313,145 | 16% |
29 Properties |
| 2010 | £261,760 | 6% |
58 Properties |
| 2009 | £245,982 | -3% |
50 Properties |
| 2008 | £253,166 | -32% |
15 Properties |
| 2007 | £334,562 | 18% |
55 Properties |
| 2006 | £275,351 | 14% |
65 Properties |
| 2005 | £235,749 | 8% |
53 Properties |
| 2004 | £217,616 | -15% |
70 Properties |
| 2003 | £250,547 | 24% |
55 Properties |
| 2002 | £191,565 | 14% |
60 Properties |
| 2001 | £165,326 | - |
59 Properties |
| 2000 | £165,377 | 8% |
55 Properties |
| 1999 | £152,663 | 12% |
59 Properties |
| 1998 | £133,723 | 23% |
45 Properties |
| 1997 | £102,830 | 10% |
53 Properties |
| 1996 | £92,739 | 11% |
55 Properties |
| 1995 | £82,143 | - |
39 Properties |
Property Price per Property Type in Launton
Here you can find historic sold price data in order to help with your property search.
The average Property Paid Price for specific property types in the last three years are:
| Property Type | Average Sold Price | Sold Properties |
|---|---|---|
| Semi Detached House | £368,530.00 | 37 Semi Detached Houses |
| Detached House | £630,306.00 | 31 Detached Houses |
| Terraced House | £298,805.00 | 18 Terraced Houses |
| Flat | £212,000.00 | 1 Flat |

