Houses for sale & to rent in The Bartons, Chipping Norton
House Prices in The Bartons
Properties in The Bartons have an average house price of £584,724.00 and had 76 Property Transactions within the last 3 years¹.
The Bartons is an area in Chipping Norton, Oxfordshire with 809 households², where the most expensive property was sold for £2,030,000.00.
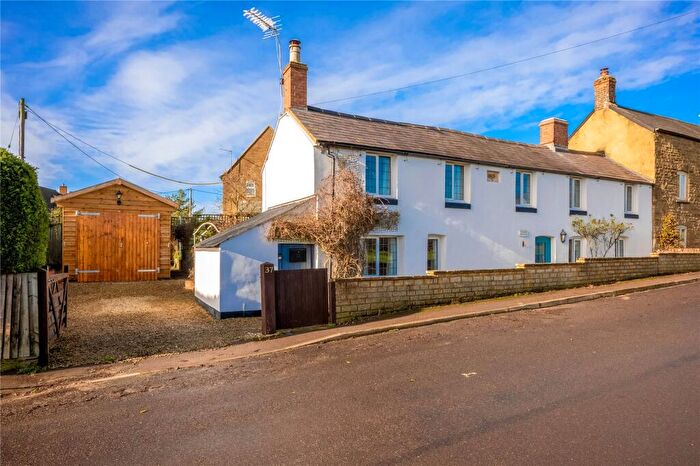
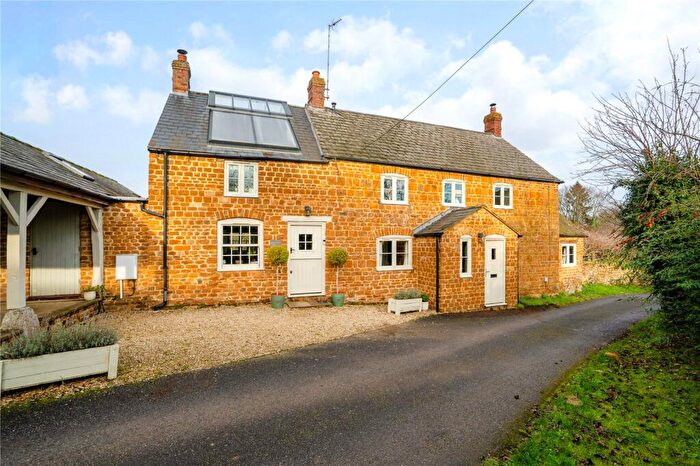
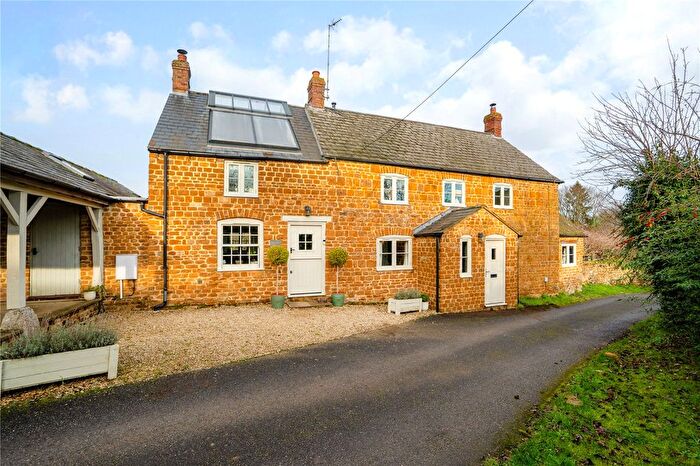
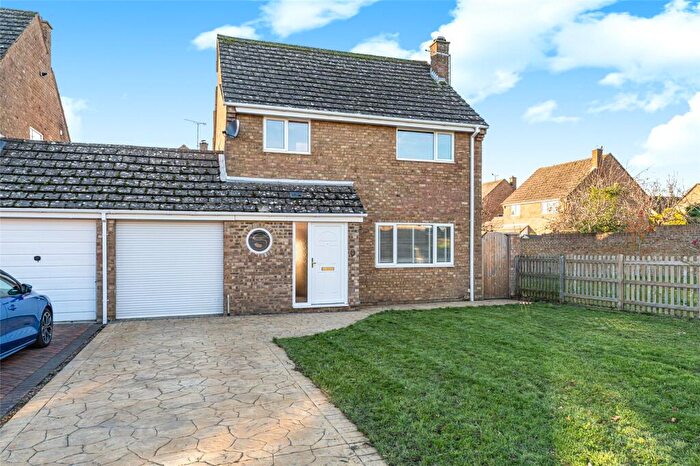
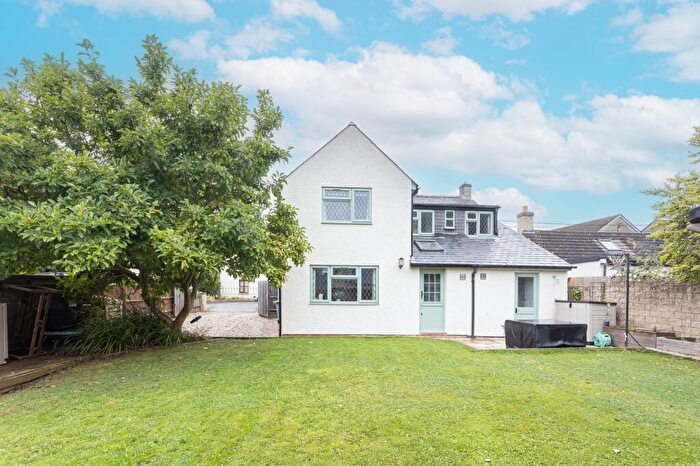
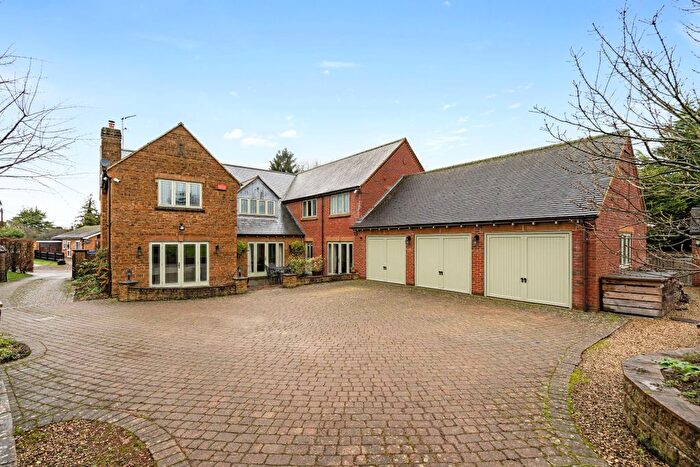
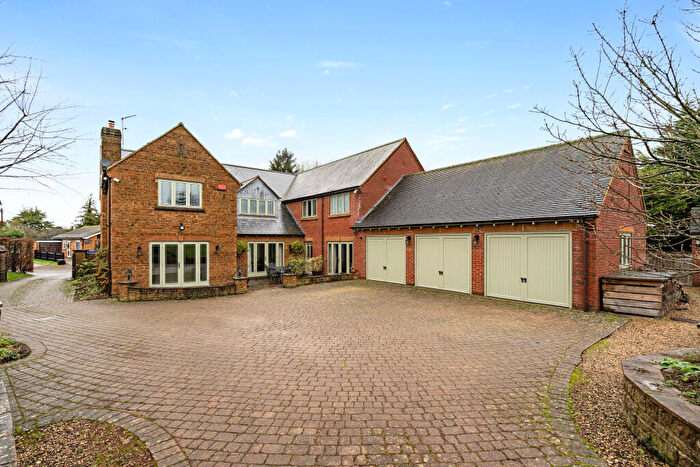
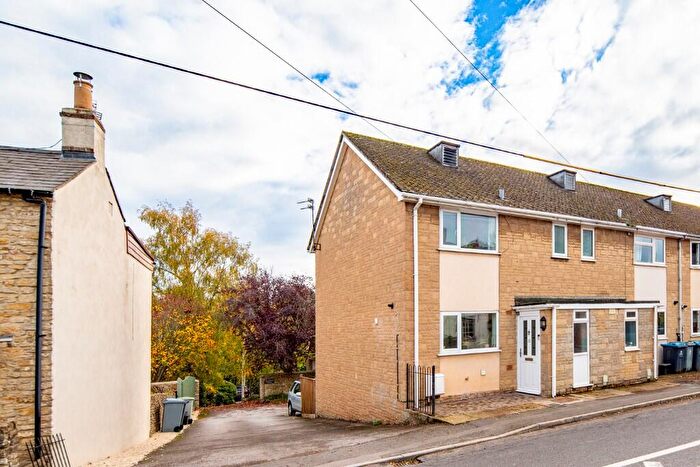
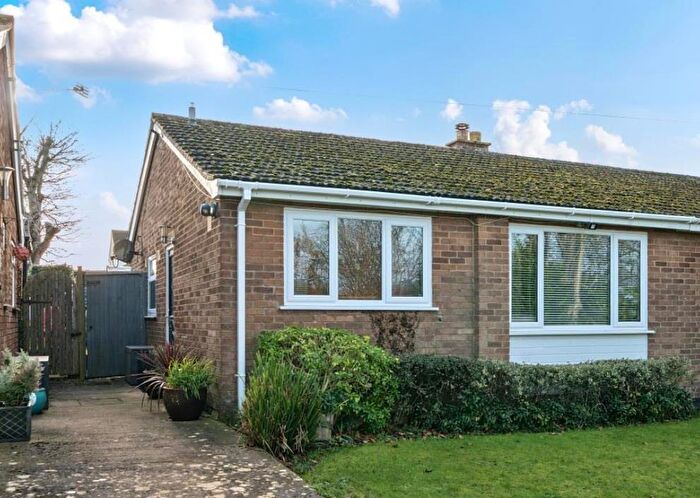
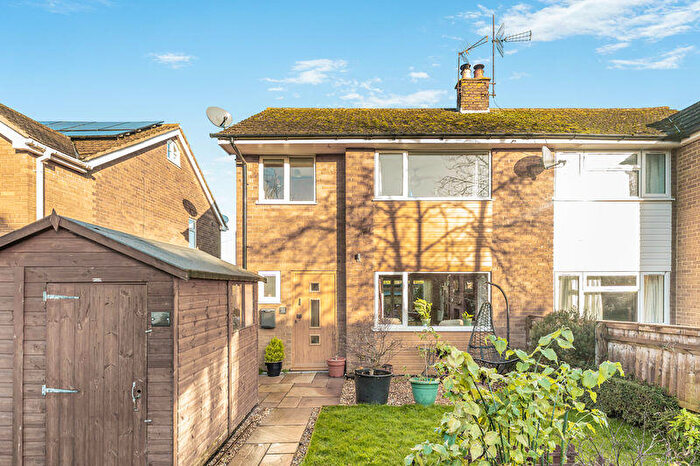
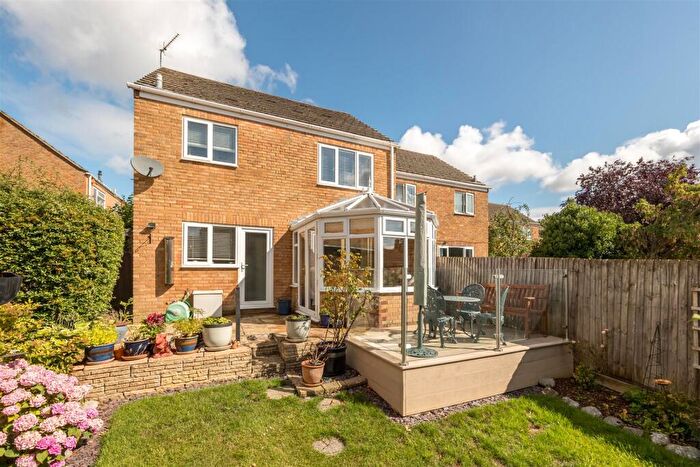
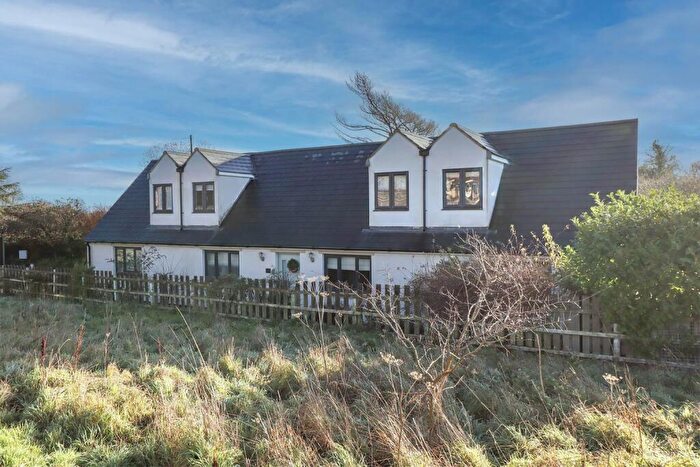
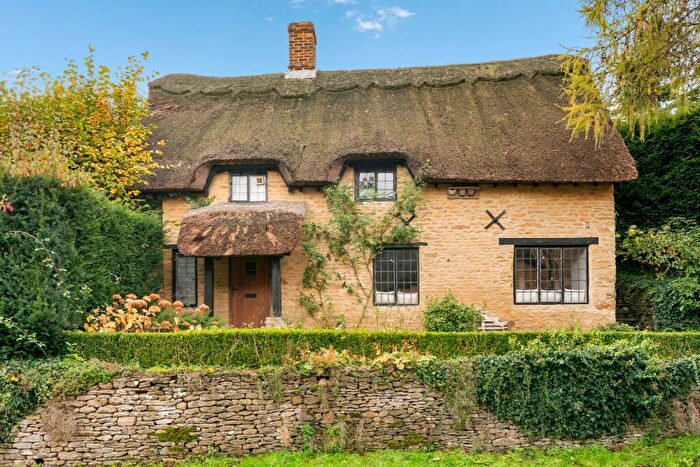
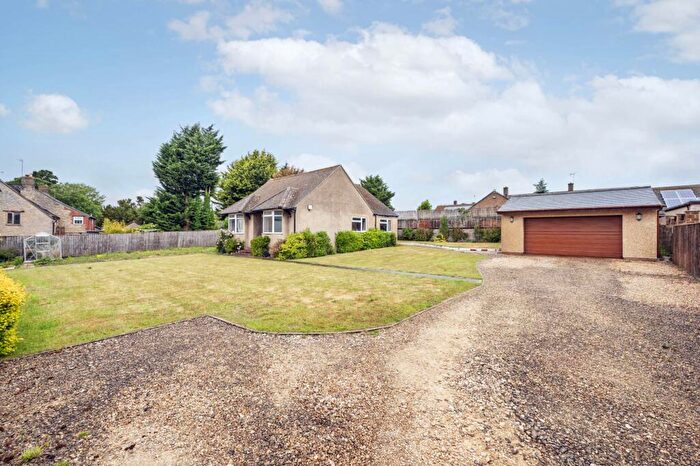
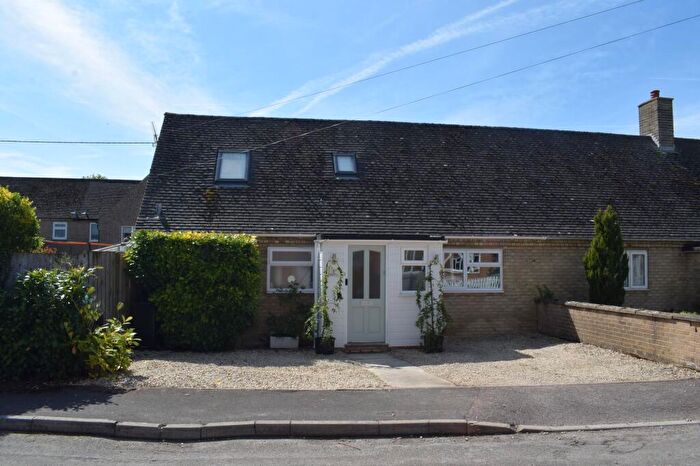
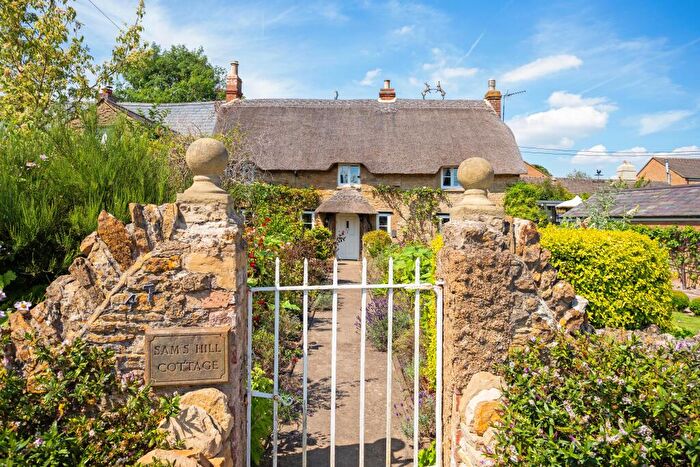
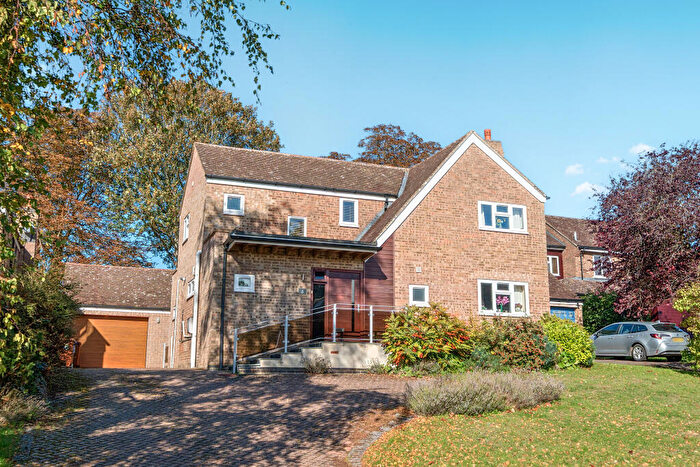
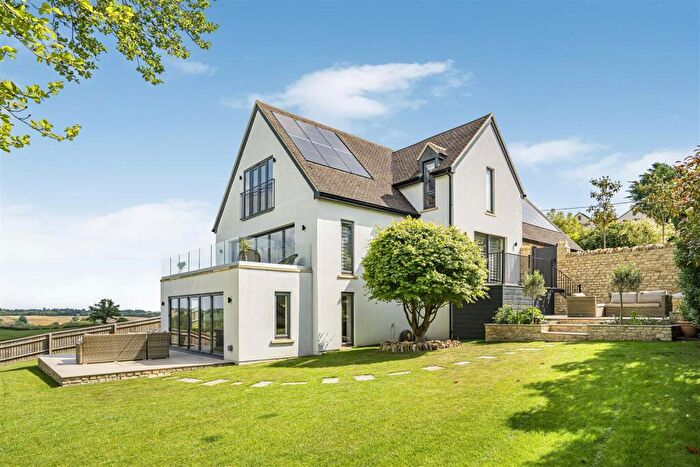
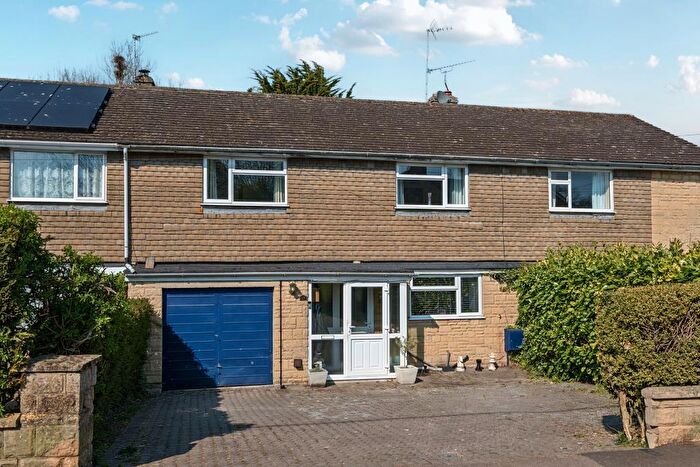
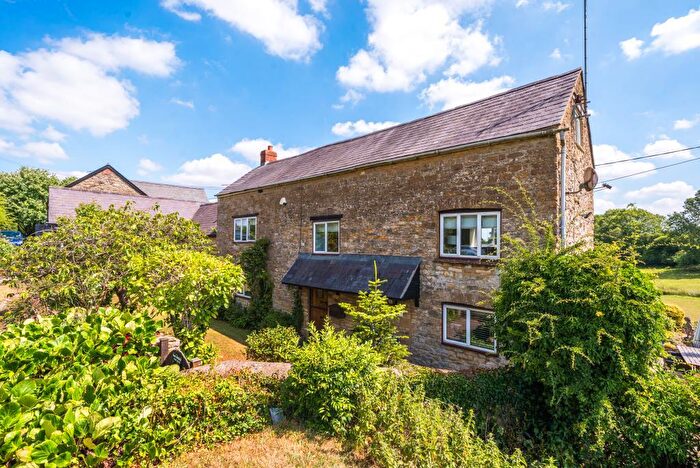
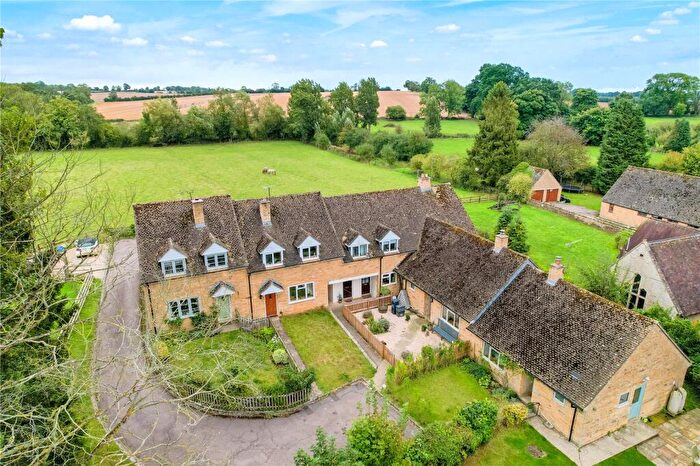
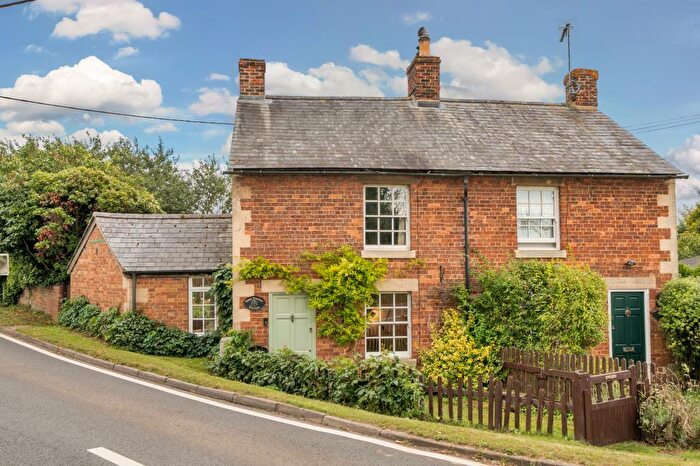
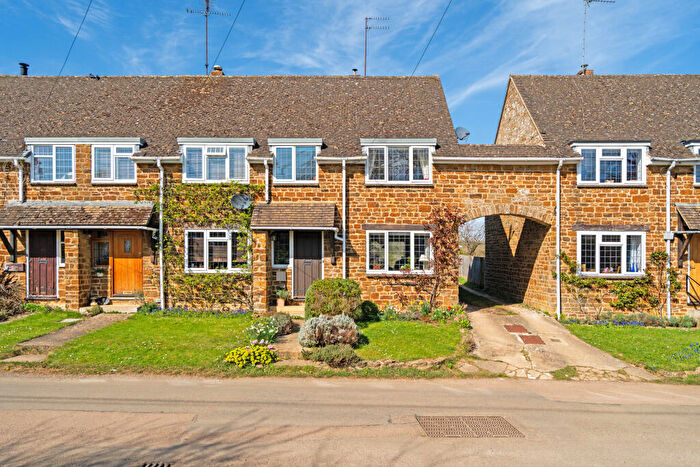
Properties for sale in The Bartons
Roads and Postcodes in The Bartons
Navigate through our locations to find the location of your next house in The Bartons, Chipping Norton for sale or to rent.
| Streets | Postcodes |
|---|---|
| Ballard Close | OX7 7HB |
| Bicester Road | OX7 7DH OX7 7DJ OX7 7DL |
| Church Lane | OX7 7BX OX25 4QR |
| Cross Way | OX7 7HF |
| Dorn Close | OX7 7HD |
| Duns Tew Road | OX7 7DE OX7 7DF OX7 7DG OX7 7DQ |
| Enstone Road | OX7 7AB OX7 7BL OX7 7BN OX7 7DT OX7 7AA |
| Farriers Road | OX7 7EU |
| Fleming Close | OX7 7HG |
| Fleming Drive | OX7 7HH |
| Flight Hill | OX7 7AW |
| Fox Lane | OX7 7BS |
| Frances Road | OX7 7ET |
| Hillside Road | OX7 7EY |
| Holliers Crescent | OX7 7HE OX7 7HN OX7 7HW |
| Irondown Hill | OX7 4DH |
| Irons Court | OX7 7AY |
| Jacobs Yard | OX7 7BY |
| Jervis Close | OX7 7DY |
| Kiddington Road | OX7 7DN |
| Kirby Close | OX7 7HJ |
| Laundry Lane | OX7 7AF |
| Ledwell Road | OX7 7AH OX7 4DN OX7 7AJ OX7 7AL |
| Manor Road | OX7 7AG |
| Marshall Crescent | OX7 7HA |
| Mill Lane | OX7 7BT OX7 7AQ |
| North Street | OX7 7BH OX7 7BJ OX7 7BZ OX7 7DA |
| Old Johns Close | OX7 7EB |
| Old Turnpike Cottages | OX7 7DB |
| Orchard Way | OX7 7EZ |
| Oxford Road | OX25 5QH OX25 5QJ |
| Pack Lane | OX25 4QW |
| Rayford Lane | OX7 7DD |
| Rectory Crescent | OX7 7BP |
| Sandford Common | OX7 7AE |
| South Street | OX7 7BU |
| The Leys | OX7 7DP |
| Washington Terrace | OX7 7BD |
| Woodway Road | OX7 7BW |
| Worton Road | OX7 7EE OX7 7EF OX7 7DU OX7 7EG OX7 7EQ |
| OX7 7AD OX7 7AN OX7 7EJ OX7 7EN OX7 7EP OX7 7EW OX15 0PH OX25 4QL OX25 4QN OX25 4QP OX25 4QS OX7 7AP OX7 7AR OX7 7AS OX7 7AT OX7 7AU OX7 7AX OX7 7EH OX7 7EL OX7 7ER OX7 7ES |
Transport near The Bartons
-
Heyford Station
-
Tackley Station
-
Charlbury Station
-
King's Sutton Station
-
Finstock Station
-
Combe Station
-
Hanborough Station
-
Banbury Station
-
Islip Station
-
Bicester North Station
- FAQ
- Price Paid By Year
- Property Type Price
Frequently asked questions about The Bartons
What is the average price for a property for sale in The Bartons?
The average price for a property for sale in The Bartons is £584,724. This amount is 0.11% higher than the average price in Chipping Norton. There are 290 property listings for sale in The Bartons.
What streets have the most expensive properties for sale in The Bartons?
The streets with the most expensive properties for sale in The Bartons are Flight Hill at an average of £2,030,000, Manor Road at an average of £1,147,000 and Fleming Close at an average of £875,000.
What streets have the most affordable properties for sale in The Bartons?
The streets with the most affordable properties for sale in The Bartons are Orchard Way at an average of £208,840, Washington Terrace at an average of £331,000 and Hillside Road at an average of £331,000.
Which train stations are available in or near The Bartons?
Some of the train stations available in or near The Bartons are Heyford, Tackley and Charlbury.
Property Price Paid in The Bartons by Year
The average sold property price by year was:
| Year | Average Sold Price | Price Change |
Sold Properties
|
|---|---|---|---|
| 2025 | £522,676 | -32% |
17 Properties |
| 2024 | £687,874 | 24% |
29 Properties |
| 2023 | £520,173 | -23% |
30 Properties |
| 2022 | £639,960 | 25% |
18 Properties |
| 2021 | £477,194 | -15% |
46 Properties |
| 2020 | £548,537 | 26% |
27 Properties |
| 2019 | £404,446 | 1% |
16 Properties |
| 2018 | £401,348 | 3% |
30 Properties |
| 2017 | £387,671 | -1% |
32 Properties |
| 2016 | £389,840 | 11% |
38 Properties |
| 2015 | £348,763 | 4% |
26 Properties |
| 2014 | £336,336 | 15% |
35 Properties |
| 2013 | £286,558 | -6% |
34 Properties |
| 2012 | £304,529 | -6% |
17 Properties |
| 2011 | £321,747 | -22% |
20 Properties |
| 2010 | £391,809 | 35% |
25 Properties |
| 2009 | £255,531 | -32% |
22 Properties |
| 2008 | £337,349 | 7% |
19 Properties |
| 2007 | £312,479 | -4% |
51 Properties |
| 2006 | £326,216 | 22% |
34 Properties |
| 2005 | £255,092 | 4% |
32 Properties |
| 2004 | £245,046 | 7% |
39 Properties |
| 2003 | £227,924 | 9% |
35 Properties |
| 2002 | £207,317 | -17% |
58 Properties |
| 2001 | £241,534 | 34% |
48 Properties |
| 2000 | £159,861 | 17% |
34 Properties |
| 1999 | £133,224 | 14% |
57 Properties |
| 1998 | £114,764 | -4% |
28 Properties |
| 1997 | £119,203 | 13% |
26 Properties |
| 1996 | £103,390 | -0,3% |
44 Properties |
| 1995 | £103,675 | - |
31 Properties |
Property Price per Property Type in The Bartons
Here you can find historic sold price data in order to help with your property search.
The average Property Paid Price for specific property types in the last three years are:
| Property Type | Average Sold Price | Sold Properties |
|---|---|---|
| Semi Detached House | £456,738.00 | 21 Semi Detached Houses |
| Detached House | £723,644.00 | 36 Detached Houses |
| Terraced House | £526,957.00 | 15 Terraced Houses |
| Flat | £223,000.00 | 4 Flats |

