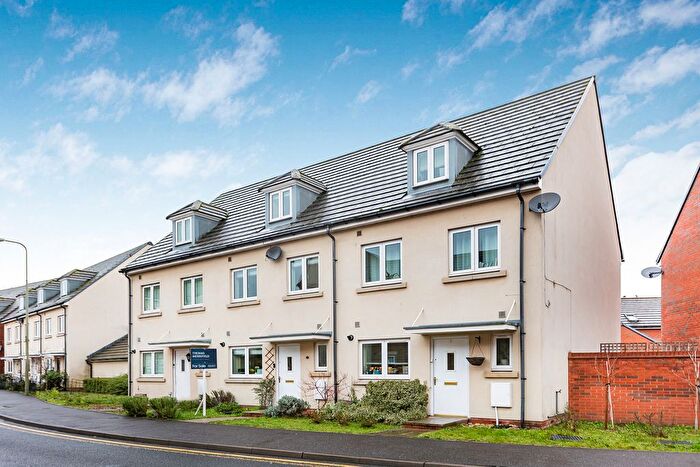
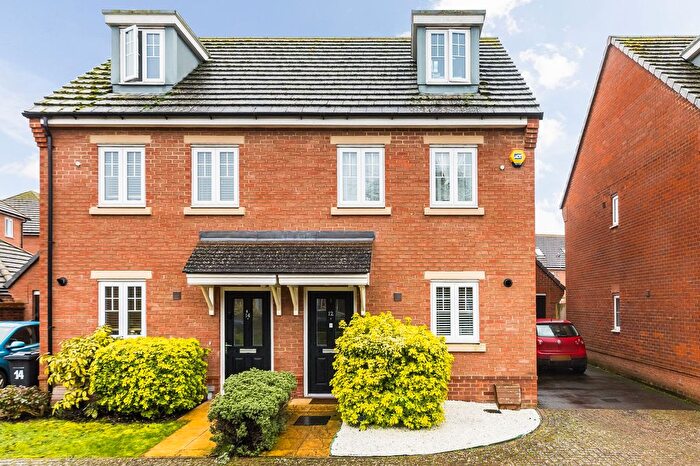
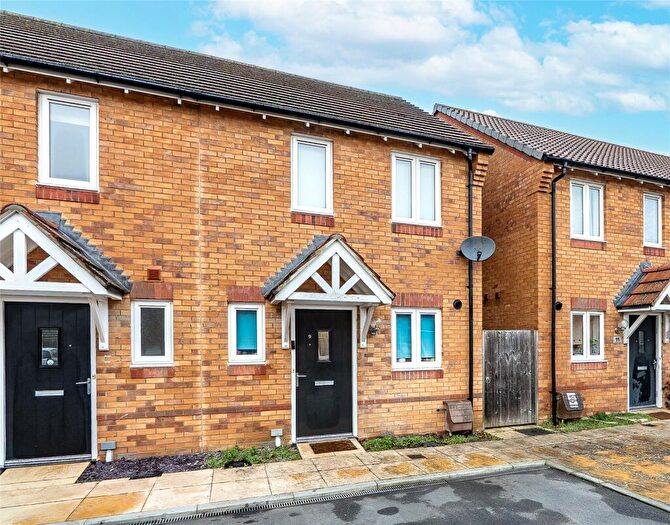
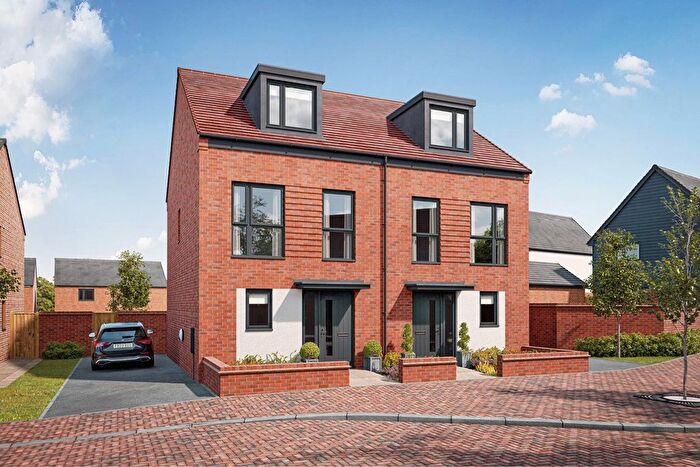
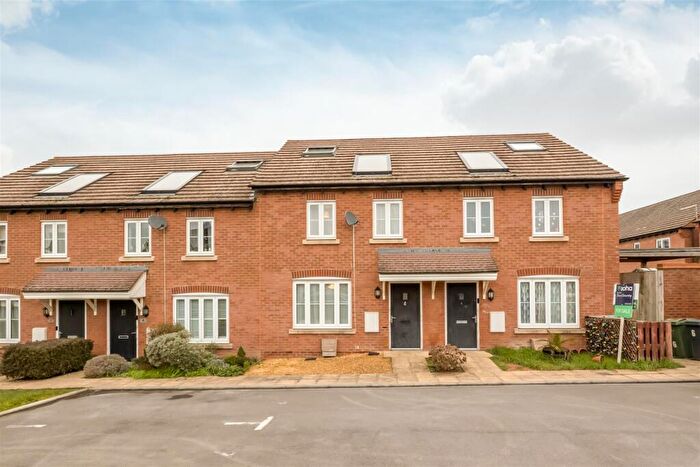
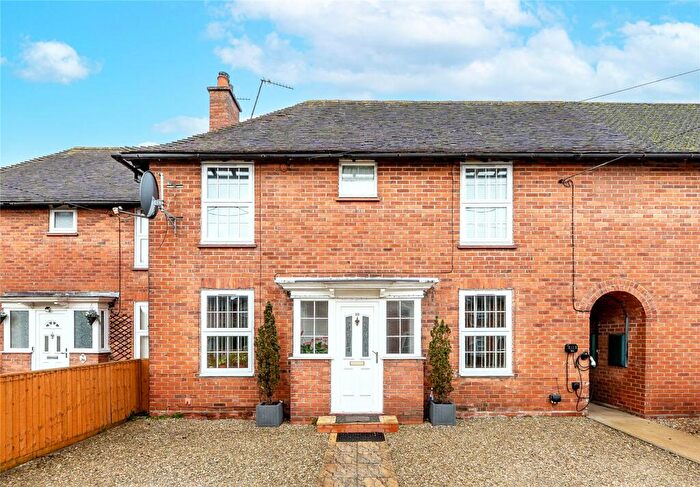
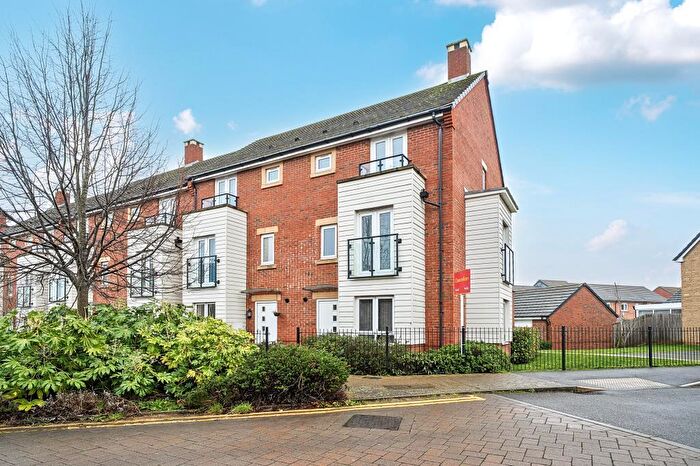
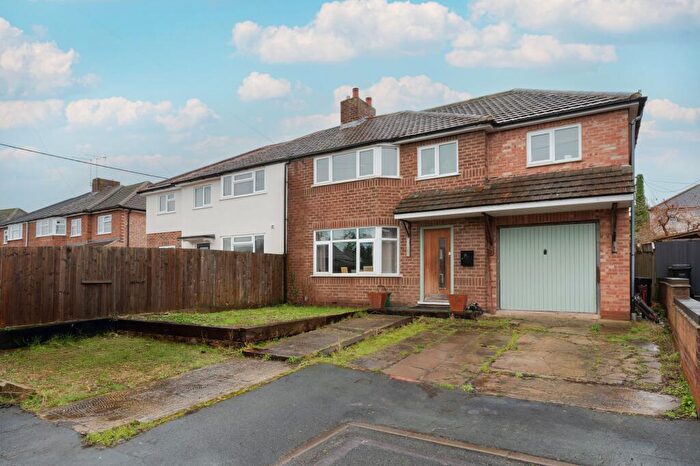
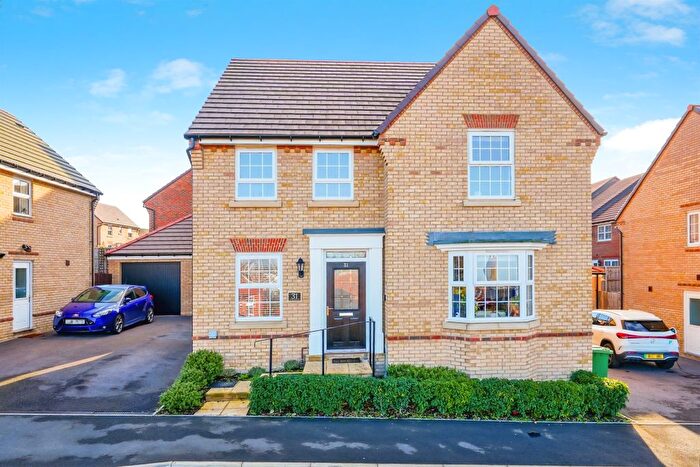
Houses for sale & to rent in Didcot All Saints, Didcot
House Prices in Didcot All Saints
Properties in Didcot All Saints have an average house price of £346,237.00 and had 301 Property Transactions within the last 3 years¹.
Didcot All Saints is an area in Didcot, Oxfordshire with 2,010 households², where the most expensive property was sold for £787,000.00.
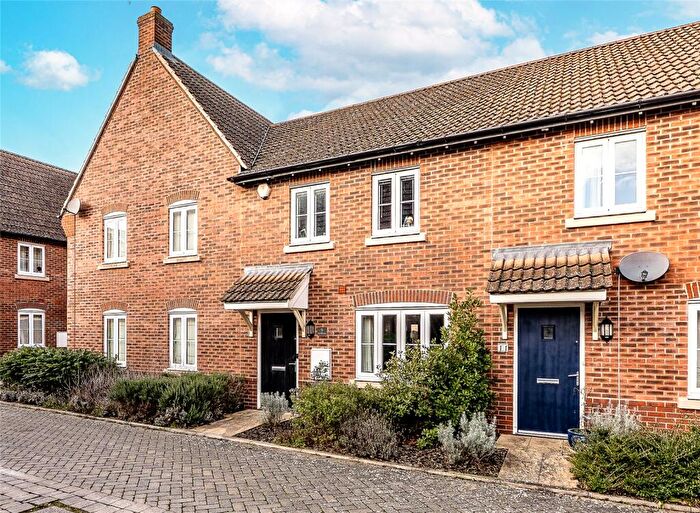
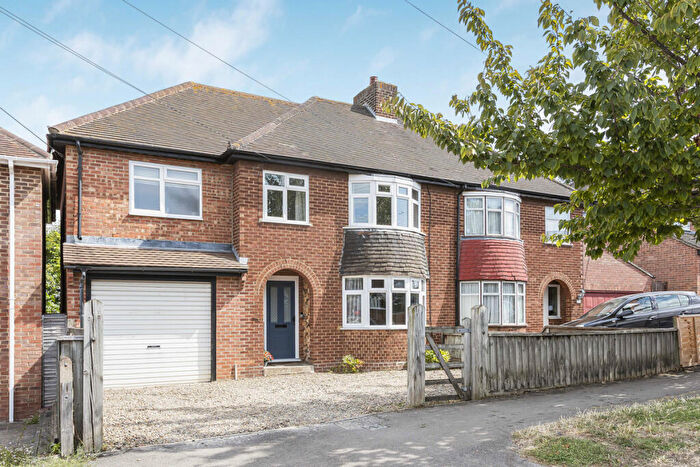
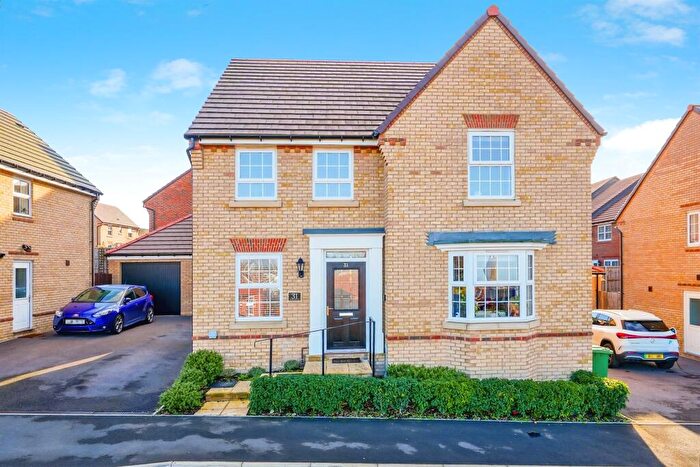
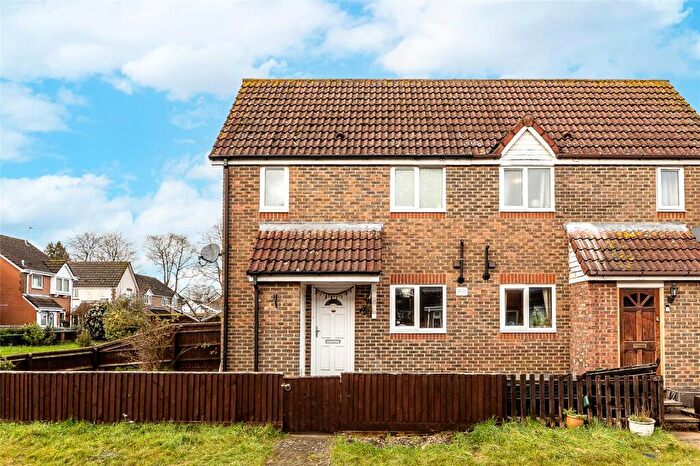
Properties for sale in Didcot All Saints
Roads and Postcodes in Didcot All Saints
Navigate through our locations to find the location of your next house in Didcot All Saints, Didcot for sale or to rent.
| Streets | Postcodes |
|---|---|
| All Saints Court | OX11 7NG |
| Apple Down | OX11 6AQ |
| Ash Way | OX11 6AN |
| Barleyfields | OX11 0BH OX11 0BJ |
| Blackthorn Road | OX11 6AY |
| Blagrave Close | OX11 7JW |
| Blakes Field | OX11 7BD OX11 7BE |
| Blenheim Close | OX11 7JJ OX11 7JL OX11 7JQ |
| Bosleys Orchard | OX11 7NY |
| Brasenose Road | OX11 7BJ OX11 7BL OX11 7BN OX11 7BP OX11 7BS OX11 7BW |
| Brett Linley Gardens | OX11 6BR |
| Broadway | OX11 8AB OX11 8AE OX11 8RN OX11 8RS |
| Castle Walk | OX11 7PD |
| Chris Muir Place | OX11 6BL |
| Churchill Close | OX11 7BX |
| Churchill Road | OX11 7BT OX11 7BU |
| Cronshaw Close | OX11 7JT OX11 7JU OX11 7JX |
| Damson Drive | OX11 6AX |
| Dan Read Parade | OX11 6BD |
| Daniel Shepherd Avenue | OX11 6BS |
| Druids Walk | OX11 7PF |
| Dunnock End | OX11 6AD |
| Dunsden Close | OX11 7BB |
| Edinburgh Drive | OX11 7HS OX11 7HT OX11 7HU |
| Elbourne | OX11 0BL |
| Foxhall Road | OX11 7AA OX11 7AD OX11 7AG OX11 7AQ OX11 7EB |
| Freeman Road | OX11 7BY OX11 7DA OX11 7DB OX11 7DD OX11 7DE |
| Garth Road | OX11 7JG |
| Gary O'donnell Drive | OX11 6BT |
| Glyn Avenue | OX11 7AH |
| Great Western Drive | OX11 7PB |
| Greenfinch Road | OX11 6BG |
| Haddon Terrace | OX11 7HY |
| Harrier Drive | OX11 6BU |
| Hawthorn Place | OX11 6BF |
| Haydon Road | OX11 7JA OX11 7JB OX11 7JD OX11 7JF OX11 7JR |
| Hazel Gardens | OX11 6DF |
| Heron Lane | OX11 6AE |
| Icknield Close | OX11 7AU |
| Jackdaw Road | OX11 6BH |
| Juniper Way | OX11 6AA |
| King Alfred Drive | OX11 7NT OX11 7NU |
| King Walk | OX11 7PE |
| Kingfisher Drive | OX11 6AJ |
| Lime Walk | OX11 6AZ |
| Lisa Head Avenue | OX11 6BJ |
| Lydalls Close | OX11 7LA OX11 7LD |
| Lydalls Road | OX11 7DT OX11 7DU OX11 7DX OX11 7DZ OX11 7EA OX11 7HX OX11 7HZ |
| Macdonald Close | OX11 7BH |
| Manor Crescent | OX11 7AJ OX11 7AN |
| Manor Road | OX11 7JY OX11 7JZ |
| Maple Road | OX11 6BA |
| Mead Walk | OX11 7PA |
| Melton Drive | OX11 7JP |
| Mendip Heights | OX11 7TB OX11 7TE OX11 7TG |
| Merritt Road | OX11 7DF OX11 7DG OX11 7DQ |
| Morrells Close | OX11 7DJ |
| Nightingale Way | OX11 6AF |
| North Road | OX11 7EQ |
| Oak Hill Lane | OX11 6AP |
| Olaf Schmid Mews | OX11 6BP |
| Orchard Close | OX11 7JE |
| Osprey Place | OX11 6BX |
| Oxford Crescent | OX11 7AL OX11 7AX OX11 7AY |
| Partridge Close | OX11 6AB |
| Peacock Mews | OX11 6AT |
| Pixton Close | OX11 0BX |
| Prior Court | OX11 7AZ |
| Quantock View | OX11 7TF |
| Red Kite Way | OX11 6AL |
| Robin Way | OX11 6BW |
| Roman Place | OX11 7ER |
| Rookery Court | OX11 6AU |
| Rowan Close | OX11 6BE |
| Rymans Court | OX11 7GZ |
| Sandpiper Walk | OX11 6BB |
| Sayers Orchard | OX11 7BA |
| Sherwood Road | OX11 0BU |
| Sir Frank Williams Avenue | OX11 6AS |
| Slade Road | OX11 7AP OX11 7AR OX11 7AT |
| Smiths Farm Lane | OX11 7DL |
| Station Road | OX11 7NE OX11 7NN OX11 7NS |
| Stonor Close | OX11 7LF |
| Swallow Mews | OX11 6AH |
| Swan Mews | OX11 6AG |
| The Avenue | OX11 6AW |
| The Oval | OX11 7EJ OX11 7EL |
| Walnut Lane | OX11 6AR |
| Wantage Road | OX11 0AE OX11 0AH OX11 0AJ OX11 0AQ OX11 0BP OX11 0BS OX11 0BT OX11 0BY OX11 0BZ |
| Wenlock Close | OX11 7UJ |
| White Leys Close | OX11 7LP |
| Whitebeam Court | OX11 6BY |
| Wills Road | OX11 7DH |
Transport near Didcot All Saints
- FAQ
- Price Paid By Year
- Property Type Price
Frequently asked questions about Didcot All Saints
What is the average price for a property for sale in Didcot All Saints?
The average price for a property for sale in Didcot All Saints is £346,237. This amount is 10% lower than the average price in Didcot. There are 1,802 property listings for sale in Didcot All Saints.
What streets have the most expensive properties for sale in Didcot All Saints?
The streets with the most expensive properties for sale in Didcot All Saints are Manor Road at an average of £685,453, Barleyfields at an average of £675,000 and Macdonald Close at an average of £620,000.
What streets have the most affordable properties for sale in Didcot All Saints?
The streets with the most affordable properties for sale in Didcot All Saints are All Saints Court at an average of £179,000, Rymans Court at an average of £184,690 and Castle Walk at an average of £195,000.
Which train stations are available in or near Didcot All Saints?
Some of the train stations available in or near Didcot All Saints are Didcot Parkway, Appleford and Culham.
Property Price Paid in Didcot All Saints by Year
The average sold property price by year was:
| Year | Average Sold Price | Price Change |
Sold Properties
|
|---|---|---|---|
| 2025 | £348,932 | 3% |
95 Properties |
| 2024 | £338,783 | -4% |
106 Properties |
| 2023 | £351,577 | 3% |
100 Properties |
| 2022 | £341,266 | 2% |
125 Properties |
| 2021 | £335,737 | 11% |
127 Properties |
| 2020 | £298,576 | -1% |
118 Properties |
| 2019 | £300,640 | 1% |
125 Properties |
| 2018 | £296,408 | -1% |
134 Properties |
| 2017 | £300,219 | 3% |
125 Properties |
| 2016 | £292,486 | 4% |
154 Properties |
| 2015 | £280,492 | 9% |
144 Properties |
| 2014 | £254,903 | 8% |
307 Properties |
| 2013 | £233,663 | -1% |
264 Properties |
| 2012 | £236,486 | 13% |
195 Properties |
| 2011 | £204,719 | -6% |
95 Properties |
| 2010 | £217,266 | 7% |
71 Properties |
| 2009 | £201,526 | -16% |
62 Properties |
| 2008 | £232,789 | 7% |
57 Properties |
| 2007 | £216,449 | 8% |
118 Properties |
| 2006 | £200,158 | 11% |
90 Properties |
| 2005 | £178,219 | 2% |
92 Properties |
| 2004 | £174,329 | 2% |
89 Properties |
| 2003 | £170,213 | 13% |
89 Properties |
| 2002 | £147,761 | 17% |
110 Properties |
| 2001 | £122,249 | 2% |
112 Properties |
| 2000 | £119,728 | 19% |
105 Properties |
| 1999 | £97,075 | 12% |
97 Properties |
| 1998 | £85,401 | 14% |
115 Properties |
| 1997 | £73,464 | 9% |
109 Properties |
| 1996 | £66,895 | 6% |
96 Properties |
| 1995 | £62,662 | - |
78 Properties |
Property Price per Property Type in Didcot All Saints
Here you can find historic sold price data in order to help with your property search.
The average Property Paid Price for specific property types in the last three years are:
| Property Type | Average Sold Price | Sold Properties |
|---|---|---|
| Semi Detached House | £378,716.00 | 135 Semi Detached Houses |
| Detached House | £480,509.00 | 47 Detached Houses |
| Terraced House | £303,398.00 | 65 Terraced Houses |
| Flat | £199,738.00 | 54 Flats |

