
Houses for sale in Didcot, Oxfordshire
House Prices in Didcot
Properties in Didcot have an average house price of £388k and had 1,947 Property Transactions within the last 3 years.¹
Didcot is an area in Oxfordshire with 18,084 households², where the most expensive property was sold for £7.5M.
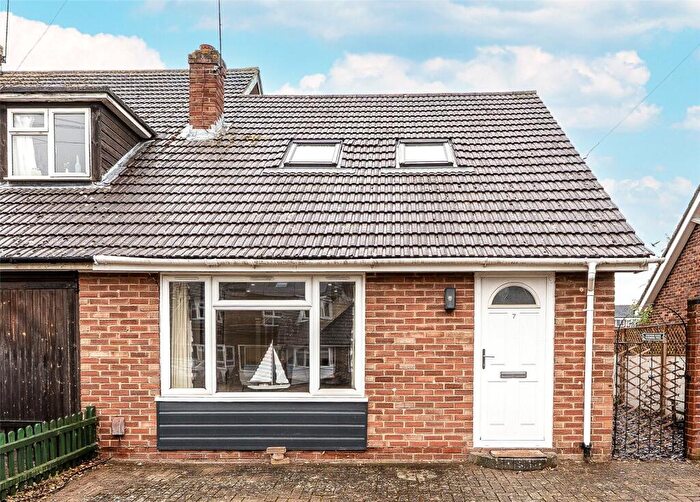
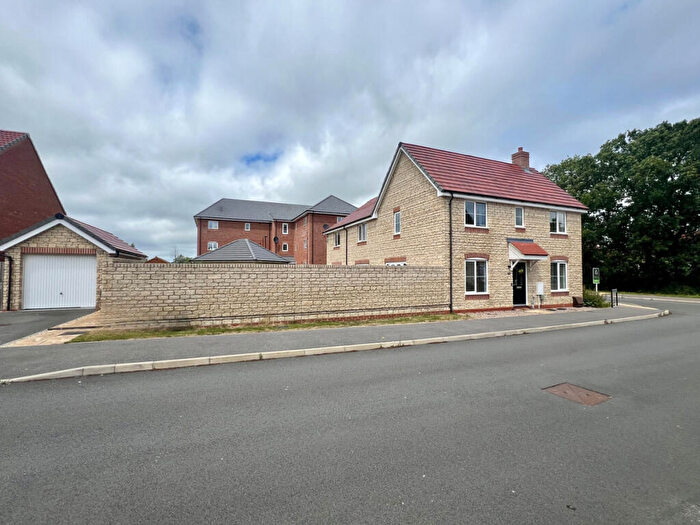
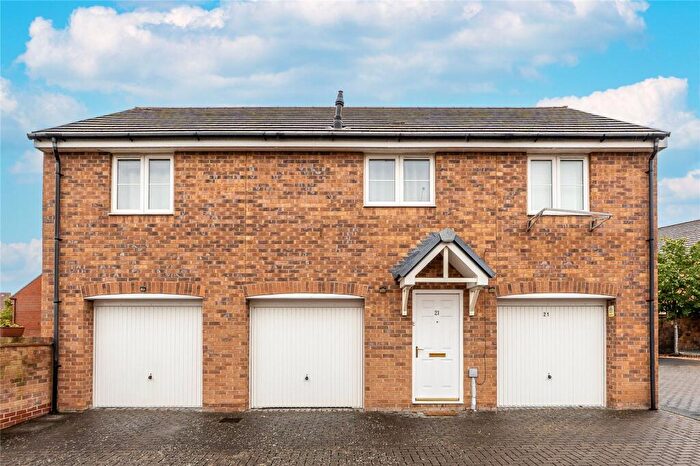
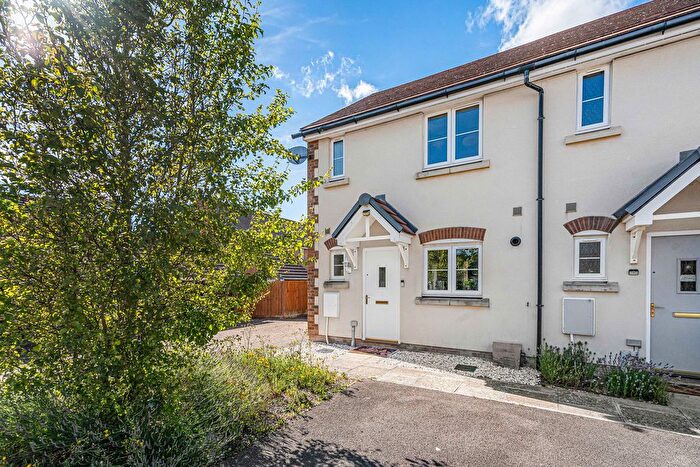
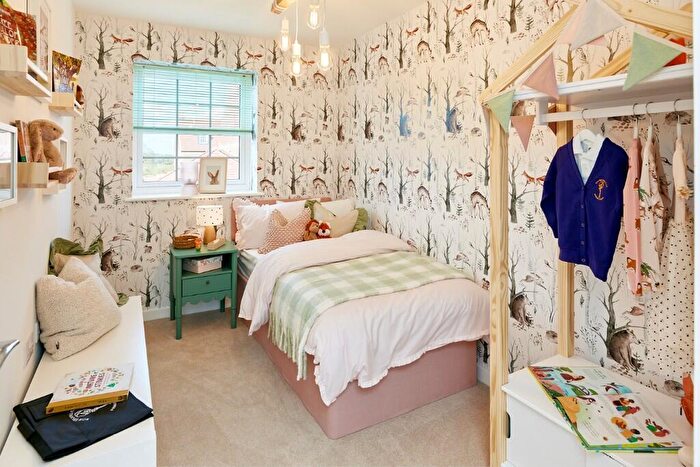
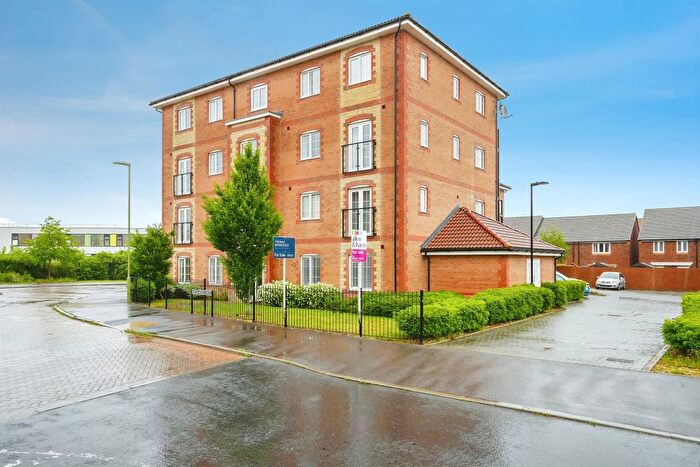
Properties for sale in Didcot
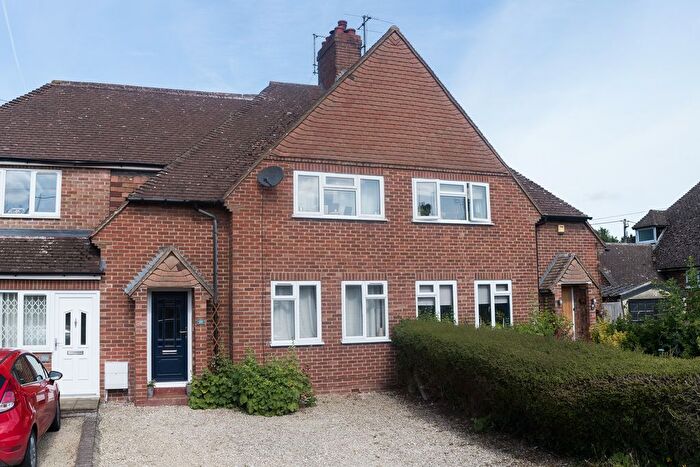
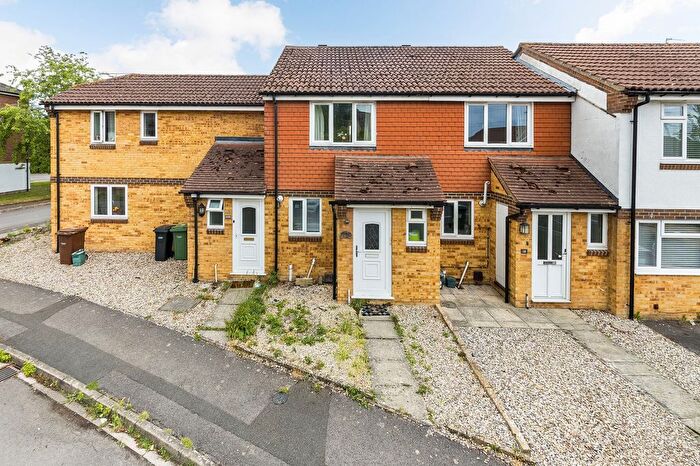
![]()
If you are looking to sell your house, let it out, or receive a property valuation, an expert can help you.
Click the button below to get started.
Neighbourhoods in Didcot
Navigate through our locations to find the location of your next house in Didcot, Oxfordshire for sale or to rent.
Property price trends in Didcot
According to the latest Land Registry data, the average home in Didcot sold for £444,927 in 2026. That figure comes from a substantial record of 26,282 sales logged over the past 31 years.
Prices have continued to climb over the last three years. Compared with 2023, when the typical sale came in around £385,896, that's a rise of roughly 15.3%.
Looking back five years, average prices are up about 20.2% since 2021, a gain of around £74,684 in cash terms.
Zoom out to the past decade for the fuller picture. Back in 2016, homes here averaged £328,789, so the typical sold price has climbed about 35.3% since then, roughly 3.1% a year. Stretch the view to fifteen years and that annual pace edges up closer to 4.4%.
Frequently asked questions about Didcot
What is the average price for a property for sale in Didcot?
The average price for a property for sale in Didcot is £387,565. This amount is 19% lower than the average price in Oxfordshire. There are 8,979 property listings for sale in Didcot.
What locations have the most expensive properties for sale in Didcot?
The locations with the most expensive properties for sale in Didcot are Cholsey at an average of £865,629, Hagbourne at an average of £779,895 and Blewbury And Upton at an average of £712,817.
What locations have the most affordable properties for sale in Didcot?
The locations with the most affordable properties for sale in Didcot are Didcot Northbourne at an average of £286,253, Didcot North East at an average of £297,437 and Didcot Ladygrove at an average of £340,219.
Which train stations are available in or near Didcot?
Some of the train stations available in or near Didcot are Didcot Parkway, Appleford and Culham.
Property Price Paid in Didcot by Year
The average sold property price by year was:
| Year | Average Sold Price | Price Change |
Sold Properties
|
|---|---|---|---|
| 2026 | £444,927 | 12% |
51 Properties |
| 2025 | £393,129 | 3% |
617 Properties |
| 2024 | £379,639 | -2% |
675 Properties |
| 2023 | £385,896 | -1% |
604 Properties |
| 2022 | £389,912 | 5% |
805 Properties |
| 2021 | £370,243 | 7% |
941 Properties |
| 2020 | £343,339 | 0,3% |
764 Properties |
| 2019 | £342,341 | 2% |
942 Properties |
| 2018 | £334,418 | -2% |
1,085 Properties |
| 2017 | £340,755 | 4% |
955 Properties |
Property Price per Property Type in Didcot
Here you can find historic sold price data in order to help with your property search.
The average Property Paid Price for specific property types in the last three years are:
| Property Type | Average Sold Price | Sold Properties |
|---|---|---|
| Semi Detached House | £366,832.00 | 702 Semi Detached Houses |
| Detached House | £598,957.00 | 499 Detached Houses |
| Terraced House | £301,772.00 | 497 Terraced Houses |
| Flat | £193,626.00 | 249 Flats |
Transport in Didcot
Please see below transportation links in this area:
