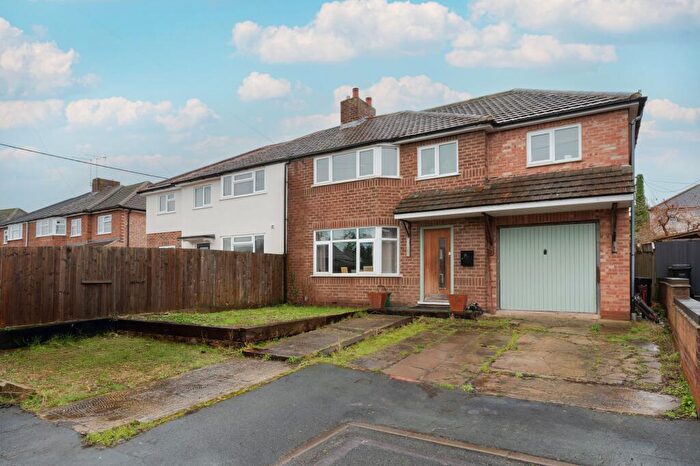
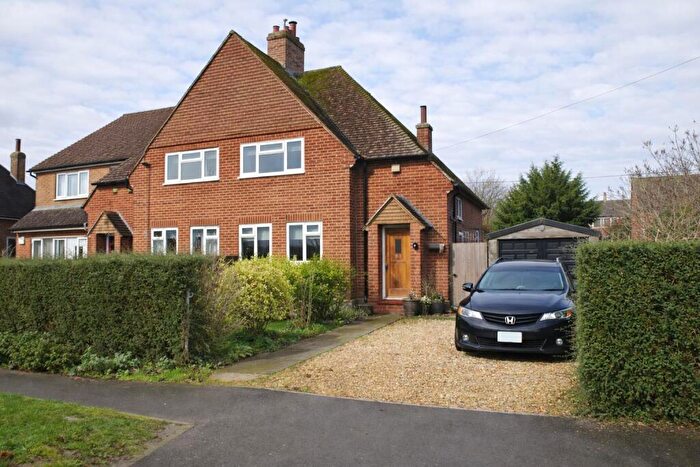
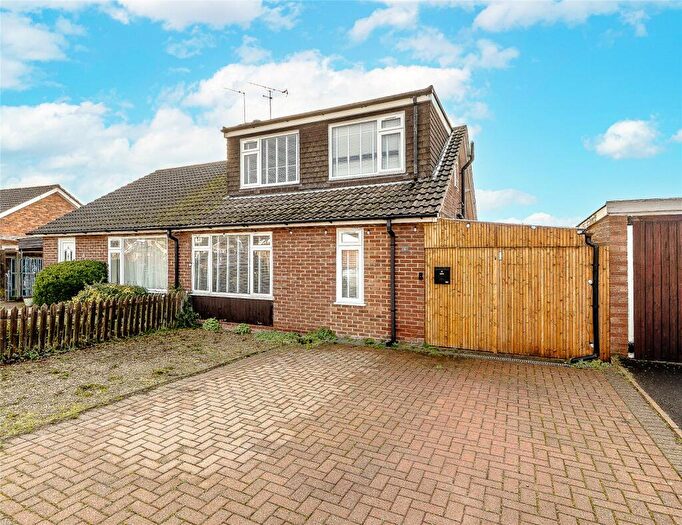
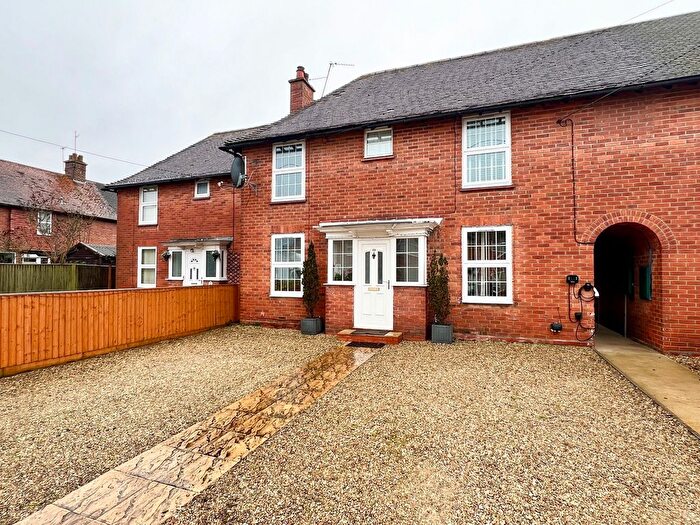
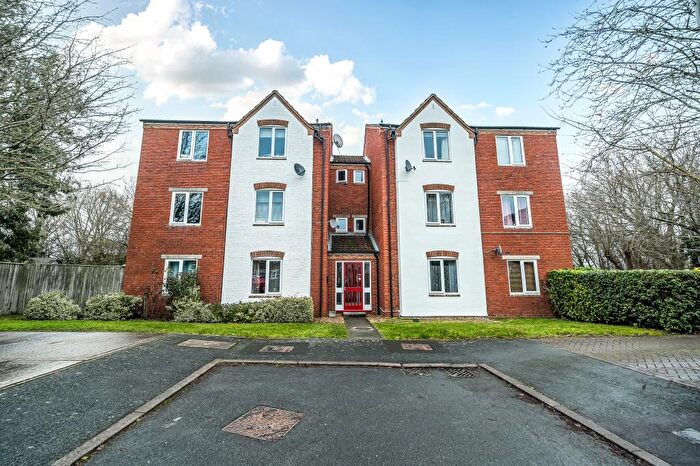
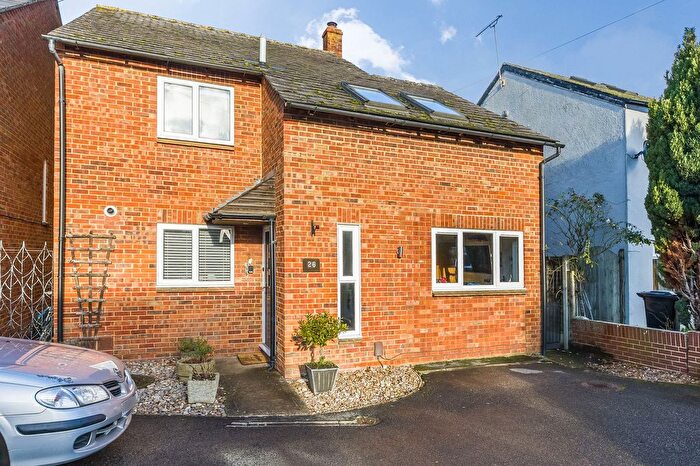
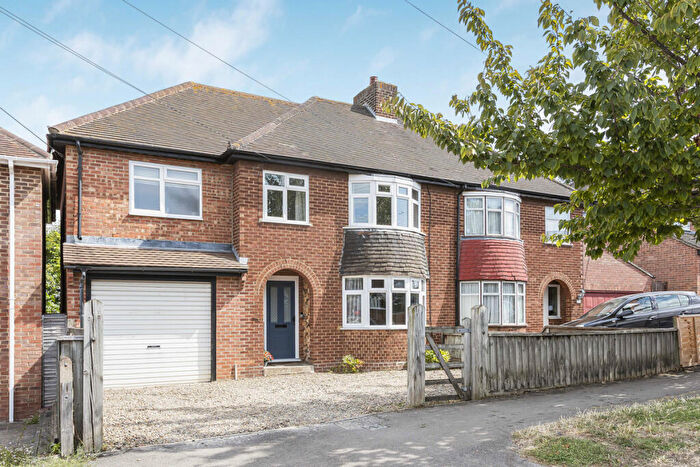
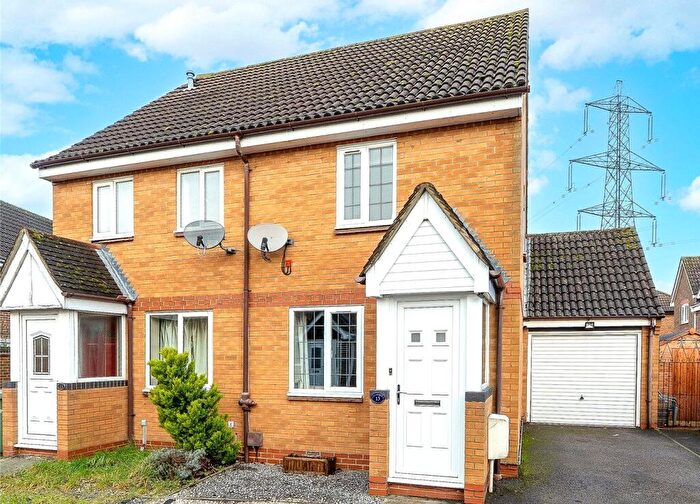
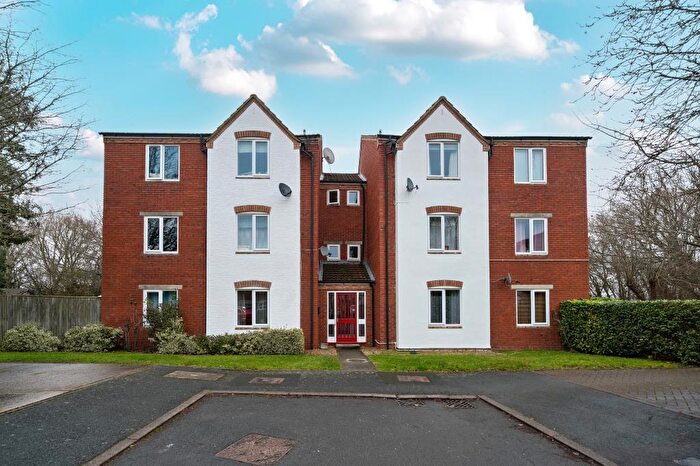
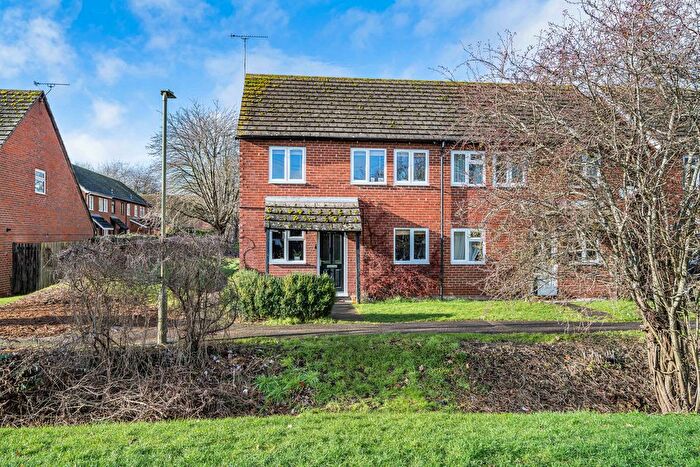
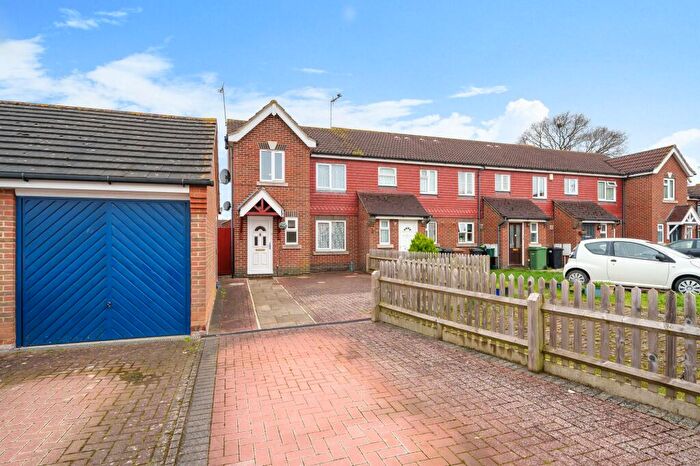
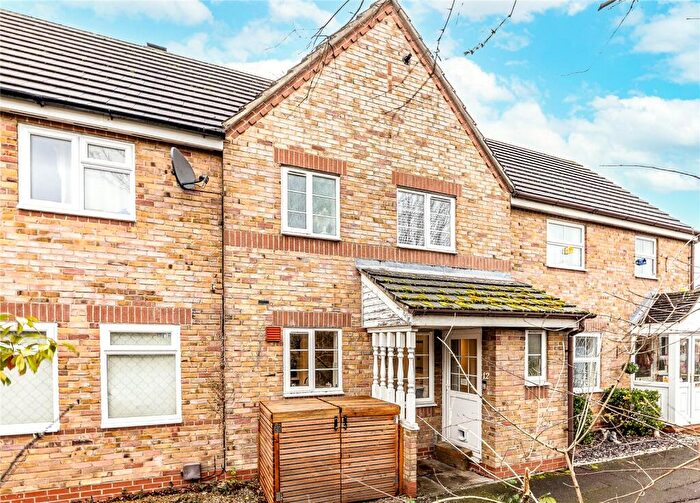
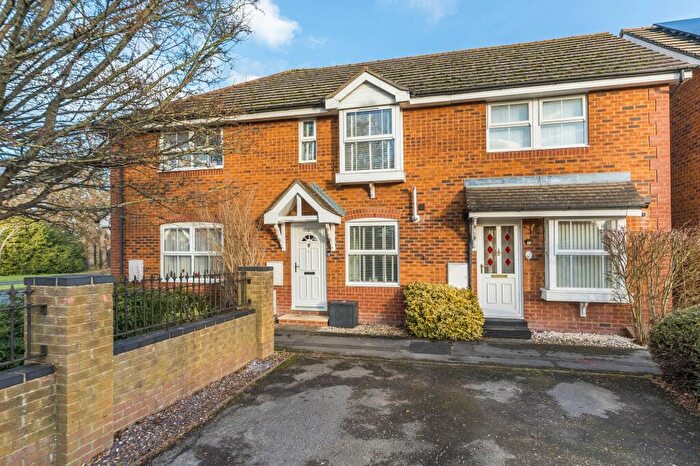
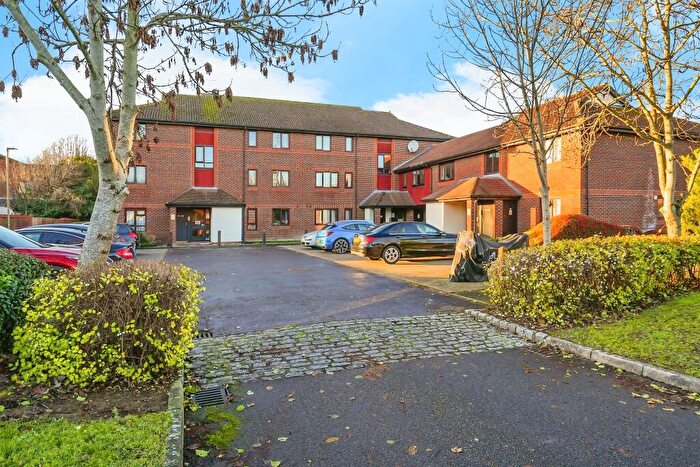
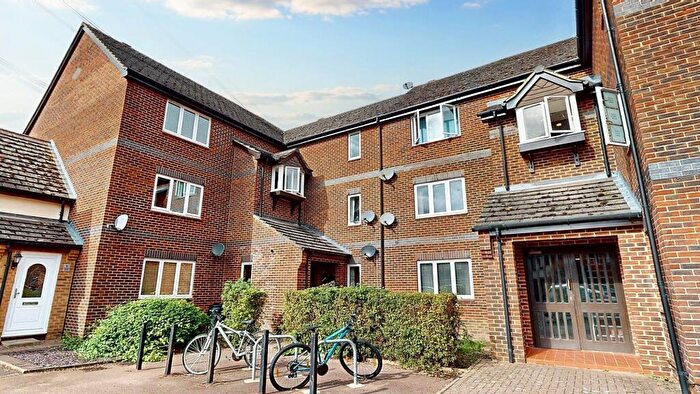
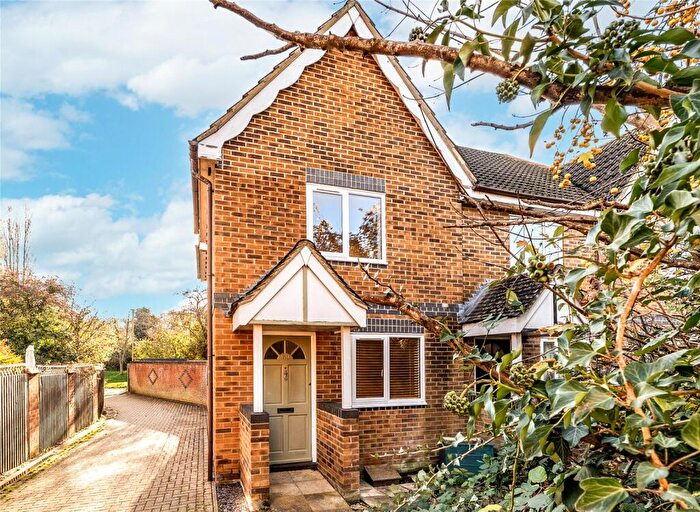
Houses for sale & to rent in Didcot Northbourne, Didcot
House Prices in Didcot Northbourne
Properties in Didcot Northbourne have an average house price of £287,825.00 and had 212 Property Transactions within the last 3 years¹.
Didcot Northbourne is an area in Didcot, Oxfordshire with 2,205 households², where the most expensive property was sold for £820,721.00.
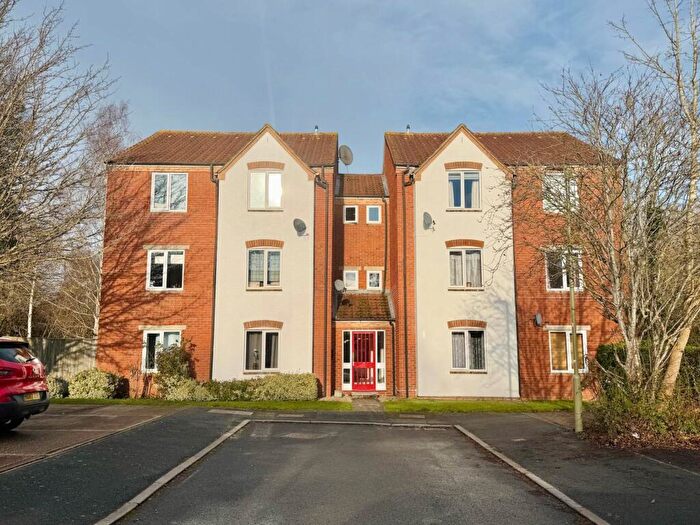
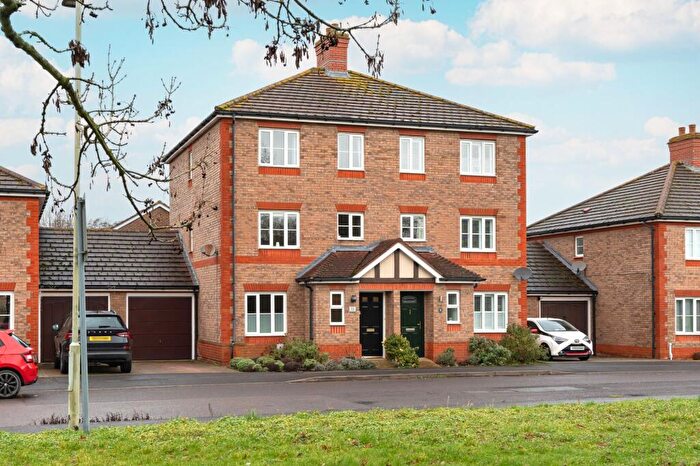
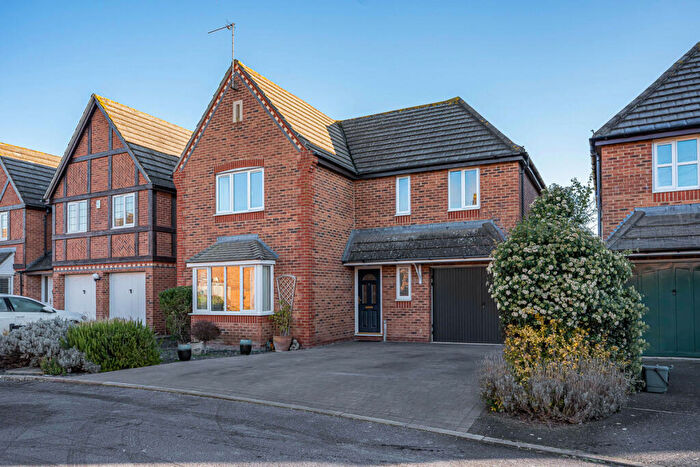
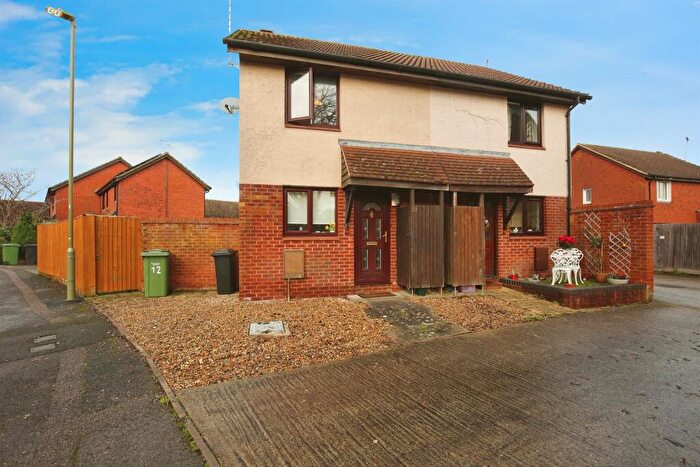
Properties for sale in Didcot Northbourne
Roads and Postcodes in Didcot Northbourne
Navigate through our locations to find the location of your next house in Didcot Northbourne, Didcot for sale or to rent.
| Streets | Postcodes |
|---|---|
| Balliol Drive | OX11 9RH OX11 9RJ |
| Balmoral Road | OX11 8TY OX11 8TZ |
| Beaufort Close | OX11 8TS |
| Bourne Street | OX11 8EH |
| Bridge Close | OX11 8DU |
| Broadway | OX11 8AJ OX11 8AL OX11 8AQ OX11 8DJ OX11 8RQ OX11 8RZ OX11 8SA OX11 8SB |
| Buckingham Close | OX11 8TX |
| Campion Hall Drive | OX11 9RL OX11 9RN |
| Church Street | OX11 8DG OX11 8DQ |
| Cromwell Drive | OX11 9RB |
| East Street | OX11 8EJ |
| Exeter Court | OX11 8UH |
| Fleet Way | OX11 8BZ OX11 8DA |
| Hagbourne Road | OX11 8DH OX11 8DP OX11 8DR OX11 8DT |
| High Street | OX11 8EG OX11 8EQ |
| Kibble Close | OX11 8DE |
| Kynaston Road | OX11 8HA OX11 8HB OX11 8HD OX11 8HE |
| Laburnum Grove | OX11 8BD |
| Linacre Close | OX11 9RG OX11 9RQ |
| Lincoln Gardens | OX11 8UF |
| Magdalen Court | OX11 8UQ |
| Mansfield Gardens | OX11 9RW |
| Marsh Lane | OX11 8DL OX11 8FD |
| Mereland Road | OX11 8AP OX11 8AR OX11 8AT OX11 8AU OX11 8AX OX11 8AY OX11 8BE |
| Merton Close | OX11 8UJ |
| Newlands Avenue | OX11 8PX OX11 8PZ |
| Nuffield Close | OX11 8TW |
| Oriel Court | OX11 8UG |
| Pease Place | OX11 8EY |
| Pebble Drive | OX11 9RE |
| Queen Elizabeth Close | OX11 8TU |
| Regent Gardens | OX11 8DD |
| Richmere Road | OX11 8HT |
| Ridgeway Road | OX11 8HQ |
| Roebuck Court | OX11 8US OX11 8UT OX11 8UU |
| Ruskin Close | OX11 8TN |
| Sandringham Road | OX11 8TP |
| Saxons Way | OX11 9RA |
| Sinodun Road | OX11 8HH OX11 8HJ OX11 8HN OX11 8HP OX11 8HW |
| Somerville | OX11 8UD OX11 8UE |
| Sovereign Close | OX11 8TR |
| St Andrews Road | OX11 8EN OX11 8EW |
| St Annes Court | OX11 9UT |
| St Hildas Close | OX11 9UU OX11 9UX |
| St Hughs Rise | OX11 9UY OX11 9UZ |
| St Johns Close | OX11 8DF |
| St Peters Road | OX11 8EP |
| Stonesfield | OX11 9RF |
| The Croft | OX11 8HR OX11 8HS |
| Vicarage Road | OX11 8EL |
| Viking Drive | OX11 9RD |
| Wessex Road | OX11 8BH OX11 8BJ OX11 8BL OX11 8BN OX11 8BP OX11 8BS OX11 8BT OX11 8BU OX11 8BW OX11 8BX |
| Windsor Close | OX11 8TT |
| Worcester Drive | OX11 8UP OX11 8UR |
Transport near Didcot Northbourne
- FAQ
- Price Paid By Year
- Property Type Price
Frequently asked questions about Didcot Northbourne
What is the average price for a property for sale in Didcot Northbourne?
The average price for a property for sale in Didcot Northbourne is £287,825. This amount is 26% lower than the average price in Didcot. There are 1,389 property listings for sale in Didcot Northbourne.
What streets have the most expensive properties for sale in Didcot Northbourne?
The streets with the most expensive properties for sale in Didcot Northbourne are Saxons Way at an average of £508,750, Buckingham Close at an average of £410,000 and East Street at an average of £406,200.
What streets have the most affordable properties for sale in Didcot Northbourne?
The streets with the most affordable properties for sale in Didcot Northbourne are Roebuck Court at an average of £175,996, Exeter Court at an average of £182,666 and Linacre Close at an average of £184,363.
Which train stations are available in or near Didcot Northbourne?
Some of the train stations available in or near Didcot Northbourne are Didcot Parkway, Appleford and Culham.
Property Price Paid in Didcot Northbourne by Year
The average sold property price by year was:
| Year | Average Sold Price | Price Change |
Sold Properties
|
|---|---|---|---|
| 2025 | £309,968 | 8% |
63 Properties |
| 2024 | £285,934 | 6% |
85 Properties |
| 2023 | £268,540 | -0,1% |
64 Properties |
| 2022 | £268,827 | -9% |
114 Properties |
| 2021 | £292,693 | 8% |
90 Properties |
| 2020 | £269,343 | 7% |
51 Properties |
| 2019 | £250,737 | 0,2% |
67 Properties |
| 2018 | £250,224 | -3% |
59 Properties |
| 2017 | £257,099 | -1% |
80 Properties |
| 2016 | £258,680 | 17% |
95 Properties |
| 2015 | £215,479 | 4% |
106 Properties |
| 2014 | £206,898 | 8% |
98 Properties |
| 2013 | £191,142 | -0,5% |
125 Properties |
| 2012 | £192,059 | 7% |
85 Properties |
| 2011 | £179,491 | 0,4% |
97 Properties |
| 2010 | £178,741 | 2% |
78 Properties |
| 2009 | £174,588 | -4% |
72 Properties |
| 2008 | £181,196 | -6% |
65 Properties |
| 2007 | £192,382 | 17% |
156 Properties |
| 2006 | £160,009 | 7% |
197 Properties |
| 2005 | £148,691 | -2% |
132 Properties |
| 2004 | £152,102 | 15% |
170 Properties |
| 2003 | £129,367 | 4% |
168 Properties |
| 2002 | £124,222 | 22% |
202 Properties |
| 2001 | £97,246 | 12% |
212 Properties |
| 2000 | £85,918 | 14% |
196 Properties |
| 1999 | £74,183 | 11% |
248 Properties |
| 1998 | £65,673 | 13% |
230 Properties |
| 1997 | £56,922 | 10% |
220 Properties |
| 1996 | £51,491 | -6% |
146 Properties |
| 1995 | £54,534 | - |
122 Properties |
Property Price per Property Type in Didcot Northbourne
Here you can find historic sold price data in order to help with your property search.
The average Property Paid Price for specific property types in the last three years are:
| Property Type | Average Sold Price | Sold Properties |
|---|---|---|
| Semi Detached House | £347,475.00 | 73 Semi Detached Houses |
| Detached House | £454,576.00 | 12 Detached Houses |
| Terraced House | £288,926.00 | 69 Terraced Houses |
| Flat | £176,937.00 | 58 Flats |

