
Houses for sale & to rent in Didcot Park, Didcot
House Prices in Didcot Park
Properties in Didcot Park have an average house price of £349k and had 242 Property Transactions within the last 3 years¹.
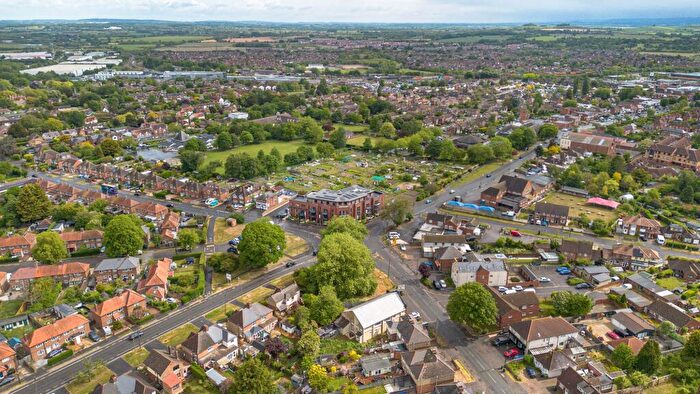
Didcot Park is an area in Didcot, Oxfordshire with 2,169 households², where the most expensive property was sold for £670k.
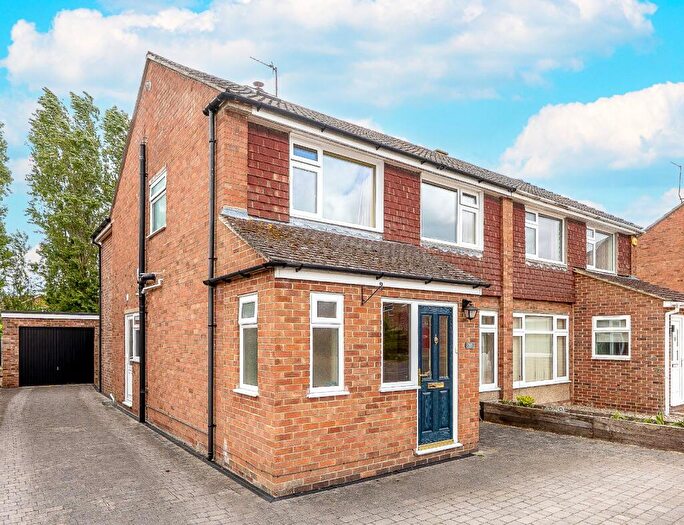
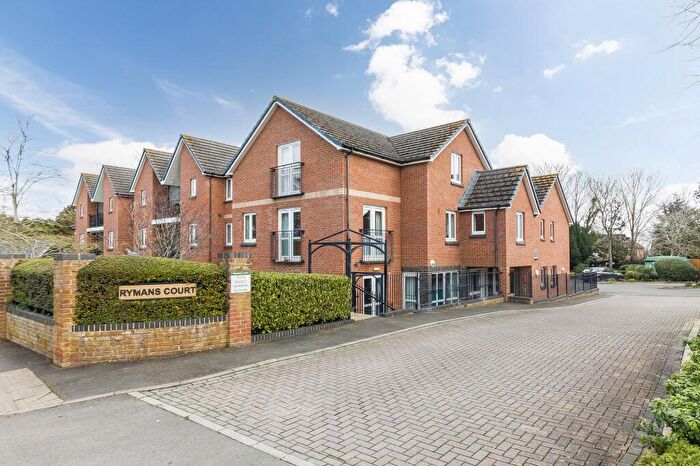
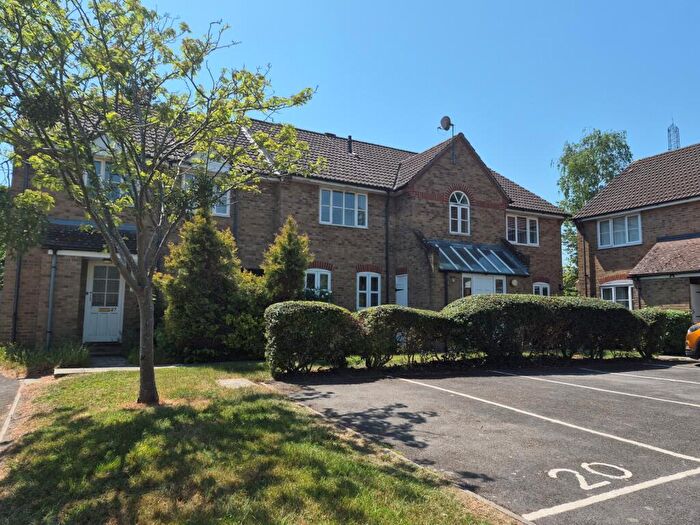
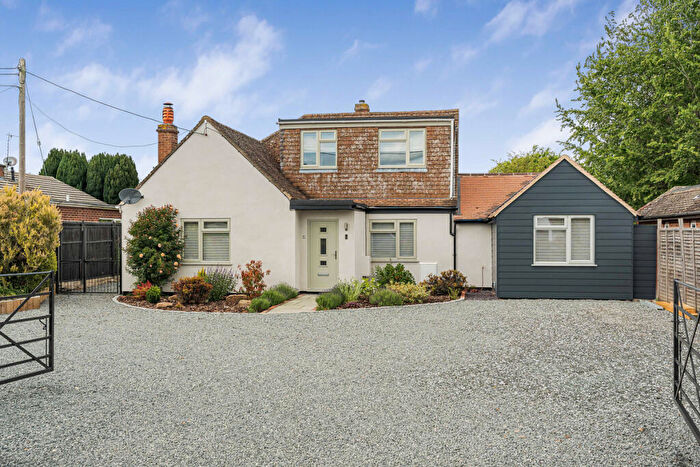
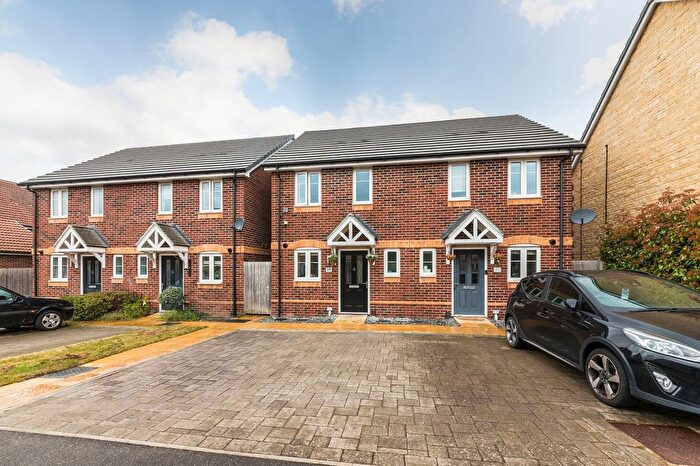
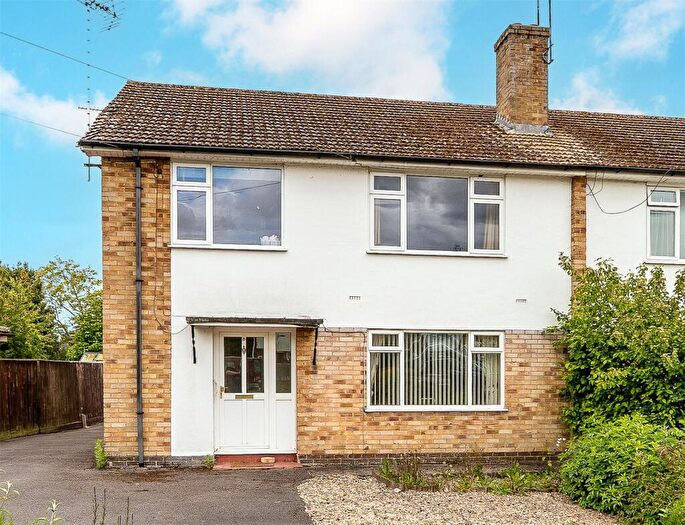
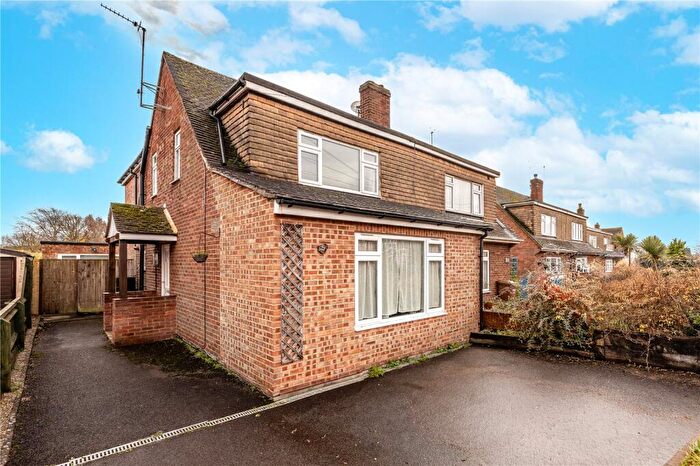
Properties for sale in Didcot Park
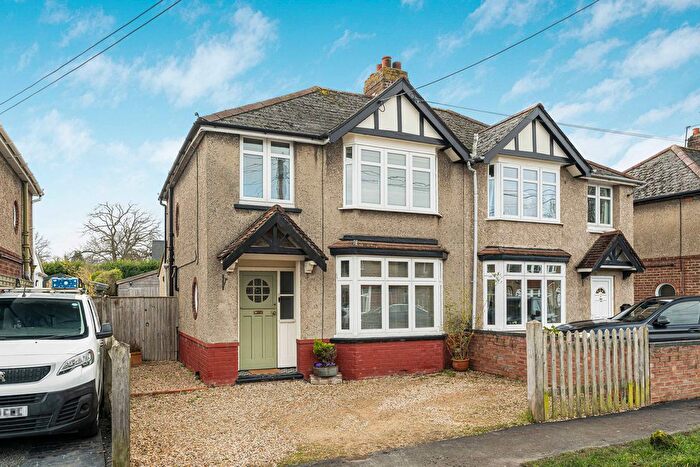
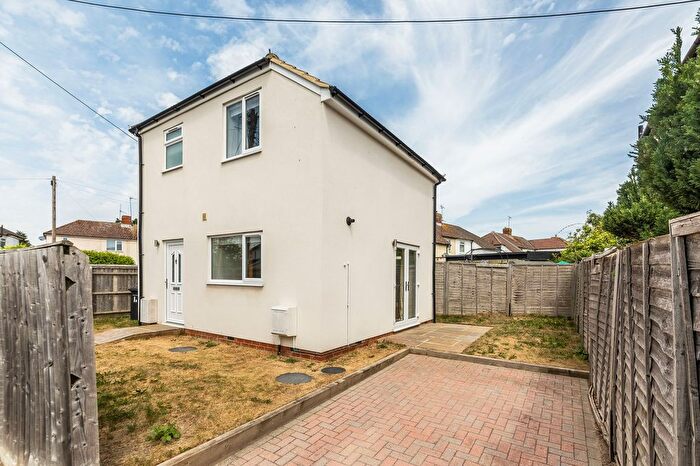

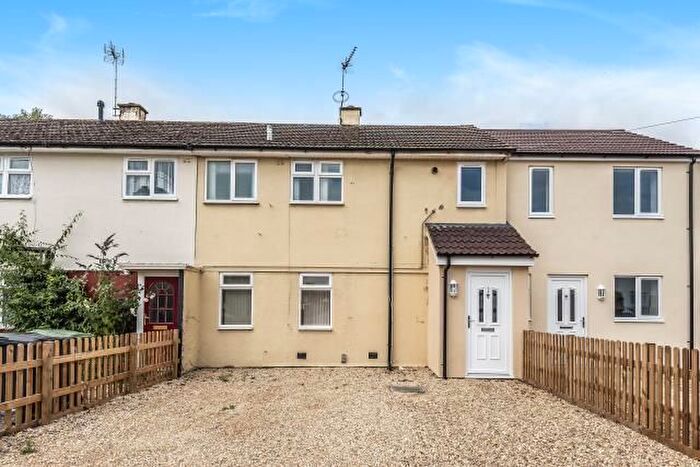
![]()
If you are looking to sell your house, let it out, or receive a property valuation, an expert can help you.
Click the button below to get started.
Roads and Postcodes in Didcot Park
Navigate through our locations to find the location of your next house in Didcot Park, Didcot for sale or to rent.
Transport near Didcot Park

- FAQ
- Price Paid By Year
- Property Type Price
Frequently asked questions about Didcot Park
What is the average price for a property for sale in Didcot Park?
The average price for a property for sale in Didcot Park is £348,772. This amount is 10% lower than the average price in Didcot. There are 1,213 property listings for sale in Didcot Park.
What streets have the most expensive properties for sale in Didcot Park?
The streets with the most expensive properties for sale in Didcot Park are Wheatfields at an average of £520,625, Loyd Road at an average of £464,800 and Newlands Avenue at an average of £464,714.
What streets have the most affordable properties for sale in Didcot Park?
The streets with the most affordable properties for sale in Didcot Park are Marlborough Court at an average of £140,499, Edmonds Court at an average of £190,000 and Fairacres Road at an average of £206,666.
Which train stations are available in or near Didcot Park?
Some of the train stations available in or near Didcot Park are Didcot Parkway, Appleford and Culham.
Property Price Paid in Didcot Park by Year
The average sold property price by year was:
| Year | Average Sold Price | Price Change |
Sold Properties
|
|---|---|---|---|
| 2026 | £388,500 | 9% |
5 Properties |
| 2025 | £352,705 | 3% |
68 Properties |
| 2024 | £342,459 | -2% |
90 Properties |
| 2023 | £350,063 | 1% |
79 Properties |
| 2022 | £345,284 | 13% |
97 Properties |
| 2021 | £298,996 | -3% |
103 Properties |
| 2020 | £307,212 | 2% |
75 Properties |
| 2019 | £300,812 | 2% |
95 Properties |
| 2018 | £294,486 | -2% |
88 Properties |
| 2017 | £298,931 | 1% |
91 Properties |
| 2016 | £294,998 | 8% |
90 Properties |
| 2015 | £271,484 | 9% |
89 Properties |
| 2014 | £247,147 | 10% |
77 Properties |
| 2013 | £221,420 | 4% |
96 Properties |
| 2012 | £211,910 | -3% |
71 Properties |
| 2011 | £218,898 | 5% |
69 Properties |
| 2010 | £207,709 | 4% |
64 Properties |
| 2009 | £199,108 | -7% |
65 Properties |
| 2008 | £212,704 | -7% |
63 Properties |
| 2007 | £226,645 | 18% |
105 Properties |
| 2006 | £186,069 | 2% |
100 Properties |
| 2005 | £183,018 | 3% |
94 Properties |
| 2004 | £177,164 | 10% |
124 Properties |
| 2003 | £158,851 | 2% |
90 Properties |
| 2002 | £155,657 | 24% |
126 Properties |
| 2001 | £119,004 | 9% |
110 Properties |
| 2000 | £108,590 | 16% |
107 Properties |
| 1999 | £91,038 | 16% |
130 Properties |
| 1998 | £76,525 | 10% |
100 Properties |
| 1997 | £68,696 | 12% |
135 Properties |
| 1996 | £60,397 | 7% |
84 Properties |
| 1995 | £56,179 | - |
65 Properties |
Property Price per Property Type in Didcot Park
Here you can find historic sold price data in order to help with your property search.
The average Property Paid Price for specific property types in the last three years are:
| Property Type | Average Sold Price | Sold Properties |
|---|---|---|
| Semi Detached House | £348,583.00 | 126 Semi Detached Houses |
| Detached House | £471,083.00 | 42 Detached Houses |
| Terraced House | £313,260.00 | 57 Terraced Houses |
| Flat | £167,058.00 | 17 Flats |