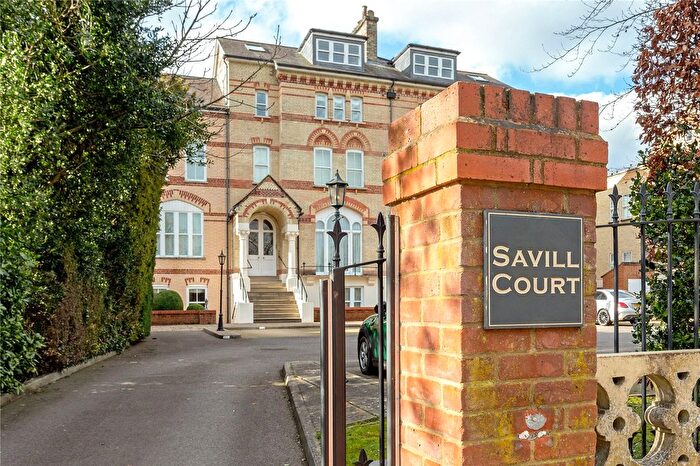
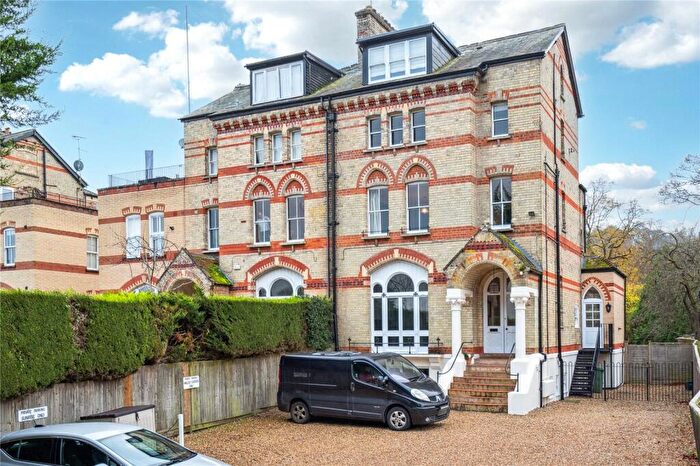
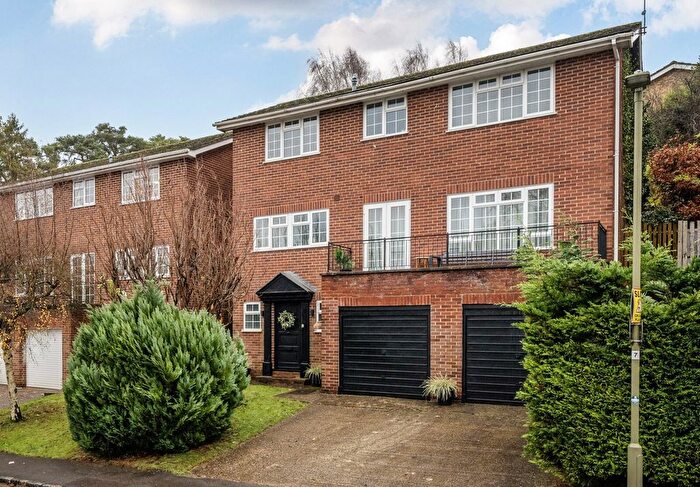
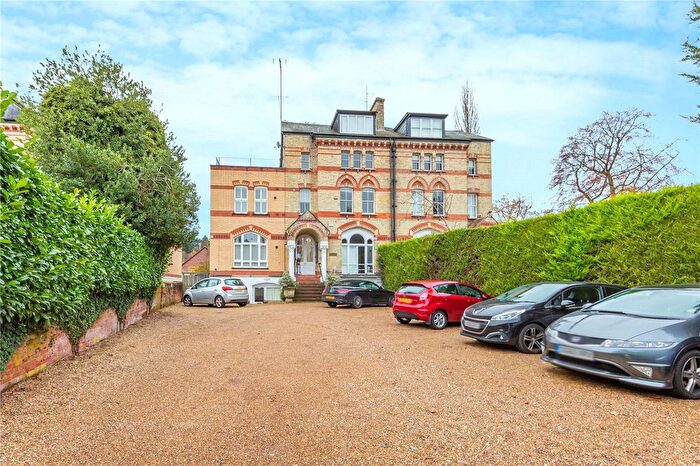
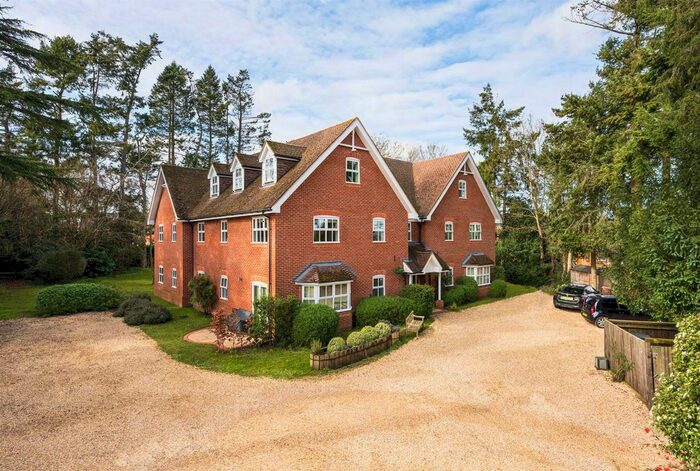
Houses for sale & to rent in Henley North, Henley-on-thames
House Prices in Henley North
Properties in Henley North have an average house price of £715,639.00 and had 366 Property Transactions within the last 3 years¹.
Henley North is an area in Henley-on-thames, Oxfordshire with 2,459 households², where the most expensive property was sold for £4,500,000.00.
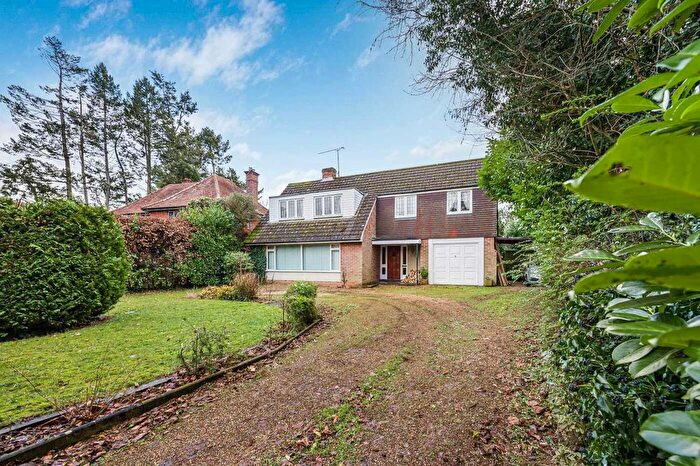
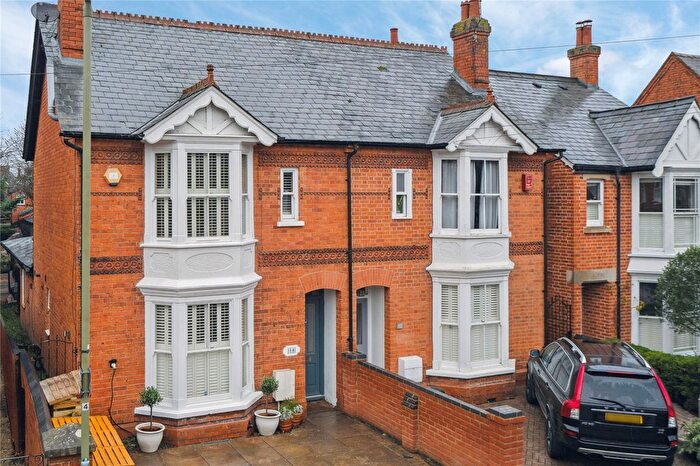
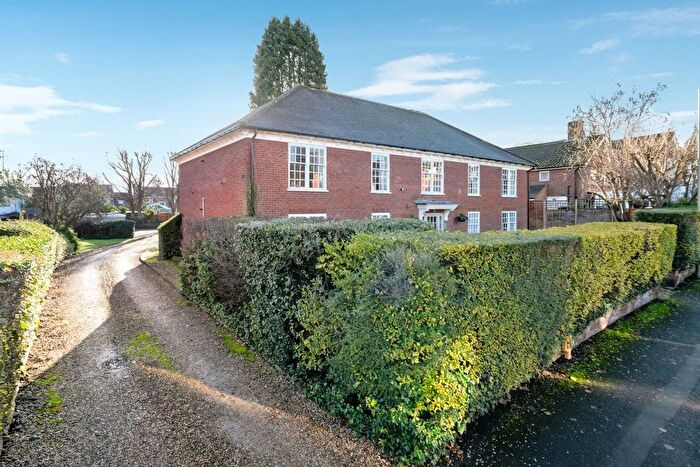
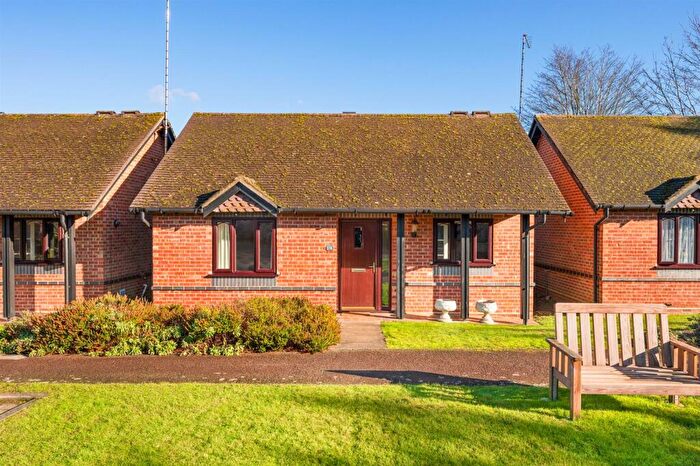
Properties for sale in Henley North
Roads and Postcodes in Henley North
Navigate through our locations to find the location of your next house in Henley North, Henley-on-thames for sale or to rent.
| Streets | Postcodes |
|---|---|
| Abrahams Road | RG9 2ET |
| Adam Court | RG9 2BJ |
| Ancastle Green | RG9 1TR RG9 1TS RG9 1UL RG9 1UN RG9 1UQ |
| Badgemore Lane | RG9 2JH |
| Barlows Mews | RG9 2AB |
| Baronsmead | RG9 2DL |
| Bell Lane | RG9 2HP RG9 2HR |
| Bell Street | RG9 2BA RG9 2BD RG9 2BG RG9 2BN |
| Bell Street Mews | RG9 2BF |
| Bowling Court | RG9 2LE |
| Chalcraft Close | RG9 1QZ |
| Chiltern Close | RG9 1RH |
| Chiltern End Close | RG9 1SQ |
| Clarence Road | RG9 2DP |
| Clements Road | RG9 2HJ |
| Cooper Road | RG9 2ES |
| Crisp Road | RG9 2EN RG9 2EP RG9 2EW RG9 2HG |
| Deanacre | RG9 1GQ |
| Deanfield Avenue | RG9 1UE |
| Deanfield Road | RG9 1UG RG9 1UU |
| Duke Street | RG9 1UP RG9 1UR |
| Elizabeth Close | RG9 1RE |
| Elizabeth Road | RG9 1RA RG9 1RG RG9 1RJ |
| Empstead Court | RG9 2EQ |
| Fairmile | RG9 2JP RG9 2JR RG9 2JU RG9 2JX RG9 2JY RG9 2JZ RG9 2LA RG9 2LB RG9 6AD |
| Friday Street | RG9 1AL RG9 1AN |
| Gainsborough Crescent | RG9 1TA RG9 1TB |
| Gainsborough Hill | RG9 1SS RG9 1ST |
| Gainsborough Road | RG9 1SU RG9 1SX RG9 1SY RG9 1SZ |
| Gravel Hill | RG9 2EE RG9 2EF RG9 2EG |
| Gravett Close | RG9 1XW |
| Greys Road | RG9 1QR RG9 1QU RG9 1QW RG9 1QX RG9 1QY RG9 1RY RG9 1TF |
| Harcourt Close | RG9 1UZ |
| Hart Street | RG9 2AR RG9 2AU |
| Haywards Close | RG9 1UY |
| Hobbs End | RG9 1RT |
| Hop Gardens | RG9 2EH |
| King James Way | RG9 1XL |
| Kings Close | RG9 2DS |
| Kings Road | RG9 2DF RG9 2DG RG9 2DN RG9 2DQ RG9 2DW |
| Kings Walk | RG9 2DJ |
| Knappe Close | RG9 1XP |
| Lambridge Wood Road | RG9 3BP RG9 3BS |
| Lauds Close | RG9 1UX |
| Leaver Road | RG9 1UW |
| Leicester Close | RG9 2LD |
| Luker Avenue | RG9 2EU RG9 2EX RG9 2EY RG9 2HA RG9 2HH |
| Market Place | RG9 2AA RG9 2AG RG9 2FA |
| Marlow Road | RG9 2JA RG9 2JB |
| Milton Close | RG9 1UJ |
| Mount View | RG9 2EJ RG9 2EL RG9 2HB RG9 2HD RG9 2HE |
| New Street | RG9 2BP RG9 2BT RG9 2NH |
| Nicholas Road | RG9 1RB |
| Northfield Close | RG9 2LH |
| Northfield End | RG9 2HN RG9 2JG RG9 2JJ RG9 2JL RG9 2JN RG9 2JQ |
| Old Brewery Lane | RG9 2DE RG9 2LJ |
| Pack & Prime Lane | RG9 1TT |
| Paradise Mews | RG9 1UD |
| Paradise Road | RG9 1UA RG9 1UB |
| Parkside | RG9 1TX |
| Pearces Orchard | RG9 2LF |
| Peels Yard | RG9 2FD |
| Periam Close | RG9 1XN |
| Phyllis Court Drive | RG9 2HS RG9 2HU RG9 2NA |
| Radnor Close | RG9 2DA |
| Ravenscroft Road | RG9 2DH |
| Rupert Close | RG9 2JD |
| Ruperts Lane | RG9 2JE |
| Sherwood Gardens | RG9 1QJ |
| Simmons Road | RG9 2ER |
| St Annes Close | RG9 1XA |
| St Marys Close | RG9 1RD |
| Thameside | RG9 1BH |
| Tilebarn Close | RG9 1US |
| Tilebarn Lane | RG9 1RN RG9 1RS |
| Tuns Lane | RG9 1SA |
| Two Tree Hill | RG9 1RQ |
| Valley Road | RG9 1RL RG9 1RR |
| West Street | RG9 2DT RG9 2EA RG9 2ED |
| Wharfe Lane | RG9 2LL |
| York Road | RG9 2DR |
| RG9 4NR |
Transport near Henley North
- FAQ
- Price Paid By Year
- Property Type Price
Frequently asked questions about Henley North
What is the average price for a property for sale in Henley North?
The average price for a property for sale in Henley North is £715,639. This amount is 17% lower than the average price in Henley-on-thames. There are 1,216 property listings for sale in Henley North.
What streets have the most expensive properties for sale in Henley North?
The streets with the most expensive properties for sale in Henley North are Lambridge Wood Road at an average of £2,960,000, Hart Street at an average of £2,068,666 and Leicester Close at an average of £1,722,500.
What streets have the most affordable properties for sale in Henley North?
The streets with the most affordable properties for sale in Henley North are Tilebarn Close at an average of £248,312, Sherwood Gardens at an average of £342,400 and Knappe Close at an average of £350,000.
Which train stations are available in or near Henley North?
Some of the train stations available in or near Henley North are Henley-On-Thames, Shiplake and Wargrave.
Property Price Paid in Henley North by Year
The average sold property price by year was:
| Year | Average Sold Price | Price Change |
Sold Properties
|
|---|---|---|---|
| 2025 | £634,544 | -19% |
55 Properties |
| 2024 | £757,536 | 2% |
103 Properties |
| 2023 | £743,479 | 6% |
81 Properties |
| 2022 | £699,023 | 8% |
127 Properties |
| 2021 | £645,979 | -5% |
186 Properties |
| 2020 | £680,510 | 10% |
105 Properties |
| 2019 | £614,174 | -1% |
117 Properties |
| 2018 | £617,380 | -7% |
89 Properties |
| 2017 | £661,564 | -0,4% |
99 Properties |
| 2016 | £663,893 | 17% |
125 Properties |
| 2015 | £552,263 | 14% |
130 Properties |
| 2014 | £475,494 | -4% |
142 Properties |
| 2013 | £495,846 | -3% |
126 Properties |
| 2012 | £509,562 | 23% |
121 Properties |
| 2011 | £392,696 | 1% |
108 Properties |
| 2010 | £389,328 | -7% |
124 Properties |
| 2009 | £416,234 | -3% |
100 Properties |
| 2008 | £430,160 | -6% |
82 Properties |
| 2007 | £457,395 | 18% |
171 Properties |
| 2006 | £376,065 | 7% |
181 Properties |
| 2005 | £350,373 | 1% |
109 Properties |
| 2004 | £348,484 | 8% |
148 Properties |
| 2003 | £319,454 | 7% |
153 Properties |
| 2002 | £297,064 | 16% |
173 Properties |
| 2001 | £250,971 | 7% |
141 Properties |
| 2000 | £234,062 | 12% |
153 Properties |
| 1999 | £206,540 | 16% |
169 Properties |
| 1998 | £173,338 | 11% |
139 Properties |
| 1997 | £154,317 | 17% |
175 Properties |
| 1996 | £128,554 | 1% |
128 Properties |
| 1995 | £126,848 | - |
118 Properties |
Property Price per Property Type in Henley North
Here you can find historic sold price data in order to help with your property search.
The average Property Paid Price for specific property types in the last three years are:
| Property Type | Average Sold Price | Sold Properties |
|---|---|---|
| Semi Detached House | £697,010.00 | 72 Semi Detached Houses |
| Detached House | £1,036,260.00 | 88 Detached Houses |
| Terraced House | £701,713.00 | 114 Terraced Houses |
| Flat | £440,793.00 | 92 Flats |

